 MetaTrader 5
 专家
 指标
 程序库
 实用工具
 窗口小部件
 规则
适用于MetaTrader 5的免费技术指标 - 56
 技术指标的信号外汇和股票市场的开仓交易和平仓交易起着至关重要的作用。指标的本质就是一种交易品种的数学转换,旨在预测未来的价格变化。
测试技术指标可以更有利于预测市场行为并从中获利。

MT5 Alert Indicator Please add Ema moving averages 60/100/200 & Rsi period 10 levels 30/70 to your chart. This indicator alert on a trend reversal strategy were - ema 60 > 100&200 - ema 100 < 200 And the Rsi is below 30 FOR BUY SIGNAL
Use this strategy in confluence with a larger timeframe trend in the same direction. This strategy identifies great entry opportunities to enter an early trend.
FREE

Multi-Symbol Correlation and Exposure Dashboard
TAGLINE
Avoid stacking the same risk without realizing it.
PRODUCT OVERVIEW
CorrelationGuard Navigator MT5 is a correlation and exposure-awareness indicator for MetaTrader 5. It is designed to help traders monitor how closely the current chart symbol is moving relative to a custom watchlist of other symbols.
Instead of using the indicator to find an entry directly, the trader uses it to manage risk concentration and avoid duplicate exposure.
FREE

Trading Session Activity Dashboard
TAGLINE
Trade the session, not just the candle.
PRODUCT OVERVIEW
SessionEdge Navigator MT5 is a session-analysis indicator for MetaTrader 5. It tracks the major trading sessions and provides a practical dashboard showing whether a session is active, how much range it has produced, how that range compares with its recent average, and whether current session behavior is bullish, bearish, or range-like.
Covered sessions: - Sydney - Tokyo / Asian - London - N
FREE

Yellow Indicator by Quant Atlas Creator: https://www.quant-atlas.com/ Yellow Indicator is a clean reversal focused trading tool designed to highlight potential turning points using momentum behavior and RSI structure. The indicator looks for moments where momentum has moved through an important zone and begins to show signs of exhaustion. When conditions align, it plots dark yellow triangle signals directly on the chart. Both bullish and bearish signals use the same dark yellow visual identity,
FREE

Trend Reversal alert: The concept of the EA is to give you a message/alert when something happens in the market, so you will never pass a tradechance for a trendreversaltrade. The EA give you the message when the chance is higher for a trendreversal, but it is important to say that this doesn`t mean that you should trade every signal. The advantage provided by the program is that you don`t need to sit the hole time for the PC and look at the chart because you get a message when a good trendrever
FREE

The seven currencies mentioned are: GBP (British Pound): This is the currency of the United Kingdom. AUD (Australian Dollar): This is the currency of Australia. NZD (New Zealand Dollar): This is the currency of New Zealand. USD (United States Dollar): This is the currency of the United States. CAD (Canadian Dollar): This is the currency of Canada. CHF (Swiss Franc): This is the currency of Switzerland. JPY (Japanese Yen): This is the currency of Japan. Currency strength indexes provide a way to
FREE

SMC Trend Matrix FREE (v3.15) — Professional Multi-Timeframe Analytical Hub SMC Trend Matrix FREE is a high-performance analytical tool based on Smart Money Concepts (SMC). It is designed to filter out market noise and identify high-probability institutional supply and demand zones across multiple timeframes simultaneously. Version 3.15 is a massive upgrade from v2.73, focusing on execution speed, UI/UX, and professional market structure analysis.
The Core Algorithm The indicator utilizes
FREE

The indicator measures the frequency of incoming ticks to analyze the market activity. Bullish and bearish ticks are analyzed separately, informing about the currently predominant market sentiment. According to observations, an increase in the frequency of ticks (panic) indicates the beginning of strong price changes, and an increase in the frequency of ticks in a particular direction not only accompanies a price change in this direction, but also often anticipates it. The indicator is indispens
FREE

Smc Trend Heatmap The Smc Trend Heatmap is a free multi-timeframe bias dashboard for MetaTrader 5. It scans five timeframes simultaneously - M5, M15, M30, H1, and H4 - and shows the current trend direction on each using a three-condition EMA logic. The dashboard updates continuously in a corner panel and provides an overall bias summary across all active timeframes. The indicator does not draw lines or arrows on the price chart. It operates entirely as a panel and can be placed on any chart rega
FREE

这是一款适用于 MetaTrader 5 的多品种仪表板指标,可同时提供多达 20 个交易品种的市场倾向(bias)和价格区间状态的实时概览。其专业版(Pro Version)包含通知功能,可在 Mql5 商店获取。
主要特点:
可加载至任意图表 — 运行独立于图表当前的交易品种。
实时仪表板表格,显示:
当前价格
日、周、月度倾向(当前价格与对应周期开盘价的对比)
日、周、月度区间状态:
HIGH(高位)→ 价格突破上一周期的最高点(看涨突破)
LOW(低位)→ 价格跌破上一周期的最低点(看跌突破)
NO BIAS(无倾向)→ 价格仍处于上一周期的区间内
整体倾向 — 基于日/周/月度倾向的多数投票结果(看涨或看跌)
智能通知(仅在 M15 K 线收盘时触发以减少干扰):(仅限专业版)
整体倾向变化
区间突破(高点/低点)
单个周期倾向反转
首次加载时:发送所有品种的综合汇总信息
视觉自定义:
通过按钮切换仪表板显示/隐藏
可调整宽度、颜色和字体大小
支持按倾向排序(看涨品种置顶)
支持任意交易品种(外汇、黄金、指数等) — 只需输入“市场报价
FREE
️ 重要提示:评估版本 - 限制交易品种支持 此指标目前仅供评估使用,仅支持以下交易品种: EURUSD(欧元美元) Volatility 50 (1s) Index(波动率50指数) 该指标无法在其他任何交易品种上运行。 Richchild 四分理论指标 评估版 专业市场结构分析工具 概述 这是一个专业的交易指标,旨在使用动态区间计算和基于四分位的价格分析来分析市场结构。该指标通过自动化周期分析和关键价格水平的可视化表示提供全面的市场洞察。 如何使用此指标 开始使用 品种选择 :确保您正在交易EURUSD或Volatility 50 (1s) Index 时间框架选择 :使用底部的时间框架按钮选择您的分析周期(M15, M30, H1, H4, H6, H12, D1, W1, MN1) 视觉控制 :使用控制按钮切换高/低线并在深色/浅色主题之间切换 读取仪表板 主仪表板显示多个时间框架的实时数据: TF :正在分析的时间框架 L% :当前价格从周期低点的位置(0-100%) H% :当前价格从周期高点的位置(负值表示低于高点) Quarter :您当前所在的时间四分
FREE

Exhaustion Count MTF 只做一件事:计数。它不预测方向,也不告诉你该往哪边交易。它只回答一个问题:这段行情是否已经持续得足够久,久到参与者正在耗尽。 图表上运行着两个彼此独立的阶段,即 setup 与倒数计数。两者各有自己的规则、自己的取消条件,以及在 EA 可读缓冲区中各自的位置。 Setup 阶段 连续九根收盘价位于四根之前那根收盘价的同一侧,并由一次价格翻转启动。不满足条件的一根会把计数清零,而不是暂停计数。第八或第九根若突破第六根与第七根的极值,该 setup 即被完善,本产品在数字后加一个点表示。完成的 setup 会在身后留下一条水平价位,本产品称之为 Setup Barrier。 倒数计数阶段 十三根,不必连续,每一根都收在两根之前那根的极值之外。将要承担第十三个计数的那根,还必须收在承担第八个计数那根的极值之外。若未做到,计数停在十二并继续等待,这就是延后的十三。 取消与重启 倒数计数会被反向 setup 取消,也会被穿过 Setup Barrier 的收盘取消;当同方向的又一个 setup 完成时,它会重新开始。 廉价实现最常丢掉的正是取消与重启规则
FREE

每位交易者都经历过这样的循环:打开指标设置,改一个数值,点击确定,盯着图表看,觉得不对,再打开设置,又改回去。CCI Live Tuner 让这一切到此为止。 这是一款可以 直接在图表上实时调节 的 Commodity Channel Index。图表上会显示一个小面板,带有 CCI 周期和两条水平线的滑块。拖动滑块,指标就会在后台立即重新计算并重绘,变化在您眼前实时呈现。看起来合适了,就完成了——不需要对话框,不需要点确定,不需要保存后再重新打开。 还有实时样式编辑器。 打开内置编辑器,用 16 色调色板和 RGB 滑块修改 CCI 线与水平线的颜色和粗细。修改的瞬间就会呈现在图表上。可从三种内置主题(Night Cyan、Graphite Gold、Clean Light)中选择,让面板与您的图表风格相配。 您的设置会 按图表分别保存 ——周期、水平线、价格类型、颜色和线宽在重启后都会原样恢复。 您会喜欢它的理由 即时反馈。 拖动即见结果。几秒钟就能找到合适的周期,而不是在设置窗口里来回折腾十几次。 实时调整样式。 线条与水平线的颜色和宽度在编辑时就直接反映在图表上——无需重新打开
FREE

AZ_custom_daily_candle The indicator allows you to draw the contours of daily candles on small timeframes, plus you can customize the display of, for example, an H1 candle and see how it looks on the M5 chart (I think this is a useful setting for scalping). Further, it is possible to shift the beginning/end of drawing candles, change the background color, line thickness. Suggestions and wishes are welcome. v 1.05 (31/03/2025)
By demand, I have added the ability to turn on/off daily maximum/mini
FREE
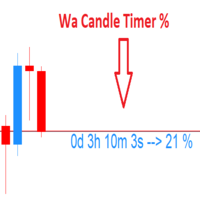
Wa Candle Timer Percentage MT5 is an indicator which shows the user how much time is remaining until the next candle will form. The percentage of the evolution of the current candle is also displayed. The user can set the percentage that the candle timer will change the color. These are the settings: 1- The percentage that the candle timer will change the color. 2- Color of Candle Timer when it's BELOW the percentage set by the user. 3- Color of Candle Timer when it's ABOVE the percentage set b
FREE

MSX Heikin Ashi Advanced Overview MSX Heikin Ashi Advanced is a MetaTrader 5 indicator designed to provide a smoothed visual representation of price movement using a modified Heikin Ashi calculation. The indicator applies Heikin Ashi calculations to user-selected price sources and displays color-based candles that may assist with trend observation and market structure analysis. Features • Modified Heikin Ashi candle calculation • Real-time candle updates • Multiple applied price options • Color
FREE
The donchian channel indicator might just be the best fit for you
Trading in derivative products such as futures, options, CFD's, forex and certificates contains significant risk. These products are not suitable for every investor. Investors could potentially lose all or more than the original investment. If anything, only money equal to personal risk capital should be used and can be lost without jeopardizing financial security or lifestyle. Partially or fully automated trading programs can
FREE
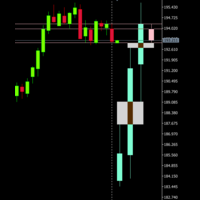
If you like this product, please give it a 5 star rating as a token of appreciation. This indicator projects Higher-Timeframe (HTF) candles onto the current chart and optionally shows their OHLC lines and Fair Value Gaps (FVGs) using ICT 3-candle logic.
Projects multiple higher timeframe candles.
Accurately preserves HTF OHLC on any lower timeframe.
Allows spacing adjustment between projected candles.
Optionally displays OHLC horizontal reference lines.
Automatically detects and draws HTF Fair
FREE

Support zones are created from confirmed pivot lows with positive volume conditions, while resistance zones are created from confirmed pivot highs with negative volume conditions. The visual boxes are color-coded to make analysis easier: green zones represent potential support areas, and red zones represent potential resistance areas. The indicator also includes hold signals and breakout labels. Hold markers help traders observe when price reacts from a zone, while breakout labels show when a su
FREE

Daily pivot are relatively important in trading.
This indicator have options to select 5 commonly use pivot point calculations.
User input Choose Pivot Point Calculation (Method Classic, Method Camarilla, Method TomDeMark, Method Fibonacci or Method Woodies.) Choose Applied Timeframe for the calculation (M5, M15, H1, H4, D1, W1 etc) Can be attached to any timeframe Choose color of Pivot point Note:
For MT4, please refer here : https://www.mql5.com/en/market/product/22280
FREE

Zone Alerts by iXOpay - MT5 Indicator What it is Indicator that marks price zones and sends alerts when the price touches, breaks, exits, or retests those zones. Neutral, informative tool. No promises of profit. How to use Attach to any symbol and timeframe. Set the zone boundaries and enable the desired events. Optionally enable trend/volatility filters. Receive alerts and manage your plan. Inputs EMA_Period (20/50/100/200) - optional trend filter Stoch_K , Stoch_D , Stoch_Smooth - confirmation
FREE

Magic Number Manager (OrderByMagic) Magic Number Manager (OrderByMagic) is a display-only MetaTrader 5 indicator that reads all open positions and groups them by magic number directly on the chart, refreshed every couple of seconds. It never opens, closes or modifies any trade. Features Live grouping by magic number: instantly see which positions belong to which EA. Per-group overview: total lots and profit/loss for each magic number. Collision detection: spot when two EAs share a magic number,
FREE

MACD and Price Structure Confluence Indicator The indicator is based on the principles of the MACD in its formula , combined with price structure, support, and resistance levels identified on the D1 (Daily) timeframe . The regions identified by the system are represented by dashed lines extending across the entire chart , allowing users to visually monitor important levels within the market structure. The system's studies and analysis were primarily conducted using the M30 (30-minute) timeframe
FREE
An indicator for analyzing different currency pairs simultaneously Forex is a complex market that requires several currency pairs to be analyzed simultaneously Determine the number of currency pairs yourself Determine the currency pair you want to analyze to analyze 4 of the most important and similar currency pairs at the same time. For direct and simple analysis, some currency pairs have changed (EURUSD>>>USDEUR) Do not doubt that to succeed in this market, you must analyze several currency pa
FREE

BarionQuant MACD Color Lite displays a custom four-color MACD histogram that makes momentum shifts easy to read at a glance. DIF and DEF lines are included; divergence detection is reserved for the paid Divergence Pro edition. HOW IT WORKS DIF = Fast EMA(12) minus Slow EMA(26) DEF = Smoothed signal line of DIF Energy = (DIF − DEF) × 2, split into four histogram colors: Above zero, lengthening → red (momentum building) Above zero, shortening → aqua (momentum fading) Below zero, lengthening → gree
FREE

This is my ea Gold Structure Hunter EA
https://www.mql5.com/en/market/product/174076?utm SMART MARKET DASHBOARD Everything You Need. One Clear View. Make your market analysis faster, cleaner, and more organized with a dashboard that brings important price, VWAP, opening-price, and trend information together in one place. Instead of checking multiple indicators separately, the dashboard gives you a quick market overview so you can understand where price is trading and what the current t
FREE
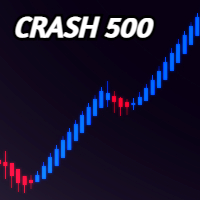
FOR CRASH 500 ONLY!! MT5
*This is a smooth heiken ashi setup meant to be used on CRASH 500 in combination with other indicators. *You are welcome to test it on other markets aswell. *I will be posting other indicators aswell to help with trading the crash 500 market. *You can use this to help smooth out price if you do struggle with reading the charts as is. * Just note heiken ashi doesnt represent real price action only smoothes it out for ease of read.
FREE
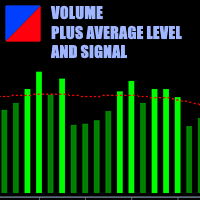
This is a volume indicator with the addition of a threshold level that can be set to a fixed value chosen personally or obtained from the average of the volume values themselves. The type of averaging method can be selected in the input parameters.
The input parameters are easy to interpret but let's examine them:
1 - Volume type Here you can select the type of volume you want to see represented and there are 2 choices, either TICK volume or REAL volume. Keep in mind that for forex, for examp
FREE
This indicator is based on Volumes standard indicator, calculates the average of Volumes based on the last N bars set by users, and if the value of the volume is bigger then a set % respect the average a different color will be used. The indicator is shown in a separate indicator window. This version has now a limitation in setting the % about the threshold.
If you are interested to set threshold consider to buy the PRO version ( https://www.mql5.com/en/market/product/35925 ) If you want to use
FREE
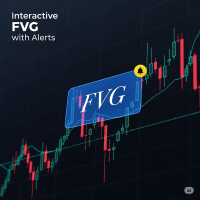
FVG Indicator with Alerts Description: This is a simple and effective indicator for identifying and displaying Fair Value Gaps (FVGs) on any timeframe. The indicator helps you see important price imbalances and provides powerful interactive tools for your analysis. Key Features: Detects FVGs: Clearly identifies and draws boxes around Bullish and Bearish Fair Value Gaps. Midline Level: Displays the 50% equilibrium level inside each FVG box, a critical point of interest. Complete Alert System: Rec
FREE

SuperTrend Indicator – Description & Important Notice The SuperTrend is a composite technical indicator designed to help you identify the primary trend, measure its strength, and assess signal quality. However, an indicator is only a tool —it’s never 100% accurate and cannot replace sound risk management. 1. Core Formula & Components ATR (Average True Range): measures price volatility; customize sensitivity via Periods and Multiplier . Upper/Lower Bands: derived from ATR and your chosen source p
FREE

每位交易者都熟悉这套流程:打开指标参数、改一个数字、点确定、眯着眼盯图、觉得不对、再打开参数。Force Index 只有一个数字要设——周期——但每次想在自己的品种上比较 13、2 还是 100,依然要走一遍这种「改了再猜」的循环。Force Index Live Tuner 让这一切到此为止。 这是一款可以 直接在图表上实时调节 的 Force Index,运行在自己的子窗口中。图表上有一个小面板,带有周期滑块。拖动它,曲线立即重新计算并重绘,全过程就在你眼前。短周期尖峰还是长周期平滑?答案在自己的图表上几秒钟就能得到,不必去翻论坛帖子。 真正的 Force Index,而不是简单封装。 指标按照平台自身的定义做了教科书式的独立实现:tick 成交量乘以收盘价在该周期内简单移动平均值的变化——中间没有内置句柄。你调的就是你看到的。不重绘。 还有实时样式编辑器。 用 16 色调色板和 RGB 滑块调整 Force 线的颜色与粗细。三套内置主题(Night Cyan、Graphite Gold、Clean Light)任选,让面板与你的图表风格一致。 你的设置 按图表分别记忆 ——周期
FREE

Drawdown Floor 让那条看不见的红线变得可见。当账户净值触及一条基准线——它随你的净值峰值移动、每天重置,或固定停留在初始余额下方——你的出资账户或考核账户就会在那一刻爆仓。你的自营交易公司从不为你画出这条线,而它会。 它能显示什么 独立窗口中的净值与基准线实时图表 :将你的交易净值与至多三条基准线(移动式或静态的最大回撤线,以及每日基准线)进行对照。距离最近、你会最先触及的那条约束线以红色高亮标出。 主图上的 品牌信息面板 ,以账户货币和百分比实时显示你距离触线的差距。支持深色或浅色主题,并可针对任意屏幕进行分辨率缩放。 公司预设 ,可为热门项目(FTMO、FundedNext、The5ers、FundingPips、E8、Alpha Capital、FunderPro、FXIFY、MyFundedFX)加载具有代表性的基准线,也可自行设定。 诚实是它的设计原则 只读。 它仅读取你的账户和成交历史,不进行交易,不含 DLL,也从不访问网络。 它只绘制它能证实的内容。 净值历史从你挂载它的那根 K 线起算,绝不伪造回填。 出入金会从净值曲线中剔除 ,因此一笔转账绝不会错误地
FREE
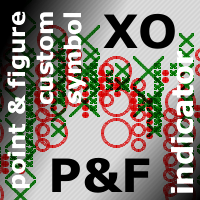
This is a bufferless indicator which can display classical X and O columns if applied on custom symbol charts built by Point-And-Figure-like generator PointFigureKagiCharts or its DEMO . The indicator will enforce a fixed price-scale on the chart to make sure the marks keep correct aspect ratio. The marks are shown only if the chart time-scale is large enough to hold them in the space allocated per bar (if the horizontal scale is one of 3 smallest ones, the indicator draws nothing and outputs a
FREE

该指标是TradingView平台"Duyck"开发的"ATR Based Trendlines - JD"指标的MetaTrader 5移植版本。 本指标通过自动持续绘制趋势线运作,其独特之处在于不仅基于价格,还结合ATR反映的波动率。因此趋势线的角度由ATR(的特定百分比)决定。 趋势线角度会跟随价格变化,这种变化由发现枢轴点时的ATR值决定。ATR百分比参数控制趋势线是跟随ATR变化率(100%),还是其分数(<100%)或倍数(>100%)。 输入参数
回溯深度:设定检测枢轴点时需要检查的K线数量
ATR目标百分比:调整趋势线方向上ATR影响的敏感度
依据影线/实体绘制:选择枢轴点和ATR计算使用K线实体还是影线
选择趋势线方向:看涨/看跌/双向
显示全部趋势线开关
最大趋势线数量(当"显示全部趋势线"关闭时)
上升趋势线颜色设置
下降趋势线颜色设置
接收图表提醒
接收应用通知
交易策略指南:
本交易策略结合了我开发的两个指标来确认交易信号——"RC ATR Based Trendlines"和"RC ATR Volatility Hedge Zones"。核心原则是必须两个指
FREE

Sentimento de Mercado é um indicador que usa os dados do nosso principal indicador: Market Strength Radar.: https://www.mql5.com/pt/market/product/114568?source=Site +Profile+Seller Ele imprime um gráfico de linhas que deve ser comparado com o gráfico de preço para entendermos o sentimento do mercado. As divergencias são pontos importantes de inflexão. As convergências mostram força da tendência atual.
FREE

This MQL5 script is a Dynamic Support & Resistance (S/R) Investigator. It functions as a real-time analytical tool that identifies key price levels and mathematically evaluates their "durability" based on historical interactions. Unlike static indicators, it uses a custom Graphical User Interface (GUI) to provide a live dashboard of market structure. 1. Level Detection Logic The indicator scans the most recent InpPeriod (lookback) of bars to identify the absolute highest peak (Resistance) and t
FREE

Throw VolumeGap Mabrouk Identify Institutional Footprints with Precision Volume Analysis Overview VolumeGap is not just another volume indicator; it is a clinical trading tool designed to detect "Liquidity Surges" and "Institutional Entry Points." By analyzing the relative strength of every tick, this indicator pinpoint the exact moment when high-volume players enter the market, creating high-probability reversal and breakout opportun. LIMITED LAUNCH OFFER Current Price: $35 (Exclusive for the
FREE

The indicator is based on Robert Miner's methodology described in his book "High probability trading strategies" and displays signals along with momentum of 2 timeframes. A Stochastic oscillator is used as a momentum indicator.
The settings speak for themselves period_1 is the current timeframe, 'current' period_2 is indicated - the senior timeframe is 4 or 5 times larger than the current one. For example, if the current one is 5 minutes, then the older one will be 20 minutes The rest of the s
FREE
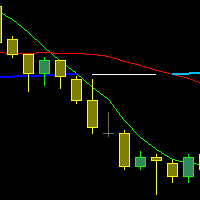
The indicator draws three Moving Averages. Two short ones cross a long one.
At the same time, the long MA changes color: If both short MAs are above the long one - first color; If both short MAs are below the long one - second color; If the two short MAs are on opposite sides of the long one - third color. All three MAs are based on closing prices with a smoothing method of "simple."
cross MA cross 3 MA cross three Moving Average across Moving cross Moving crossing MA crossing MA across MA
FREE

The indicator averages the price using one of four methods: Simple Exponential Linear Weighted Smoothed Tema Dema None Then filters the result through the RSI values.
This results in a line drawn that approximates the trend change in the RSI peak zones. The last three screenshots show two indicators on a single chart with RSI high and low prices and the rest of the default parameters.
The up color (red) for the high prices is set to None, while the down color (blue) for the low prices is set to
FREE

El indicador técnico conocido como Líneas de Tendencia Perfecta . Este indicador es una herramienta valiosa en el análisis técnico y se utiliza para mejorar la toma de decisiones en el trading. Aquí tienes una descripción paso a paso de cómo funciona y cómo puede ser utilizado por los traders: Identificación de Tendencias : Las líneas de tendencia perfecta se dibujan conectando dos o más puntos de precio en un gráfico, revelando así la dirección general del mercado. Una línea ascendente indica
FREE

If you like this product, please give it a 5 star rating as a token of appreciation.
This indicator plots horizontal trend lines at the opening price of each quarter (Q1–Q4) on the chart. These lines visually represent quarterly open levels of the current year, which traders often use as support/resistance or reference points. Automatically plots Q1–Q4 opening levels as trend lines on the chart. Lines are dashed, colored, and labeled. Handles both current and historical quarters. Cleans up line
FREE

A very useful Price Action point is the previous day Closing VWAP. We call it Big Players Last Fight . This indicator will draw a line showing on your chart what was the last VWAP price of the previous trading session. Simple and effective. As an additional bonus, this indicator saves the VWAP value on the Public Terminal Variables, so you EA could read easily its value! Just for the "Prefix + Symbol name" on the variables list and you will see!
SETTINGS How many past days back do you want to s
FREE

Tired of adjusting the indicator settings losing precious time? Tired of the uncertainty regarding their efficiency? Afraid of the uncertainty in their profitability? Then the indicator ACI (automatically calibrateable indicator) is designed exactly for you. Launching it, you can easily solve these three issues just performing the simplest action: clicking a single Calibrate button. To achieve the highest efficiency, you should perform another additional action: move the power slider to the maxi
FREE

Directional Impulse
一个公式。每根K线。瞬间可读。 大多数指标告诉你价格在哪里或移动速度有多快。Directional Impulse 告诉你的是另一回事:这根K线谁赢了,赢了多少。 基于原创公式 — X = (2C − H − L) × (H − L) 与 X = (C − O) × (H − L) — 它将方向性偏差乘以K线的完整波幅,而不是像该谱系中所有先前指标那样将其归一化消除。结果是每根K线的有符号能量度量,同时捕捉了信念与波动性。有符号平方根变换将输出缩放到线性价格单位,使K线的完整分布变得可读,而非被一两个异常走势主导。 Combo 版本同时绘制两层: 中点锚定(宽柱)—— 当内部压力转变时最先翻转。最先发现看涨或看跌K线内部正在形成的拉锯。
开盘锚定(窄柱)—— 仅当K线实体反转时才翻转。确认完全接管。
共识模式 —— 将两个锚定叠加为单柱,在一致时放大,在 contested K线时压缩至接近零。 你以前看不到、现在能看到的: 一根带有长上影线的看涨K线显示为看跌 —— 因为卖方在收盘前将价格推回至波幅中点下方
衰减的脉冲柱(同方向、缩小尺寸
FREE

Short Market Description (recommended) Market Periods Synchronizer highlights higher-timeframe (HTF) sessions directly on your current chart, so you can trade the lower timeframe with full higher-timeframe context. Draws vertical lines for each HTF bar (e.g., H1 on an M5 chart) Optional body fill (green for bullish, red for bearish) for each HTF candle Optional Open/Close markers with labels to spot key reference levels fast Optional minor-timeframe dividers (e.g., M30 & M15) only inside each
FREE

Multi-Symbol Chase Mirror 只读取账户自己已经收盘的成交历史,只数一件事:一共在多少个不同的品种上开过新仓。它不预测,也不给建议。面板上的每一个数字,都是这个账户上已经发生过的事。
数字是怎么算出来的:它读取最多 31 天的已收盘成交,覆盖所有品种、所有魔术号——统计的是整个账户,不是当前图表上的这一个品种。Symbols traded today 统计从服务器时间今天零点以来、有过新开仓的不同品种数;Symbols in last 60min 统计同一件事,只是窗口换成滚动的 60 分钟——这两项无论结果是不是零,都会显示真实数字。从今天往前的 30 天,另外单独算出 30d daily median:这段时间里每天交易品种数的中位数,用中位数而不是平均数,是为了一天异常活跃不会拖动整条基准线。如果这 30 天内新开仓不到 5 笔,历史样本就不够建立一条公平的基准线,这时只有 30d daily median 这一项会显示 "Collecting history",而不是用太少的数据硬凑出一个数字——today 和 last 60 minutes 这两项照样
FREE

FTU 垂直线 此指标会在您选择的时间(分钟或小时)绘制垂直线,以在图表上显示过去和未来的时间。 特点: 多个可调时间 更改线条颜色和数量 用途: 用于研究或衡量特定柱状图收盘价,为未来新闻或小时收盘价等做计划。 在一定范围内更改柱状图颜色和数量。适用于任何时间范围、产品/货币对,无需重绘,快速加载 FTU chuízhí xiàn cǐ zhǐbiāo huì zài nín xuǎnzé de shíjiān (fēnzhōng huò xiǎoshí) huìzhì chuízhí xiàn, yǐ zài túbiǎo shàng xiǎnshì guòqù hé wèilái de shíjiān. Tèdiǎn: Duō gè kě tiáo shíjiān gēnggǎi xiàntiáo yánsè hé shùliàng yòngtú: Yòng yú yánjiū huò héngliáng tèdìng zhùzhuàng tú shōupán jià, wèi wèilái xīnwén huò xiǎoshí shōupán jià děng zuò jìh
FREE

The FXmans Position Calculator is a high-precision trading tool designed for algorithmic risk management. Below is an explanation of its core components and functions in English: 1. Risk Management Engine The indicator calculates your position size based on the specific risk you are willing to take per trade. Risk Mode: You can toggle between Percent (a fixed percentage of your account balance) or Fixed USD (a static dollar amount). R/R Ratio: This determines where your Take Profit (TP) level
FREE
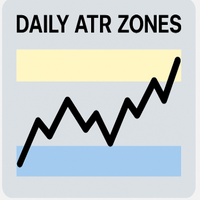
Daily ATR Zones – Precision Intraday Range Mapping Daily ATR Zones is a clear tool that plots intraday high/low targets using the Average True Range (ATR) of the previous days. These zones help traders anticipate potential price extremes , identify liquidity pockets , and define reversal or breakout levels — all based on objective volatility data. Key Features: Flat Zone Logic — Based on Open ± ATR , not bands around price
Custom Zone Thickness — Adjustable via ATR ratio ( ZoneHeightRatio )
FREE
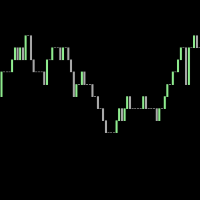
This is a tick indicator which compares the current bid price with the previous bid directly before it, and draws candles based on a comparison of the current ticks. It does not use historical ticks. Everything happens in real time, data moves from right to left, and the newest data arrives at the right. A trend line can be added which points in the direction of the price shifts.
FREE
A simple indicator for calculating risk and automatically calculating the take profit line. In the settings, you enter the desired risk to profit ratio, the indicator will automatically calculate the volume for entry and show where to set the take-profit line to maintain the proportion. The risk is calculated based on your balance data. The information panel can be moved around the screen. The stop-loss line can also be moved, this will recalculate the entry volume and the take-profit position.
FREE

Trend Entropy – Adaptive Chaos & Order Detector
Entropy is the scientific measure of disorder or uncertainty in a system. In physics, it shows how energy disperses and why systems move toward chaos. In information theory, it measures unpredictability in data. Low entropy means order and predictability, while high entropy reflects randomness, complexity, and reduced clarity of outcomes.
Trend Entropy is a next‑generation trading indicator designed for MetaTrader 5. Unlike conventional oscillat
FREE

For those who needs a levels of a first day of a month fully coded with Grok AI Standard settings: * line width * historic Lvl's * Line colors/type *************************************************************************************** Inspired by trader, to use these levels, but i wanted to mark these levels fast and not waste my time on drawing them.
FREE

The MetaTrader 5 Position Indicator is a custom technical tool designed to enhance traders' ability to monitor and manage their positions effectively. It displays key trade details such as stop-loss (SL), take-profit (TP), groups them where they are the same, average buy price, and average sell price directly on the chart. Costs accounted for. Key Features:
Displays TP and SL levels
Groups TP and SL levels where they are the same
Shows average buy and sell price levels Candlestick countdown Pan
FREE

RBM ATR PRO v1.10 Quem opera mercado volátil sabe como é ruim tomar stop por causa de uma violinada de pavio e ver o preço andar forte a favor logo depois. O RBM ATR PRO foi desenvolvido exatamente para resolver isso. Ele evolui o indicador clássico de volatilidade combinando a leitura do ATR com dois níveis independentes de suavização. A linha no gráfico fica limpa e objetiva: verde para estrutura de alta e vermelha quando o mercado vira para a baixa. Funciona perfeitamente para rastrear a ten
FREE

LIMINAL DEE — Dynamic Exhaustion Engine for MetaTrader 5 LIMINAL DEE is a momentum exhaustion indicator that detects when a directional price move is running out of energy — before price confirms the reversal. Rather than using fixed take profits, DEE scores exhaustion in real time on a normalised 0–100 scale and signals the optimal exit window while profit is still at its peak. DEE combines three proprietary sub-measurements: Body Decay Index (BDI) — whether consecutive expansion candles are sh
FREE
AliSession Highlight is an indicator that highlights a specific period of time according to your preferences. It can help you gain a clear vision of price movements into a specific session, the range of a session, and also to easily identify the high and low of the session. You can use it on any currency pairs, indices, and any timeframes. Settings: Start Hour: Set the hour to initiate the session highlight. Start Min: Set the minute for the start of the session highlight. End Hour: Specify the
FREE

Spire - показывает трендовый, сигнальный, свечной прорыв в сторону верхней или нижней границы канала, а так же временную или долгую консолидацию в виде прямоугольного канала. Сигналы тренда не перерисовываются. В основу идеи индикатора входит Bollinger Bands.
Изменяемые параметры Signal trend -изменение цветовой гаммы сигнального символа тренда Lower limit - изменение цветовой гаммы нижней границы канала Upper limit - изменение цветовой гаммы верхней границы канала Internal field -изменение ц
FREE
Esse indicador é a combinação do RSI (IFR) com Média Móvel Simples aplicada o RSI em um único indicador para facilitar a criação de alguma estratégia. Fiz esse indicador para que um único indicador contenha os buffer necessários para implementar alguma EA.
Descrição dos Buffers para o EA,
Buffer 0 -> Valor do RSI Buffer 1 -> Valor da média móvel aplicada ao RSI
FREE
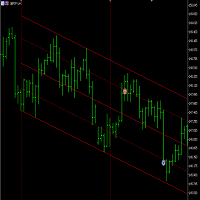
This is a free version of the indicator, the period between the vertical lines is always 30 bars. In the paid version the period can be set by user, so a configuration with many ThreePointsChannel indicators with different periods is possible.
The principle of construction - on top of any number of bars set by the user, a channel is constructed with maximum and minimum lines so that the bars touch the maximum and minimum of the channel at exactly three points. The name of the indicator follows
FREE

Candle Detector By Mahefa R. General Description Candle Detector is an advanced technical indicator for MetaTrader 5 , designed to automatically detect and highlight the most important Japanese candlestick patterns directly on the price chart .
It allows traders to quickly identify market reversal and continuation setups without visual clutter. The indicator recolors only the candles that match the selected pattern , ensuring a clear, accurate, and professional chart analysis . ️ How It Work
FREE

CustomRSI50 - 带50水平的自定义RSI指标 描述 CustomRSI50 是一个基于流行的相对强弱指数 (RSI) 的自定义技术指标。 该指标提供了清晰且可定制的RSI可视化,特别强调50水平,这对于许多交易者在分析市场动量时至关重要。 主要特点 可配置的RSI周期 突出显示的50参考水平 可定制的价格类型 在单独窗口中显示 0到100的固定刻度,便于解释 可定制参数 RSI_Period: 允许设置RSI计算周期(默认:14) applied_price: 允许选择用于计算的价格类型(默认:收盘价) 如何使用CustomRSI50 将指标应用到你的MetaTrader 5图表。 根据个人喜好定制RSI周期和价格类型。 观察RSI相对于50水平的移动: 高于50的值表示看涨动量。 低于50的值表示看跌动量。 信号解释与高周期确认 该指标基于RSI相对于50水平的交叉来生成信号。以下是如何利用它来获得可靠信号: 进场信号: 当RSI在蜡烛收盘时穿越50水平时,可以按1:1.5的风险/回报比进场,并可根据需要延长。 高级别周期确认: 通过观察RSI在更高级别周期上的表现,可
FREE

OVERVIEW Sierra Capital Multi-Timeframe ATR puts the daily Average True Range (ATR) of the chart symbol into a compact panel on your chart. Several ATR periods sit side by side, together with today’s range so far, so you can see at a glance whether today is quiet or active compared with recent days. It is a display tool. It draws nothing on the price chart, gives no signals or alerts, and does not open or manage trades.
WHAT YOU SEE A small panel in a corner of the chart (top right by default)
FREE
Dual Time Frame RSI with Custom Alerts & Visuals Dual Time Frame RSI is an advanced RSI (Relative Strength Index) indicator designed for traders who want to monitor multiple timeframes simultaneously and customize alerts and visuals for better trading decisions. This tool allows you to combine two RSI readings from different timeframes, helping you identify stronger trends and overbought/oversold conditions across multiple time horizons. Key Features: Two Timeframes : The lower timeframe is alwa
FREE
Overview QuantumEdge Oscillator is a professional-grade trading indicator that combines advanced momentum analysis with sophisticated trend detection algorithms. This 30-day trial version provides full access to all features, allowing you to thoroughly test its capabilities in live market conditions before making a purchase decision. Key Features Dual-Signal System : Combines RSI moving average with smoothed ATR-based volatility bands Multi-Timeframe Analysis : Built-in support for higher timefr
FREE

Description The Profit and Loss Indicator by Creative Tech Solutions is a robust and comprehensive tool designed to help traders monitor their trading performance in real-time. This indicator provides detailed metrics on profits and drawdowns, ensuring traders are always informed about their trading activities and performance. With customisable alerts and display settings, this indicator is an essential tool for any serious trader. Features Real-Time Metrics : Monitor profit and drawdown percent
FREE
One of the simplest Pivot Point indicator, easy to operate, and most complete for a single chart in determining Resistance and Support level lines.
In single chart, it will show R&S Level Line with 5 popular types of Pivot Point, Highest&Lowest of closing price Include the Trend and up to 3 Time Frames.
Five types (Floor, Woodie, Camarilla, DeMark, & Fibonacci) of popular Pivot Points in determining Resistance and Support levels. With just using simple button on the
FREE

The Candle Smoother is an indicator for MetaTrader 5 that helps you see price movements more calmly and clearly. It removes unnecessary "market noise" and displays the true trend more effectively.
What does the "Candle Smoother Indicator" do?
It smooths the classic candlestick data (Open, High, Low, Close). This filters out chaotic, hectic candles. Additionally, an EMA line (Exponential Moving Average) is calculated based on the smoothed prices. This helps you better recognize where the market
FREE
学习如何在MetaTrader AppStore上购买EA交易,MetaTrader平台的应用程序商店。
MQL5.community支付系统支持通过PayPay、银行卡和热门付款系统进行交易。为更好的客户体验我们强烈建议您在购买前测试EA交易。
