 MetaTrader 5
 专家
专家
 指标
指标
 程序库
程序库
 实用工具
实用工具
 窗口小部件
窗口小部件
 规则
规则
适用于MetaTrader 5的免费技术指标 - 31
 技术指标的信号外汇和股票市场的开仓交易和平仓交易起着至关重要的作用。指标的本质就是一种交易品种的数学转换,旨在预测未来的价格变化。
测试技术指标可以更有利于预测市场行为并从中获利。
技术指标的信号外汇和股票市场的开仓交易和平仓交易起着至关重要的作用。指标的本质就是一种交易品种的数学转换,旨在预测未来的价格变化。
测试技术指标可以更有利于预测市场行为并从中获利。 
Bollinger bands out/in strategy A strategy created by Joe Ross, and very useful for finding trades when the market is overloaded. Indicator You don't need to find where there are entries on the chart, this indicator shows them for you. The entrance The trade is confirmed when the price closes outside the bollinger bands on a candle and the candle after the price closes inside the bands. comment I want to improve this indicator, so you can help me sending me your reviews and comments, thanks :).
FREE

Quantora Liquidity Zones MT5 is a MetaTrader 5 indicator that displays selected historical price levels and detected Equal High or Equal Low areas on the chart. The indicator plots the previous day, week and month High and Low prices. It also analyzes confirmed price points to identify potential Equal High and Equal Low liquidity zones. Displayed Levels Previous Day High and Low Previous Week High and Low Previous Month High and Low Detected Equal High levels Detected Equal Low levels Optional s
FREE

Overview Anchor VWAP Multi is a professional-grade MetaTrader 5 indicator that solves a common problem for traders who work with Anchored VWAP: the need to see multiple anchored VWAPs simultaneously without opening several chart windows or running multiple indicator instances. You can now plot up to 10 independent Anchored VWAP lines on one chart, each anchored to its own bar, with its own color and — optionally — its own pair of standard-deviation envelopes. Anchors are placed directly on the c
FREE
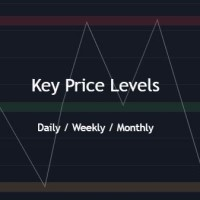
Key Price Levels Indicator Indicator that shows the highs and lows for the significant price levels for past periods that could be potentially considered as reaction levels. The indicator displays the following price levels: Yesterday high and low The day before yesterday high and low Two days back high and low Last week high and low Last month high and low Last three month high and low (Quarter) Last year high and low
FREE
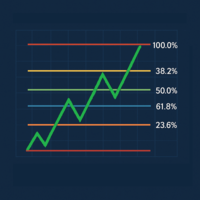
Last Candle Fibonacci is an indicator that makes it easy to see the Fibonacci levels of the previous candle. It can be configured for use on any timeframe, works on major currency pairs, and allows traders to identify reversal zones more clearly. Its design is intended to integrate seamlessly into the chart, highlighting key levels that help confirm pullbacks, potential entries, and targets. It is a lightweight, stable, and practical tool for those seeking a more structured market analysis and t
FREE

Probability emerges to record higher prices when MACD breaks out oscillator historical resistance level. It's strongly encouraged to confirm price breakout with oscillator breakout since they have comparable effects to price breaking support and resistance levels; surely, short trades will have the same perception. As advantage, many times oscillator breakout precedes price breakout as early alert to upcoming event as illustrated by 2nd & 3rd screenshot. Furthermore, divergence is confirmed
FREE

GDS Renko Matrix - Free Multi-Scale Renko Overview Indicator for MetaTrader 5 GDS Renko Matrix is a free multi-scale Renko overview indicator for MetaTrader 5. It helps traders monitor Renko structure, direction and chart context in a compact matrix-style view. The purpose of this tool is to provide a faster visual overview of Renko behavior without turning the chart into a signal system. It does not predict the market and does not generate buy or sell signals. Renko EDGE EA
Golden Delta | Alg
FREE

The WaveTrend Oscillator indicator is an enhanced version of the classic WaveTrend Oscillator, a momentum indicator. It is designed to identify overbought/oversold conditions and provide potential trend reversal signals. The core difference in this version is the application of a data "normalization" algorithm. This ensures the indicator's oscillation lines remain balanced around the zero line, causing the indicator window to always stay naturally centered. This is especially useful when trading
FREE

Volume Profile Indicator – User Guide Description: The Volume Profile Indicator is a powerful tool designed for MetaTrader 5. It visualizes market activity using volume distribution across price levels, showing: Histogram of volume at each price bin POC (Point of Control) – the price with the highest traded volume Value Area – the range covering a configurable percentage of volume (e.g. 70%) Support levels: Min, Max, and Pivot Average tick size for BUY and SELL movements Inputs and Parameters:
FREE

账户盈亏统计看板(Account PnL Board)是一个 MetaTrader 5 指标,把账户的成交历史整理成一份可读的绩效报表,直接绘制在图表上。
它不只是一个余额数字:按日 / 周 / 月 / 年逐行列出已实现盈亏、盈亏百分比、手数、成交笔数与期末余额,并单独给出浮动盈亏的多空拆分、出入金流水以及完整的平仓交易清单。
整个产品只有一个指标文件,不含动态库、不访问外部服务、不占用指标子窗口,也不产生绘图缓冲区,因此不会影响图表的数据窗口与模板。
周期明细表 - 按日 / 周 / 月 / 年汇总,周以周一为起点 - 已实现盈亏 = DEAL_PROFIT + DEAL_SWAP + DEAL_COMMISSION,仅统计 BUY / SELL 成交 - 盈亏百分比以该周期期初余额为基准 - 当期平仓手数、平仓成交笔数、期末余额 - 全部周期的合计行,以及置顶显示的当前周期行
浮动风险 - 浮盈 / 浮亏分别列出数值与占余额的百分比 - 可选择是否计入持仓已付的开仓手续费
图表 - 余额曲线支持折线图与按周期的柱状图 - 自动选择图形(日为折线,其余周期为柱状),也可按标
FREE

# Account Statistics Pro — 产品描述(中文)
**Account Statistics Pro(账户统计专家)** 是 MetaTrader 5 的多品种账户分析仪表盘指标。它读取您的交易历史,将其转化为一套完整的、机构级的绩效与风险报告,并以快速、完全不透明、可拖拽的面板直接呈现在图表上。
一眼即可看清钱从哪里赚、在哪里亏:按品种、按 EA 魔术号、按小时、按星期、按月份——以及您的真实风险究竟有多深。
---
## 核心亮点
- **绩效核心(CORE)**——余额/净值、净盈亏、盈亏比、胜率、期望值、平均盈亏、盈亏系数、连赢连亏、多空拆分,以及近期日/周/月窗口。 - **排名页(RANK)**——所有品种与所有魔术号策略按净利、胜率、风险调整收益排名,附迷你走势图与单策略详情。 - **时段分析(PERIOD)**——日/周/月盈亏,小时与星期分布,24×7 小时×星期热力图,月度收益热力图,季节性与季度显著性检验。 - **风险实验室(RISK)**——回撤深度/持续/修复,保证金与敞口,账户负载,连续亏损风险,隔夜风险,仓位 sizin
FREE

MA HTF PO3 Fib Timer V1.20 helps traders keep higher-timeframe structure visible directly on the current chart without switching between timeframes. This indicator combines higher-timeframe candle visualization, moving averages, live timing, and key price references in one clean workspace for faster chart reading and better execution focus. Main features: - Higher-timeframe candle overlay on the active chart - Up to 3 moving averages - Candle countdown timer - Live HTF high and low levels - Hist
FREE

AdnanEdge is a technical signal indicator for MetaTrader 5. It analyzes market conditions using five independent strategies and displays BUY or SELL arrows on the chart when a valid signal appears. The indicator is read-only and does not place trades. The built-in dashboard shows the current signal direction, strategy name, quality score, market regime, and relative volume. An adaptive mode automatically selects the best strategy for current conditions. Key Features Five signal strategies: MA C
FREE

Detection modes Confirmed (default): It classifies the last closed D1 candle against the one before it and alerts once when the new day opens. This is the reliable mode, because a sweep-and-reject or an outside bar isn't final until the close. Live: It classifies today's developing candle against yesterday's and alerts the first time each state appears that day. Live states can change before the close. Inside bar is not alerted in live mode, since it's the starting state every day. Inputs A sepa
FREE

Sierra Capital Session Sweep Scanner maps out the Asian, London, and New York trading sessions directly on your chart, then watches for a specific price-action pattern: a candle that spikes through the Asian session's high or low and closes back inside it — a classic liquidity sweep. What it shows: Colour-coded boxes marking the Asian, London, and NY session ranges, with the Asian high/low projected forward as reference lines Arrows marking each qualifying sweep-and-reject candle, with projected
FREE
Quant Levels Indicator is a premium component of the Quantitative Trading Analysis Toolkit , designed to transform subjective trading into data-driven decision making. This advanced tool provides institutional-grade support and resistance analysis directly on your MT5 charts. " Please support our work by leaving a review ". As a thank-you gift , we’ll share a special template that helps you display signal trade history directly on your chart. Free indicator to visualize any MT5/MT4 signals i
FREE

Impulse System MTF 按照 Alexander Elder 描述的 Impulse System 为图表上的K线着色,并且可以取用更高周期的着色结果,而不局限于你正在看的这个周期。Impulse System 结合了一个趋势度量和一个动量度量:收盘价的指数移动平均线,以及 MACD 的柱状图。两者同时上升时K线为绿色,两者同时下降时为红色,两者不一致时为蓝色。
这三种状态的用处,在于 Elder 赋予它们的职责。Impulse System 是一个否决系统,而不是信号发生器。绿色不代表买入,它代表在多头同时掌握趋势和动量期间禁止做空。红色不代表卖出,它代表禁止做多。蓝色代表任何一方都没有控制权、两个方向都被允许,而这在实际盘面上正是趋势结束和开始的位置。按这种方式理解,这套着色是一层叠加在你现有入场方法之上的过滤器,而不是对它的替代。
本指标有两种运行模式,并根据你选择的周期自动切换。当所选周期与图表周期相同时,它就地为图表本身的K线重新着色。当你选择更高的周期时,它会把那个周期的K线作为叠加层画在当前图表上,因此你在五分钟或十五分钟图上操作时,日线或四小时的结构
FREE

News Radar Pro transforms MT5’s built-in economic calendar into a live, on-chart trading tool. View upcoming macroeconomic events directly on your chart with impact-based filtering, countdown timers, and intelligent alerts, all in your chosen timezone. No external websites, APIs, or data feeds required. How It Works Economic Calendar Integration
Access MT5’s global economic events database directly on your chart. Event Filtering
Filter economic events by impact level (High, Medium, Low) and cu
FREE

Fractals Alligator Filter is an indicator for MetaTrader 5 that detects fractals and filters them according to their position relative to the Alligator lines. There is also the HotkeyFractalsEA utility designed to simplify trading.
The indicator automatically separates fractals into valid and invalid fractals: valid fractals are displayed with colored arrows; invalid fractals can be displayed separately or hidden in the settings. Two filtering modes are available: filtering relative to the Tee
FREE

O RBM Volume Real foi desenvolvido para transformar volume em informação útil para tomada de decisão. Em vez de observar apenas a movimentação do preço, o indicador permite identificar quem está dominando o mercado em determinado momento: compradores ou vendedores.
O primeiro dado apresentado é o volume de Compras, que representa a agressão dos participantes que aceitaram pagar o preço pedido para entrar no mercado. Já o volume de Vendas mostra a agressão daqueles que aceitaram vender ao preço
FREE

Pro Candles — Identificação visual de candles de reversão O Pro Candles é um indicador desenvolvido para destacar possíveis candles de reversão diretamente no gráfico do MetaTrader 5. Ele analisa o tamanho do corpo dos candles, compara esse movimento com a média recente e procura formações direcionais de engolfo. Quando encontra uma configuração compatível com seus critérios, o indicador exibe uma seta próxima ao candle analisado. Principais recursos Identificação visual de possíveis reversões d
FREE

Read This : Please provide comments and reviews for future improvements. WaveTrendPro_Indi v1.05
WaveTrend indicator with enhanced histogram visualization : Histogram is now scaled higher (adjustable via HistScale ). Different colors for positive & negative bars, making trend direction clearer.
Lightweight & responsive across pairs and timeframes. Perfect for scalpers, swing traders, and trend-following strategies.
WaveTrendPro_Indi v1.05
Indikator WaveTrend dengan tampilan histogram yang le
FREE

Supply & Demand Zones with Smart Filters (MQL5) This indicator detects high-probability supply and demand zones using a multi-step Smart Money Concept (SMC) approach, specifically optimized for the MetaTrader 5 platform. Core Logic Liquidity Sweep Detection: Identifies when price sweeps above a pivot high (supply setup) or below a pivot low (demand setup), capturing liquidity grabs by institutional traders. Displacement Confirmation: Requires a strong displacement candle (measured by ATR a
FREE
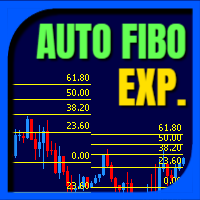
Auto Fibo Expansion is an indicator that projects the Fibonacci expansion levels above and below the opening price of the day. It does the calculation based on the previous day and projects the levels on the current day. It is very efficient to find "psychological" zones of support and resistance. Its appearance is all configurable and you can set up to 30 different levels. Enjoy! This is a free indicator, but it took hours to develop. If you want to pay me a coffee, I appreciate a lot <3 PayP
FREE
If you love this indicator, please leave a positive rating and comment, it will be a source of motivation to help me create more products <3 Key Takeaways StochRSI is an oscillator that measures the RSI level relative to its high-low range over a period of time. It is more sensitive than the traditional RSI and can highlight overbought or oversold conditions in the market. StochRSI is typically used to generate more frequent and timely trading signals compared with the traditional RSI. StochRSI
FREE

大多数零售账户爆仓不是因为入场不好,而是因为手数过大、在震荡中交易以及被忽视的风险。 Risk & Regime Cockpit 把真正保护账户的三件事放进一个始终显示、可自由拖动的面板。无需心算,没有术语,也没有让你盲目跟随的信号。 1. 基于风险的仓位——替你算好。 用百分比设定风险、用 ATR 设定止损;面板即时显示当前品种的精确手数、多空双向的止损和止盈。当手数符合目标风险时变绿;当经纪商的最小手数把风险推高到目标之上时以橙色警告。 2. 用大白话说明市场状态。 基于 ADX,标题栏用清晰语言告诉你当前周期是上涨、下跌还是横盘,以及趋势有多强——无需解读原始数值。 3. 多周期一致性。 M5、M15、M30、H1、H4 和 D1,每个都带彩色箭头,再加一行诚实的总结:全部周期向上、大多向下(4/6)、大多横盘或混合。 4. 实时账户风险守卫。 未平仓头寸、由止损定义的总风险(占账户%)、浮动盈亏,以及大多数工具忽略的两个硬性警告:没有止损的头寸(无限风险,红色显示)以及超过你上限的总风险。 5. 可选的一致性提醒(默认关闭)。 仅当高周期趋势进入一致时才触发提醒。可选终端弹窗、
FREE

Transparent Renko Overlay Indicator Overview Transparent Renko Overlay Indicator displays Renko bricks directly on the main price chart as a semi-transparent overlay.
Unlike traditional Renko charts that require a separate offline window, this indicator allows traders to view standard candlestick price action and Renko structure simultaneously on the same chart. The overlay helps identify trend direction, price noise, and consolidation phases without losing time-based market context. Key Feature
FREE
If you love this indicator, please leave a positive rating and comment, it will be a source of motivation to help me create more products <3 Key Takeaways The Laguerre RSI is an enhanced version of the traditional Relative Strength Index (RSI) that incorporates Laguerre filters to smooth the price data. This helps reduce the noise and volatility that are often seen in the standard RSI, providing a cleaner and more reliable indicator for spotting trends, reversals, and overbought or oversold con
FREE
Introduction
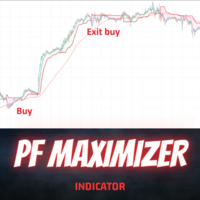
The PF Maximizer is a game-changing non-repainting technical tool engineered to help traders distinguish genuine trend signals from erratic market fluctuations. By employing sophisticated algorithms and cutting-edge data analysis, this indicator efficiently filters out unwanted noise, empowering traders to identify the precise starting and ending points of substantial market moves.
Signal
Potential buy signal is generated when moving average is going up and the blue line cross a
FREE

Demand and supply zones Support and Resistance areas Show broken zones Show tested and untested zones Show weak zones Fractal factors Notifications when price reaches point of Interest with Push notifications and pop ups Customizable History Clickable Works on all Timeframes Works on all pairs.
Free for a while till further notice and changes. The demand and supply bot coming soon
FREE
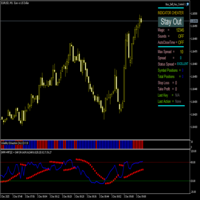
WPR+MFI 与抛物线SAR融合指标 描述:
该指标将两个振荡器(威廉姆斯百分比范围和资金流量指数)与抛物线SAR趋势指标结合在一个窗口中。WPR和MFI值被平均化,并基于所得线构建抛物线SAR。 工作原理: Avg(WPR,MFI) 线 - WPR(转换为0-100范围)和MFI的平均值 抛物线SAR点 - 基于Avg(WPR,MFI)线的值构建 信号: 水平位交叉: 线从下向上穿过20 → 潜在的买入信号 线从上向下穿过80 → 潜在的卖出信号 SAR位置: SAR点位于线下方 → 上升趋势 SAR点位于线上方 → 下降趋势 组合分析: 买入:线高于20且SAR低于线 卖出:线低于80且SAR高于线 设置参数: InpWPRPeriod - WPR周期(默认:14) InpMFIPeriod - MFI周期(默认:14) InpMFIVolume - MFI使用的成交量类型(默认:VOLUME_TICK) InpSARStep - SAR递增步长(默认:0.02) InpSARMax - SAR最大步长(默认:0.2) 技术规格: 使用7个计算缓冲区
FREE

Correlation Matrix Pro - 多货币相关性分析 实时了解货币对之间的相关性! 一款强大的分析工具,可帮助您同时可视化多达6个货币对之间的统计关系。非常适合投资组合管理、风险分散和对冲策略。 主要功能 - 使用对数收益率的实时皮尔逊相关性 - 同时监控多达6个货币对 - 自动时间框架检测 - 可调回溯周期(5-200根K线) - 自动对冲机会检测 - 简约可折叠面板设计 - 颜色编码矩阵,即时解读 颜色编码 绿色 (+0.70 至 +1.00) = 强正相关 浅绿色 (+0.50 至 +0.69) = 中等正相关 灰色 (-0.49 至 +0.49) = 弱/无相关 橙色 (-0.50 至 -0.69) = 中等负相关 红色 (-0.70 至 -1.00) = 强负相关(对冲) 为什么要关注相关性? 风险管理 避免通过高度相关的头寸使风险加倍。 对冲策略 自动找到具有强负相关性的货币对进行有效对冲。 投资组合多元化 使用低相关性货币对构建多元化投资组合。 相关性突破 检测背离——通常是即将到来的市场变动信号。 输入参数 显示设置: - 面板 X/Y 位置 - 启动时
FREE

Добро пожаловать в новую эпоху торговли с индикатором AI Moving Average, передовым индикатором MetaTrader 5, разработанным для предоставления трейдерам предсказательной информации о движениях рынка. Этот инструмент сочетает в себе мощь ИИ с надежностью экспоненциального скользящего среднего без запаздывания для точных и своевременных прогнозов будущих ценовых тенденций. Инновационная модель линейной регрессии Индикатор AI Moving Average использует модель машинного обучения линейной регрессии для
FREE
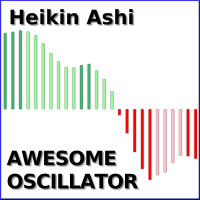
This is the Bill Williams Awesome Oscillator indicator calculated from Heikin Ashi candles. Here you find multi-colored histogram which is helpful when identify weakness or strength of trend in the market. To use it, just simply drop it on the chart and you don't need to change parameters except one: switch between Heikin Ashi or normal candles (see attached picture).
FREE

The Jackson Auto Candlestick Pattern . It a powerful price action tool which auto detect and alert a hided powerful candlestick patterns . It came with few different chart skins. You can use this indicator alone to make profit, but it powerful when you combine it with trendlines, You can download The Jackson Auto Trendlines for free Link : UCRW695l9Wgg2ucnnf5DL5Vw List of Candlestick Pattern it detect 1. Bullish & Bearish Engulfing's 2. Top and Bottom Tweezer 3. Bullish and Bearish Harams 4.
FREE
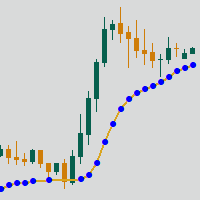
Adaptive Moving Average (AMA) is a trend indicator using moving average and market noise filter. Indicator feature are blue and red points, showing the power of trend. Recommendations for trading: Auxiliary Indicator Detecting trend Detecting power of trend Detecting potential reversal points Main indicator Shows entry points for swing trading Serves as dynamic support and resistance Recommendations for use: Any instrument Any timeframe Input parameters: Period - AMA period Fast Period - fast MA
FREE

RBM Volume Ultimate RBM Volume Ultimate is an indicator for MetaTrader 5 that combines buyer and seller financial volume, cumulative delta, daily VWAP and automatic detection of absorption and exhaustion in a single panel. The purpose of the indicator is to give traders a clearer view of buying and selling flow in real time. The histogram separates financial volume between buyers and sellers on a bar by bar basis, making it easier to identify moments when pressure shifts from one side of the ma
FREE

El **Heiken Ashi Smoothed** es una versión suavizada del indicador técnico Heiken Ashi, que se utiliza en el análisis de gráficos de velas para identificar tendencias del mercado y pronosticar movimientos de precios. Este indicador se basa en el promedio de datos de precios para formar un gráfico de velas que ayuda a los traders a filtrar el ruido del mercado.
**¿Para qué sirve?** Este indicador se utiliza para identificar cuándo los traders deben permanecer en una operación y cuándo está por
FREE

LZ Multi-Timeframe Candle Timer displays the remaining time before the current bar closes for multiple timeframes simultaneously on a single dashboard. Monitor up to 9 timeframes (M1, M5, M15, M30, H1, H4, D1, W1, MN1) without switching charts. The indicator uses server time, updates every second, and is optimized for smooth display with minimal CPU use.
Feature highlights
- Multi-timeframe display: select which timeframes to show (M1 through MN1) via boolean inputs. Display only the interval
FREE

Four pivot methods, three reference periods and labels that stay where you place them. BrioQuant Pivot Points plots Classic, Fibonacci, Camarilla or Woodie levels from the previous completed period. Choose Daily, Weekly or Monthly pivots, then place labels at the period start, after the newest candle, in the margin or at the chart edge. Features: Methods: Classic / Fibonacci / Camarilla / Woodie; periods: Daily / Weekly / Monthly Label placement: line start, after the newest candle, centred in t
FREE

Volatility Break Signals Description:
The Volatility Break Signals is an indicator designed to detect potential trend changes while partially filtering market noise. It uses an adaptive volatility measure based on the selected price (Close, Open, High, Low, etc.) and generates Buy and Sell signals when the price shows a reversal relative to the previous direction. How it works: Price Volatility Measurement The indicator calculates the absolute price changes from bar to bar ( |price - previous
FREE

SMC Donchian Fusion ZigZag This indicator for MetaTrader 5 provides a comprehensive multi-timeframe trend analysis by fusing signals from the ZigZag indicator across three different timeframes (Entry, H1, and H4). It is designed to give you a clear and immediate understanding of trend alignment and potential entry points. Key Features: Multi-Timeframe Analysis: Combines ZigZag data from three user-defined timeframes (defaulting to M15, H1, and H4) to create a powerful, unified trend signal. Nor
FREE

1. Introduction The Market Squeeze Momentum Indicator (SQZMOM_LB) is a powerful technical analysis tool designed to help traders identify periods of low market volatility (the "squeeze" phase) and predict the direction and strength of price momentum after the squeeze ends. This indicator combines the principles of Bollinger Bands and Keltner Channels to detect changes in market volatility, along with a momentum oscillator to measure buying/selling pressure. 2. Key Components of the Indicator The
FREE

Technical Analysis Dashboard Pro (TADashboard Pro) – 统一技术分析系统 TADashboard Pro 是一个先进的技术分析面板,将多个指标和时间周期整合到一个统一的视觉界面中。该系统专为追求 精确性与高效率 的交易者设计,能同时分析 7 个震荡指标和 4 个移动平均线 ,涵盖 8 个不同时间周期 ,生成标准化评分,从而简化决策过程。 主要特点 (Key Features): 多时间周期分析 (Multi-Timeframe Analysis): 通过集成的可视化选择器,轻松监控 M1、M5、M15、M30、H1、H4、D1 和 W1 周期。 高级评分系统 (Advanced Scoring System): 震荡指标、移动平均线和综合评估的独立评分( $-100$ 至 $+100$ )。 包含的指标 (Included Indicators): RSI、MACD、Stochastic、CCI、ADX、Williams %R、Momentum、EMA 10/20/50、SMA 200。 分析表格 (Analysis Tables):
FREE

THE ADVANCE PRICE PREDICTOR - GURU EDITION Tired of Guesswork?
Meet the AI-Powered "Almighty Predictor" – Pinpoints High-Probability Targets Before the Move, With Surgical Precision
Stop chasing pips. Start attracting them. Our proprietary algorithm fuses Multi-Timeframe Analysis + Smart Money Concepts + Real-Time Confluence Scoring to give you a clear, calculated edge on every trade.
Are You Constantly Wondering…
"Is this the top, or will it keep going?"
"Where should I real
FREE

A pin bar pattern consists of one price bar, typically a candlestick price bar, which represents a sharp reversal and rejection of price. The pin bar reversal as it is sometimes called, is defined by a long tail, the tail is also referred to as a “shadow” or “wick”. The area between the open and close of the pin bar is called its “real body”, and pin bars generally have small real bodies in comparison to their long tails.
The tail of the pin bar shows the area of price that was rejected, and t
FREE

Structure & Volatility-Based Precision Execution Signal Indicator B2U Market State System Part of the B2U Market State System B2U EX is a professional indicator designed to analyze market structure, trend state, and volatility in an integrated and objective way. 시장 구조 , 추세 상태 , 모멘텀을 입체적으로 분석하기 위한 전문 인디케이터 시스템입니다 . 이 인디케이터는 무작위 신호 생성이 아닌 , 시장 구조 · 변동성 · 추세 방향이 동시에 정렬된 구간에서만 실행 신호를 제공합니다. 추세상태 분석을 위한 B2U Ultimate HARSI 또는 모멘텀 상태 판단을 위한 B2U Ultimate Percent R Edition 과 함께 사용하면 시장 구조와 상태를 보다 입체적
FREE
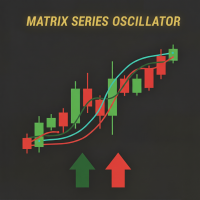
Matrix Series – 支撑、阻力及动量指标 在一个指标中显示关键支撑/阻力区域、超买/超卖水平以及市场强度。 Matrix Series 结合了 动态CCI 、平滑移动平均和标准差通道,为市场方向和关键水平提供清晰视图。蜡烛根据多空压力着色,并显示动态支撑/阻力区及超买/超卖可视化警报。 主要特征 趋势蜡烛颜色: 绿色=多头, 红色=空头 支撑与阻力区域: 根据可配置CCI周期动态计算 超买/超卖指标: 可视化警报提示极端状态 易于理解: 蜡烛方向与区域交互显示市场强度 完全可配置: 周期、平滑、OB/OS水平及区域显示 使用方法 趋势识别: 绿色蜡烛 → 多头; 红色蜡烛 → 空头 支撑/阻力交易: 观察价格与动态区域的交互以进行入场和出场 OB/OS确认: 信号穿越OB/OS水平增强交易决策 实际示例 绿色蜡烛,CCI高于阻力 → 强劲上升趋势,可能继续 红色蜡烛,CCI接近支撑 → 下跌趋势,可能出现新低 可视化OB/OS警报 → 显示潜在趋势反转 竞争优势 将多个工具整合到一个指标中:趋势蜡烛、CCI、支撑/阻力及OB/OS警报 在图表显示之前捕捉市场强度变化 过滤噪
FREE
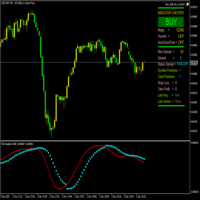
ParabolicSariTriX 是一种混合指标,它结合了趋势振荡器 TriX(三重指数移动平均线)和抛物线转向系统(Parabolic SAR)。该指标显示在独立窗口中,旨在根据趋势反转信号识别入场/出场点。它通过 SAR 点的形式提供清晰的视觉信号,这些点会随着市场趋势的变化而改变相对于 TriX 线的位置。 SAR 点的位置如下: 在 TriX 线上方 表示看跌趋势(卖出信号) 在 TriX 线下方 表示看涨趋势(买入信号) 需要注意的是,由于该指标基于 TriX 值而非实际价格计算, 因此不能用作价格仓位的追踪止损 。其主要用途是发出 TriX 振荡器的趋势反转信号,结合其他分析工具时可作为交易决策的过滤器。 该指标在趋势明显的市场中表现最佳,而在盘整行情中可能出现虚假信号。它适用于各种时间周期和金融工具,包括外汇、股票和大宗商品。建议交易者将其与价格行为分析、支撑阻力位或其他振荡器结合使用,以提高信号可靠性。
FREE

具有多时间框架支持、可自定义视觉信号和可配置警报系统的平均真实波幅(ATR)指标。
免费编程服务、更新及其他 TrueTL 产品请访问 MQL5 个人主页 。
非常感谢您的反馈和评价!
什么是 ATR? 平均真实波幅(ATR)由 J. Welles Wilder 开发,是一种用于衡量市场波动性的技术指标。它计算指定周期内真实波幅(True Range)的平均值。真实波幅是以下三个值中的最大值:当前最高价与当前最低价之间的距离、前一收盘价与当前最高价之间的距离,或前一收盘价与当前最低价之间的距离。 ATR 不显示价格方向 — 它仅衡量波动性。ATR 上升表示波动性增加,ATR 下降则表示波动性减少。交易者使用 ATR 来评估市场状况、设置动态止损(例如基于 ATR 的追踪止损)、确定仓位大小以及识别潜在的突破行情。ATR 值偏高通常出现在快速波动或新闻驱动的市场中,而 ATR 值偏低则表明市场处于平静的整理阶段。 功能特点: 带箭头标记和垂直线的视觉信号标记 具有可配置触发条件的三个独立信号缓冲区 信号检测选项:方向变化、峰值/谷值 每个信号可配置警报功能(邮件、推送、声音、弹窗)
FREE

TCM Breakeven Calculator Ultra is a professional utility designed to instantly visualize your True Weighted Average Entry Price with the Total Lot Size . Unlike simple averages, this tool mathematically accounts for Lot Sizes , giving you the exact price where your net position reaches zero loss. It automatically scans your terminal and isolates trades based on the chart you are viewing. If you are trading multiple pairs (e.g., EURUSD and Gold) simultaneously, this indicator will onl
FREE

Pivot Points Indicator – a fast, reliable, and fully customizable pivot detection for MetaTrader 5. This indicator uses MetaTrader’s native iHighest and iLowest functions to identify pivot highs and lows by scanning for the highest and lowest prices within a user-defined window of bars. A pivot is confirmed only when the current bar is the absolute maximum or minimum within the selected range, ensuring accurate and timely signals based on robust built-in logic.
Key Features No Repainting : Onc
FREE

The CSI Currency Strength indicator ranks all ten G10 currencies by momentum strength using a multi-lookback Z-score model, displayed as a live on-chart panel. Attached to any chart, it runs independently of the chart's symbol or timeframe. The methodology follows the multi-horizon momentum framework from Asness, Moskowitz & Pedersen (2013), applied cross-sectionally to G10 currencies. Rather than comparing a single bar against the previous close — which introduces a cliff-edge artifact at each
FREE

RITZ SMART TREND ADAPTIVE FINDER Precision Trend Intelligence. Adaptive. Insightful. Real-Time. Ritz Smart Trend Adaptive Finder is an advanced market intelligence indicator engineered to detect and adapt to evolving market structures with dynamic precision.
It automatically calibrates its analytical period based on real-time volatility, price momentum, and correlation strength — delivering true adaptive trend detection rather than static or lagging signals. By combining Pearson correlation , sl
FREE
Smart Grid MT5 automatically recognizes any symbol, period and scale of the chart and marks it up accordingly. It is possible to mark up the chart by trading sessions. The grid consists of the two main line types.
Vertical lines There are two visualization methods: Standard - the lines are divided into three types, separating: Small time period. Medium time period. Large time period. Trading Session - the lines are divided into groups (a total of ten). Each group has two lines: the first is res
FREE

APICT Smart Trendline and Pattern Tool APICT Trendline + Pattern Indicator is a powerful all-in-one technical analysis tool designed to automatically identify market structure, draw dynamic support and resistance trendlines, and detect high-probability chart patterns in real time. Smart Trendline Detection The indicator automatically draws major and minor trendlines , clearly marking key support and resistance levels based on market structure. Separate controls for major and minor trends Adju
FREE

Opening Range Boxes Multi-Session Indicator Advanced multi-session opening range breakout indicator with automatic timezone detection, dynamic TP/SL projections, and real-time breakout alerts. Supports up to 5 configurable sessions for Forex, Gold, Silver, and Crypto instruments. Full Description: Opening Range Boxes Multi-Session Indicator is a comprehensive visual trading tool designed for traders who implement the Opening Range Breakout (ORB) strategy. This indicator automatically identifi
FREE

AZ session scalper
A small but useful session indicator, designed primarily for scalping. Enable the session you plan to trade, watch the reaction of the M5/M15 candlesticks to the level of the previous trading session, and enter. We always look at the reaction of the current session to the previous one. For example, if you trade the Americas, enable the European session, and watch how one session takes away liquidity from another. Important: adjust the time to your broker's time zone in the i
FREE

这是一个正在积极维护的版本,已针对当前的MT5版本进行了重新编译和功能扩展。
手动扫描每一根K线以寻找可识别的反转或延续形态非常耗时,而且很容易遗漏,尤其是在跨多个图表或时间周期时。
Phoenix K线形态监测器可在形态形成时自动检测 18 种标准 K线形态,在图表上进行标记,并实时统计数量,以便您查看该交易品种实际产生了哪些形态。
它如何为您捕捉形态
- 检测三大类共18种形态:单根K线形态(锤头、吊颈、流星、倒锤头及四种十字星变体)、两根K线形态(看涨/看跌吞没、穿刺线、乌云盖顶、看涨/看跌孕线、镊子顶/底)以及三根K线形态(晨星、暮星) - 图表上会显示箭头标记每个检测到的形态 - 实时更新的“形态历史”面板,显示各形态的出现次数 - “仅显示已确认形态”过滤器,可排除当前K线仍在形成中的形态
警报
检测到形态时可配置警报,支持声音和推送通知选项。
使用 Phoenix K线形态监测器可: - 在反转形态确认的瞬间捕捉到它,无需盯着每根K线看 - 查看特定交易品种上实际出现频率最高的形态 - 过滤掉未确认、仍在形成中的形态,以减少噪音
使用方法
1. 将其附
FREE
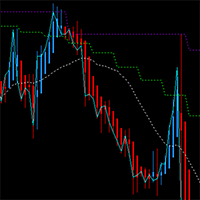
This MT5 chart trend checker cuts through the noise of market volatility to provide a clearer picture of trends and price movements. It includes the following features that can provide more clarity during market assessments: 1 customizable multi-period moving average Optional Heikin-Ashi candles 3 switchable focus modes Distinct colors for easy analysis
Link to MT4 version: https://www.mql5.com/en/market/product/106708/
This indicator shows your preferred moving average from multiple time fram
FREE

The FVG Toolkit is a lightweight Smart Money Concepts (SMC) indicator that automatically identifies and draws Fair Value Gaps (FVG) on your chart . It scans for the classic 3-candle imbalance patterns (BISI & SIBI) to highlight high-probability liquidity zones for your entries . Key Features Dynamic Zones: The FVG boxes extend to the right and automatically freeze when the gap is fully filled by the price . Auto-Cleanup: Option to automatically delete boxes once they are fully mitigated to keep
FREE

HTF Candle Plus — Higher Timeframe Candles on Chart Background HTF Candle Plus is an advanced visualization indicator for MetaTrader 5 that overlays higher timeframe candles directly onto the background of the active chart. With up to 19 independently configurable timeframe slots, an interactive button panel, and native support for 24/7 markets and session-aware candle clipping in the style of TradingView, this indicator transforms any chart into a complete multi-timeframe analysis environment.
FREE

EMA Tracker – Simple EMA with Arrow Signals One Chart. One EMA. Clear Signals. EMA Tracker gives you everything you need for single-chart EMA trading – clean visualisation, dynamic colour coding, and automatic reversal arrows. Perfect for traders who want simplicity without complexity. What It Does Main Chart: EMA line with dynamic colour (Blue = rising, Orange = falling) Buy/Sell arrows when EMA changes direction Signal Buffers (EA-Ready): Buffer 0: EMA values Buffer 1: Direction state (0 =
FREE

简介 这是一款结合了经典震荡指标 Williams %R 与 Bollinger Bands (布林带) 的复合型技术指标。它不同于传统直接基于价格的布林带,而是通过对 Williams %R 进行平滑处理后再进行标准差计算。 这种创新的组合能够有效捕捉动量爆发的瞬间,并利用布林带的动态特性来过滤普通震荡信号。当平滑后的 WPR 突破布林带上下轨时,通常预示着一个强力波段行情的开启。
核心功能与优势 双重过滤机制: 指标首先对原始 Williams %R 进行平滑处理(参数可调),有效减少了传统 WPR 常见的锯齿状噪点。 动态动量阈值: 与固定在 -20/-80 的静态超买超卖线不同,本指标引入了布林带作为动态边界,能够根据市场近期波动率自动调整信号触发点。
直观的视觉信号: 颜色变换: 指标线会根据其与布林带的位置关系自动变换颜色(突破上轨为绿,跌破下轨为红,震荡为灰)。 箭头提示: 当发生“穿透性”突破时,系统会在副图自动标注 L (Long) 或 S (Short) 信号。 高度可定制化: 用户可以自由调整 WPR 周期、平滑周期以及布林带的标准差倍数,以适应从 sc
FREE

RBM Nasdaq Liquidity Hunter
Institutional Liquidity Indicator for Nasdaq
RBM Nasdaq Liquidity Hunter is an advanced liquidity analysis tool developed for Nasdaq traders who want to identify institutional liquidity events with greater precision.
Instead of highlighting every breakout, the indicator filters market noise and identifies only liquidity sweeps confirmed by volume, trend, and multiple institutional confluence factors. Every detected event is evaluated through a proprietary scoring
FREE

CandleForce Pro: The Ultimate Decision-Support Dashboard for Modern Traders Introduction: Overcoming the Chaos of Modern Markets
In today's hyper-connected financial markets, the modern trader faces a paradox of choice. We are inundated with an endless stream of data, indicators, news, and strategies, all promising to unlock the secrets of profitable trading. This constant influx often leads to "analysis paralysis"—a state of cognitive overload where conflicting signals create confusion, hesit
FREE

Swing BOS Structure is a market structure indicator for MetaTrader 5.
The indicator automatically detects: • Swing High (SH) • Swing Low (SL) • Break of Structure (BOS) • Change of Character (CHoCH)
Swings are confirmed only after a defined number of candles, ensuring no repainting. BOS signals indicate trend continuation. CHoCH signals indicate a potential change in market structure and may appear less frequently depending on market conditions and timeframe.
The indicator is lightweight, fa
FREE

1. Indicator Overview 1.1 General Description Dynamic Support & Resistance (DSR) is a technical indicator that identifies dynamic support and resistance zones — price levels that continuously adapt to market movement, unlike fixed horizontal support/resistance lines. DSR precisely identifies the upper boundary (DSRt) and lower boundary (DSRb) of price oscillation within a defined lookback period — these are the levels where price tends to pause, reverse, or break out to form a new trend. 1.2 Id
FREE

This indicator works for daily market day trading, inspired from Traders Reality Main indicator on Trading view, This indicator got following features:- EMA, 5,13,50,200,800 you can change values and color according to your trading routine Pivot Points S levels Daily High, Weekly High Low, Monthly High Low Daily Open Psychological Hi and Low Average Daily Range Average Weekly Range Average Monthly Range PVSRA Vector Candle (liquidity) Candle Timer count down on last candle London and NewYork
FREE

Friend of the Trend: Your Trend Tracker Master the market with Friend of the Trend , the indicator that simplifies trend analysis and helps you identify the best moments to buy, sell, or wait. With an intuitive and visually striking design, Friend of the Trend analyzes price movements and delivers signals through a colorful histogram: Green Bars : Signal an uptrend, indicating buying opportunities. Red Bars : Alert to a downtrend, suggesting potential selling points. Orange Bars : Represent cons
FREE
MetaTrader市场提供了一个方便,安全的购买MetaTrader平台应用程序的场所。直接从您的程序端免费下载EA交易和指标的试用版在测试策略中进行测试。
在不同模式下测试应用程序来监视性能和为您想要使用MQL5.community支付系统的产品进行付款。
