Spots
- 指标
- 版本: 1.4
- 更新: 13 七月 2022

Investment Castle Spots — Candlestick Patterns, Spotted for You
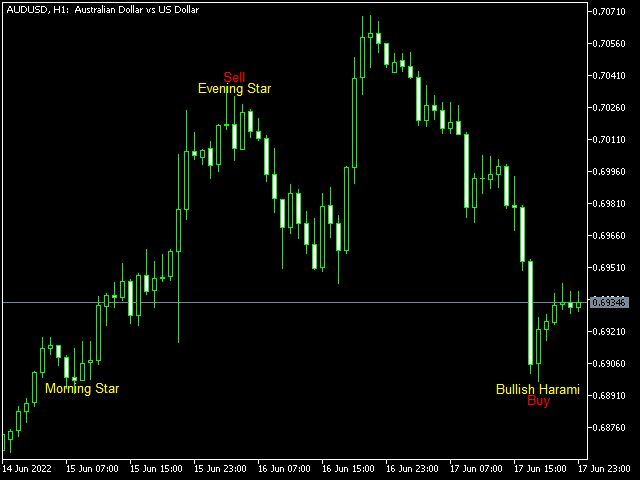
The Spots Indicator watches for the candlestick patterns traders rely on — engulfing, hanging man, doji and more — and marks them on your chart for cleaner entries and exits.
What it does for you
- Key patterns detected: engulfing, hanging man, doji and other classic candlestick signals.
- Entry & exit help: use the patterns to time your trades with more confidence.
- On-chart and clear: no manual pattern-hunting candle by candle.
- Works everywhere: any symbol, any timeframe.
Who it is for: candlestick traders who want their patterns flagged automatically.
Risk warning: trading involves substantial risk of loss. Always test on a demo account first and use risk settings you are comfortable with. Past performance does not guarantee future results.


Amazing. thanksssssssss