 MetaTrader 5
 专家
专家
 指标
指标
 程序库
程序库
 实用工具
实用工具
 窗口小部件
窗口小部件
 规则
规则
适用于MetaTrader 5的免费技术指标 - 39
 技术指标的信号外汇和股票市场的开仓交易和平仓交易起着至关重要的作用。指标的本质就是一种交易品种的数学转换,旨在预测未来的价格变化。
测试技术指标可以更有利于预测市场行为并从中获利。
技术指标的信号外汇和股票市场的开仓交易和平仓交易起着至关重要的作用。指标的本质就是一种交易品种的数学转换,旨在预测未来的价格变化。
测试技术指标可以更有利于预测市场行为并从中获利。 
Universal Trend Intelligence - Multi-Factor Market Analysis Universal Trend Intelligence (v1.0) is a custom MetaTrader 5 indicator for analyzing trend direction, trend strength and market conditions. It combines several technical measurements into one chart interface. Trend Score The indicator calculates a Trend Score from 0% to 100% using five components: Trend / EMA alignment using 20, 50 and 200 EMA. ADX directional strength. MACD momentum. Fractal market structure. RSI momentum. The default
FREE

Enhanced FVG Enhanced FVG is a technical indicator for MetaTrader 5 that identifies Fair Value Gaps on the chart and measures the buyer-to-seller volume ratio within each detected gap. Volume classification is performed using M1 timeframe tick volume data, applying the same methodology used in standard Volume Profile analysis. How It Works The indicator scans three consecutive candlesticks to detect Fair Value Gaps. A Bullish FVG is identified when the high of the first candle does not overlap w
FREE

KSQ S&D Signal Assistant (Top-Down MTF) The KSQ S&D Signal Assistant is a professional-grade, multi-timeframe decision support tool designed specifically for Supply & Demand and Smart Money Concept (SMC) traders. Instead of cluttering your chart with dozens of lagging indicators, this assistant works quietly in the background to analyze top-down market structure. It only alerts you when a highly specific, 3-point confluence occurs between the higher timeframe trend and lower timeframe order flo
FREE

具有双线信号、双级系统、多时间框架支持、可自定义视觉信号和高度可配置警报系统的高级TSI(真实强度指数)。
自由职业编程服务、更新和其他TrueTL产品可在我的 MQL5主页 获取。
非常欢迎您的反馈和评价!
什么是真实强度指数(TSI)? 真实强度指数(TSI)是由William Blau开发的动量振荡器。它对价格动量(当前收盘价与前收盘价之差)应用双重指数平滑,从而有效过滤市场噪音并揭示潜在趋势方向。 TSI在-100和+100之间振荡,由两条线组成:TSI主线和信号线(TSI的移动平均线)。正值表示看涨动量,负值表示看跌动量。两条线之间的交叉以及穿过高/低水平线的运动是主要的交易信号。 功能特点: 具有双级系统(高位和低位超买/超卖区域)的双线TSI(主线和信号线) 具有三个独立可配置信号缓冲区的视觉信号标记(箭头、垂直线) 高级信号检测:两条线的方向变化、线交叉、水平交叉、峰谷 具有时间范围过滤的可配置警报功能(电子邮件、推送、声音、弹出窗口) 具有插值、多种颜色模式和用于EA集成的iCustom缓冲区访问的多时间框架(MTF) 输入参数: 基本设置: TSI参数: 长周
FREE
When working with several assets and having several open positions in different assets, it is a little complicated to visualize how much profit or loss is in each asset, so with this problem in mind I developed this indicator where it facilitates the visualization of open operations in each asset , where you will be able to open several different assets and you will be able to visualize the individual result of each asset and speed up your decision making in your trades.
FREE

Every session is drawn on the clock your broker is really using, and the strip says which one it is: Server GMT+3, US DST on, EU DST on. The offset is measured from the price history of your own symbol, week by week, not typed into a box.
Stancel Tempo draws one strip across the top of the chart and answers one question: where you are in the trading day, and what comes next. It gives no signals, makes no predictions and suggests no entries.
What the strip shows - The whole day as one bar: Tok
FREE

Below is a fully rewritten, compliant description ready to paste into your MQL5 listing.
---
### Product Description (Copy & Paste)
**SMC Fair Value Gap (FVG) Scanner with Displacement Engine** is a MetaTrader 5 technical indicator designed to identify, filter, and track imbalances using Smart Money Concepts (SMC) price-delivery mechanics.
Standard FVG tools plot every minor gap across all market conditions, creating excessive noise during consolidation. This indicator introduces a multi-
FREE

Many traders use Price Action as entry and exit signal. Since the beginning of chart analysis, traders have found several candlestick patterns that can indicate possible "behaviors" of the market. Candlestick Pattern indicator is an indicator for MetaTrader platform that can detect many of these patterns and show them on screen or to alert traders about them. though they detect slightly different sets of candle patterns. Candlestick Pattern indicator also has a more modern look compared
FREE

这是一份为您准备的专业且优雅的中文介绍,非常适合发布在 MQL5 市场、个人网站或用户手册中。 Session Range Visualizer (开盘区间可视化工具) Alpha Neural 2026 v1.10 Session Range Visualizer 是一款专为 MetaTrader 5 设计的高级专业指标。它专为依赖市场时间周期、交易时段分析及价格行为策略(如 ICT、聪明钱概念 SMC、突破交易)的交易者打造。 该指标不仅仅是标记时间,它还深入分析每个交易时段内的价格表现,将原始数据转化为直观且具参考价值的视觉洞察。 核心功能 动态时段分析: 自动绘制 亚盘 (Asian) 、 欧盘 (London) 和 美盘 (New York) 的交易区间框,并完美支持跨越午夜零点的交易时段。 智能情绪偏向着色 (Sentiment Bias): 区间框颜色会根据价格表现即时变化: 绿色 (看涨): 收盘价高于开盘价(吸筹/看涨趋势)。 红色 (看跌): 收盘价低于开盘价(派发/看跌趋势)。 黄色 (中性): 价格维持在窄幅区间内(盘整/低波动)。 蓝色 (实时): 当前正在进
FREE

If you love this indicator, please leave a positive rating and comment, it will be a source of motivation to help me create more products <3 Key Takeaways Fisher is a repaint indicator. It recalculates previous bars when new bars become available. Modified to avoid repainting to accommodate some merchants. Fisher indicator is quite a simple histogram indicator that detects the trend's direction and strength and signals about trend changes. Traders look for extreme readings to signal potential p
FREE

Introduction to Fractal Moving Average Fractal Moving Average indicator was designed as part of Fractal Pattern Scanner. Inside Fractal Pattern Scanner, Fractal Moving Average Indicator was implemented as multiple of chart objects. With over thousands of chart object, we find that it was not the best and efficient ways to operate the indicator. It was computationally too heavy for the indicator. Hence, we decide to implement the indicator version of Fractal Moving Average indicator to benefit ou
FREE

Fast and Customizable Timeframe Switching for MetaTrader 5.
Timeframes Hotkeys is a lightweight MetaTrader 5 indicator that allows you to change the timeframe of the current chart instantly using keyboard shortcuts. Instead of moving the mouse to the MT5 timeframe toolbar or opening timeframe menus, you can move between your preferred chart periods with a single key or keyboard combination. The indicator is designed for scalpers, day traders, swing traders, price-action traders, and technical an
FREE

本指标是 MT5 专属的 K 线收盘实时监控与声音警报工具,核心实现指定周期 K 线收盘节点的精准提醒,搭配可视化全局开关、双模式警报与实时信息展示,操作便捷且适配全交易周期,避免错过关键交易时机,是交易盯盘的实用辅助工具。 核心功能 自定义监控周期,支持选择指定周期或当前图表周期,自动计算周期秒数,适配 MT5 全交易周期(M1-MN); 双模式独立声音警报,可分别开启 / 关闭 收盘前倒数预警 (自定义预警秒数)和 收盘 / 新 K 线生成警报 ,支持自定义警报音效文件; 可视化全局 GUI 开关,图表右上角悬浮操作按钮,一键切换警报启停,通过颜色、文字、图标直观区分状态,操作无延迟; 实时图表信息展示,动态刷新服务器时间、距离收盘剩余时间、警报全局状态,信息清晰明了,无需额外查看工具; 轻量化稳定运行,秒级精准监控,内置防抖动处理避免重复警报,指标卸载 / 关闭时自动清理定时器、按钮等对象,无残留不卡顿。 适配说明 支持 MT5 所有终端版本,兼容全交易品种、全 K 线周期;纯参数化配置,无需编程基础,即装即用,操作简单。
FREE

Overview Inspired by Tradingview’s falconCoin, The Market Cipher indicator is a momentum oscillator used to detect overbought/oversold conditions and potential trend reversals. Traders can also use it to spot divergences between price action and momentum for early entry or exit signals. Configuration Guide Core Indicator Settings The indicator calculates momentum using a short-term and a longer-term average. Momentum is plotted as a wave oscillating between overbought and oversold thresholds. Ov
FREE

What It Does This indicator shows up to 5 moving averages from any higher timeframe on your current chart. Instead of switching timeframes to see the bigger picture, you get the trend information in one place. Example: Trading on 1-hour chart while displaying Daily moving averages to see the longer-term trend. Key Features Flexible Configuration Display up to 5 moving averages with individual enable/disable options Choose any higher timeframe as your source (4-hour, Daily, Weekly, Monthly, etc.)
FREE

Next Bar Countdown 是一款高精度、高性能的 MetaTrader 5 時間指標,專為向交易者顯示當前燭台結束前的剩餘時間而設計。精確的時間對許多交易策略至關重要,尤其是在新燭台開啟時需要立即做出決策的情況下。 主要功能: 該指標提供多種超越標準計時器的功能: 雙時間框架顯示: 您可以同時顯示當前圖表時間框架和第二個可自由選擇的時間框架(例如 H4 或每日)的倒數計時。 防滯技術: 透過伺服器時間與本地系統時間之間的智能同步,計時器運行絕對流暢。即使市場波動性較低或週末未收到報價,它也不會跳過任何秒數。 個性化設計: 字體、大小和在圖表上的位置都可以完全根據您自己的圖表設置進行調整。 視覺警報: 在烛台收盤前的最後幾秒鐘,該指標可改變倒數計時的顏色,及時引起您的注意。 全面的通知系統: 當烛台即將收盤時,您可透過終端警報或直接發送到智慧型手機的推送通知隨時掌握最新資訊。 操作與反饋 安裝完成後,您可透過輸入視窗輕鬆設定所有參數。該指標可立即使用,無需複雜的預設設定。 由於此工具為免費提供,您的反饋或評價對我們而言非常寶貴。如果您有任何疑問或進一步優化的建議,可隨時使用內
FREE

RSI 彩色蜡烛 , 蜡烛颜色 指标 , 视图 指标 , RSI 颜色
功能介绍 RSI Trend Color 是一款智能可视化指标,可将 RSI 数值直接转换为K线颜色显示: 蓝色 :RSI 超卖 橙色 :RSI 超买 白色 :RSI 中性 附加功能: RSI 关键水平声音和视觉提醒 回调信号提醒 简单可自定义参数设置 适合人群 偏好视觉分析的交易者 RSI 初学者 专业交易者 MetaTrader 5 用户 使用方法 在 MetaTrader 5 中安装指标 自动显示在图表中 自定义设置: RSI 周期(默认:4) 启用或关闭提醒 观察颜色变化: 蓝色K线:可能的买入机会 橙色K线:可能的卖出机会 专业建议: 与 RSI Zone Memory Reative 搭配使用可提高分析准确率。 不具备的功能 不自动交易 不保证盈利 不替代风险管理 仅适用于 MT5 不是交易机器人 风险提示 交易存在资金亏损风险。本指标仅作为辅助分析工具,不保证盈利。 建议: 先在模拟账户测试 使用合理的风险管理 不投入超过可承受损失的资金 持续学习交易知识 技术信息 平台:MetaTra
FREE

Master REG Channel 适用于 MetaTrader 5 Master REG Channel 是一款基于线性回归的 MetaTrader 5 技术指标,用于辅助分析市场方向、斜率、价格位置以及价格在统计通道中的运动状态。 该指标计算一条线性回归中心线,并根据价格相对于回归线的离散程度计算上下两条通道边界。这种结构可以帮助观察主要运动方向以及当前价格在通道中的位置。 通道结构 Master REG Channel 包含三条主要线: Reg Mid
基于收盘价线性回归计算的中心线。其斜率代表计算结果所识别的主要方向。 Reg Upper
根据中心线和价格离散程度计算出的上方通道边界。 Reg Lower
根据中心线和价格离散程度计算出的下方通道边界。 上下边界与中心线之间的距离由价格的统计离散程度以及 InpDeviation 参数决定。 回归方向 中心线使用不同颜色表示由回归斜率确定的方向。 正斜率表示上升结构。 负斜率表示下降结构。 颜色变化可以帮助直观识别通道方向的变化。 Master Score 指标包含一个名为 Master Score 的内部计算系统,范围为 -
FREE

Professional Momentum Analysis Made Simple RSI Pro Pulse MT5 is a modern, professional, and beginner-friendly Relative Strength Index indicator designed to help traders understand market momentum, identify potential reversal zones, and spot high-quality trading opportunities with greater clarity. Unlike a basic RSI indicator, RSI Pro Pulse combines intelligent color changes, customizable signal logic, visual trading zones, alerts, signal arrows, and a compact information dashboard—all inside one
FREE

MerkatDD — MT5 浮动回撤的忠实哨兵 盈利只能告诉你这套参数赚到了钱,却永远不会告诉你它离亏光有多近。 它做什么 就像站岗的狐獴,MerkatDD 死死盯住你的持仓曾经出现过的 最大浮动回撤 ——实时更新,按 EA 分开,按参数组分开,全自动。挂到图表上就开始工作,无需任何设置。 两套参数同样赚了 400 美元,在资金曲线上看起来一模一样。但一套是从 90 美元的坑里爬出来的,另一套是从 900 美元的坑里爬出来的。MerkatDD 让你一眼看出谁是谁,而 Recovery 列把这件事压缩成一个可以直接排序的数字。 凌晨三点你在睡觉时发生的那次回撤,它也照样记下。 不只是有多深,还有多频繁 Max DD 回答的是 最糟糕的那一次有多糟 。 DD Hits 列回答的是另一个问题: 糟糕的情况多久发生一次 。它是嵌在每一行里的迷你柱状图,显示有多少个交易周期触及了你设定的各个回撤档位。阶梯陡峭,说明这套参数很少深跌;尾巴长而平,说明它经常深跌。把鼠标停在任意一根柱子上,就能看到准确次数。 设定中心档位、档位间距以及两侧各几档,所有分组就用同一把尺子衡量。之后改主意也不要紧——已
FREE

A stochastic oscillator is a momentum indicator comparing a particular closing price of a security to a range of its prices over a certain period of time. The sensitivity of the oscillator to market movements is reducible by adjusting that time period or by taking a moving average of the result. It is used to generate overbought and oversold trading signals, utilizing a 0-100 bounded range of values. This indicator show 8 stochastic on one chart.
FREE

Investment Castle Chances — Clear Buy & Sell Signals
The Investment Castle Chances indicator marks buy and sell opportunities right on your chart, with two strengths of signal so you can weigh each setup at a glance.
What it does for you Two signal strengths: Buy / Sell on orange candles, and Strong Buy (green) / Strong Sell (red) for higher-conviction setups. On-chart and obvious: act when you see the signal — no scanning or second-guessing. Flexible: trade the signals directly, or use them t
FREE

Daily VWAP — Institutional Reference for Intraday Value The Daily VWAP is a professional indicator based on the Volume-Weighted Average Price (VWAP) , designed to reveal the true balance between price and volume throughout the trading session. Unlike traditional moving averages, the Daily VWAP incorporates the weight of traded volume in every price movement, providing a much more accurate reference to the behavior of institutional traders and large market participants. What the indicator deliver
FREE

DeMarker指标,支持多时间框架,可自定义视觉信号及可配置警报系统。
自由职业编程服务、更新和其他TrueTL产品可在我的 MQL5主页 获取。
非常欢迎您的反馈和评价!
什么是DeMarker? DeMarker指标由汤姆·德马克(Tom DeMark)开发,将当前K线内的高低点与前一根K线的范围进行比较。在0到1之间波动,高于0.7视为超买,低于0.3视为超卖。与其他振荡器不同,它专注于方向性极端运动和K线内的疲竭,而非测量收盘价的动能。 DeMarker信号在指标穿越极值区域(0.7和0.3)时,或在指标与价格出现背离时生成。在识别真正的疲竭点方面,其被认为比简单随机指标更加可靠。 功能特点: 带箭头和垂直线的视觉信号标记 三个具有可配置触发器的独立信号缓冲区 信号检测选项:方向变化、穿越水平线、峰值/谷值 每个信号的可配置警报功能(邮件、推送、声音、弹窗) 支持插值方法的多时间框架(MTF)功能 柱状图或折线图绘制模式 多种颜色模式(简单、基于方向、基于水平) 通过自定义指标调用(iCustom)访问缓冲区,支持Expert Advisor(EA)集成 输入参数: 基
FREE

1. Introduction The CM_Ultimate_RSI_MTF is a powerful and versatile custom indicator for MetaTrader 5, designed to enhance your Relative Strength Index (RSI) analysis. It provides multi-timeframe (MTF) capabilities, visual signals, and customizable alerts, making it an invaluable tool for traders seeking to identify overbought/oversold conditions, trend strength, and potential entry/exit points across various timeframes. 2. Key Features Multi-Timeframe (MTF) Analysis: Allows you to view RSI from
FREE

Liquidity Pool Heatmap – 止损在哪里等待:以热力图和分布图显示买方与卖方流动性
Liquidity Pool Heatmap 显示止损单可能聚集的位置:摆动高点上方(买方流动性,BSL)和摆动低点下方(卖方流动性,SSL)。每个流动性池都以热力线绘制在图表上——池越强,线越粗越亮。右侧的分布图显示未被扫除的流动性在价格上的分布。
您将看到 - 摆动高点上方(买方)和摆动低点下方(卖方)的热力线,从摆动点延伸到当前K线。 - 以粗细和不透明度表示强度,强池周围有光晕,最强的池会被突出显示。 - 价格上方和下方最强池的标签:价格、占全部未扫除流动性的百分比,以及合并的等高点/等低点数量(例如 "x3")。 - 最近被扫除的池以淡色虚线保留,并在扫除K线处标出圆点,让您看到流动性刚刚在哪里被拿走。 - 右侧分布图:每个价格区域占全部未扫除流动性的比例,最强区域突出显示。
流动性池如何形成 - 每个确认的摆动高点/低点(摆动强度可调,默认左右各5根K线)都会生成一个池,位于摆动点之外一个小的止损缓冲处(x ATR)。 - 权重 = 摆动点附近的相对成交量与平均成
FREE

Orange Indicator by Quant Atlas Creator: https://www.quant-atlas.com/ Orange Indicator is a clean reversal focused indicator for MetaTrader 5, designed to highlight potential turning points directly on the chart using simple orange buy and sell markers. The indicator focuses on moments where price may be transitioning out of short term exhaustion and into a possible reaction phase. When a bullish setup appears, an orange upward triangle is displayed below the candle. When a bearish setup appear
FREE

Global Exchange Sessions Global Exchange Sessions is an MQL5 indicator that marks the regular trading hours of the world’s main stock exchanges directly on your chart. Each session is shown as a colored rectangle. The rectangle starts at the official market open and ends at the official market close. Its upper and lower edges follow the session high and low as new prices arrive. This makes it easy to see when major equity markets are active, where each session formed its range, and how price rea
FREE
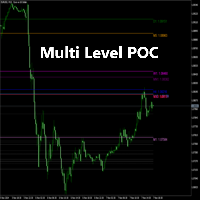
Detailed Description:
The Multi Level POC Indicator is designed for traders who want to identify critical price levels based on volume analysis across multiple timeframes. Key Features:
Multi-Timeframe POC Calculation: Automatically calculates and displays the POC from multiple timeframes, including M1, M5, H1, D1, and more. Intermediate Levels Display: In addition to the primary POC levels, the indicator also plots intermediate levels based on the POC. Custom Precision and Depth Settings: Us
FREE

Displays Stop Loss, Take Profit, and real-time profit/loss of open trades in a single panel. User-friendly, movable, and multilingual support for easier risk management.
risk management, stop loss, take profit, profit loss, portfolio analysis, MT5 indicator, trading panel, multilingual support General Description This indicator displays the Stop Loss, Take Profit, and real-time profit/loss values of your open trades in a single panel on the MetaTrader 5 platform. The panel features a user-frien
FREE

Coral trend is a trend-following indicator that is widely popular among FOREX traders . It is usually used as a confluence with other indicators. It uses combinations of moving averages with complex smoothing formulas! It has two configurable parameters: Coefficient - smoothing ratio (*)
Applied price Calculation: Coral = (-0.064) * B6 + 0.672 * B5 - 2.352 * B4 + 2.744 * B3
FREE
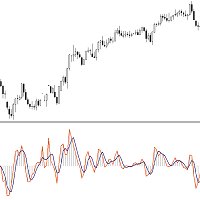
This Indicator is based on Mr. Dan Valcu ideas.
Bodies of candles(open-close) are the main component used to indicate and assess trend direction, strength, and reversals.
The indicator measures difference between Heikin Ashi close and open.
Measuring the height of candle bodies leads to extreme values that point to trend slowdowns. Thus quantifies Heikin Ashi to get earlier signals.
I used this indicator on Heiken Ashi charts but, it's possible to choose to calculate Body size based on Heik
FREE

Introducing the "Super Trend Filter Oscillator," your ultimate trading companion designed to enhance your technical analysis and help you make informed decisions in the financial markets. This innovative oscillator is crafted to provide valuable insights into market trends and price movements, assisting traders like you in identifying potential entry and exit points. Features: Trend Identification: The Super Trend Filter Oscillator excels in detecting prevailing market trends, whether they are b
FREE

Northstar Flow Candles MT5 is a free chart indicator for traders who use Heikin Ashi candles to review trend context. Its purpose is visual analysis, with candle states and optional markers on the MetaTrader 5 chart. This is a visual tool. It does not place trades or provide popup, push or email notifications. Chart context Five candle states: strong bullish, bullish, balanced, bearish and strong bearish. Context settings based on fast and slow exponential moving averages, ADX and ATR-normalize
FREE
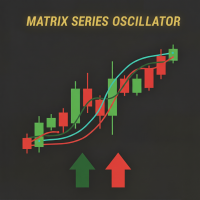
Matrix Series – 支撑、阻力及动量指标 在一个指标中显示关键支撑/阻力区域、超买/超卖水平以及市场强度。 Matrix Series 结合了 动态CCI 、平滑移动平均和标准差通道,为市场方向和关键水平提供清晰视图。蜡烛根据多空压力着色,并显示动态支撑/阻力区及超买/超卖可视化警报。 主要特征 趋势蜡烛颜色: 绿色=多头, 红色=空头 支撑与阻力区域: 根据可配置CCI周期动态计算 超买/超卖指标: 可视化警报提示极端状态 易于理解: 蜡烛方向与区域交互显示市场强度 完全可配置: 周期、平滑、OB/OS水平及区域显示 使用方法 趋势识别: 绿色蜡烛 → 多头; 红色蜡烛 → 空头 支撑/阻力交易: 观察价格与动态区域的交互以进行入场和出场 OB/OS确认: 信号穿越OB/OS水平增强交易决策 实际示例 绿色蜡烛,CCI高于阻力 → 强劲上升趋势,可能继续 红色蜡烛,CCI接近支撑 → 下跌趋势,可能出现新低 可视化OB/OS警报 → 显示潜在趋势反转 竞争优势 将多个工具整合到一个指标中:趋势蜡烛、CCI、支撑/阻力及OB/OS警报 在图表显示之前捕捉市场强度变化 过滤噪
FREE

Opening Levels Indicator MT5 Opening Levels is an MT5 indicator that displays open price levels from multiple timeframes directly on the chart. It provides a structured way to observe how price behaves around key reference levels such as the daily, weekly, and monthly open. Overview The indicator plots open price levels across selected timeframes and keeps them updated in real time. These levels can be used as reference points for: intraday trading levels market structure observation support and
FREE

黃金脈衝偵測器 H1 — 尋找脈衝和趨勢反轉的終極指南針!
交易黃金 (XAUUSD) 卻總是錯過強勁的市場行情?是時候全面掌控波動了!
黃金脈衝探測器 H1 是一款專為 MetaTrader 5 平台設計的專業指標,旨在識別關鍵的脈衝蠟燭圖,這些蠟燭圖預示著當前階段的結束,以及趨勢反轉或強勁脈衝延續的高機率。
該指標的強大功能是什麼?
捕捉異常波動(高低點範圍):
該指標能夠立即在圖表上找到峰值波動範圍超過指定美元閾值的「巨型」蠟燭圖。正是在這些蠟燭圖期間,一位重要參與者出現並改變了市場方向!
智慧型 ATR 演算法 + 收盤過濾器:
檢測相對於當前平均波動率的動態脈衝。此指標分析收盤時的K線影線:如果K線末端的回檔幅度很小,則表示買賣壓力持續到最後一秒-這是反轉形態出現的完美條件!
即時提醒,直接發送至您的智慧型手機:
您無需再24小時守在電腦前!一旦動量K線收盤,MT5平台會立即彈出提示視窗並發出聲音,同時您的智慧型手機上的MetaTrader應用程式也會收到推播通知。
簡潔的圖表,完美的操作:
此指標使用簡潔的矩形區塊清晰地突出顯示相關的K線
FREE

Candle Timeout is a simple indicator that displays the time a candlestick changes and is also available to display the spread range on market charts. This indicator is designed to help calculate the time a candle changes, both the Open and Close. It also provides a counter for the ASK and BID price ranges, or the spread, displayed in points (pts). Subscribe the MQL5 channel for other interesting information : (Automatic) Forex Tools Join new Public Group to Expressing Opinions and Sharing:
FREE
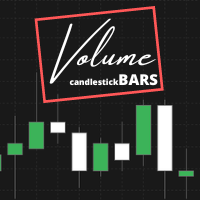
Indicator that show candlestick bars with an different sampling method than time fixed. Real time data is sourced to the indicator and it may be used as substitute of the default graph. Each bar is formed when a predefined volume of assets was dealt, showing in the graph the OHLC of this clustering. The amount of bars is proportional to the amount of negotiations instead of a sample in a fixed amount of time. If the broker doesn't show the real volume of the trades, this indicator won't work. Th
FREE
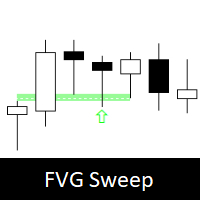
Fair Value Gap Sweep is a unique and powerful indicator that draws fair value gaps on your chart and alerts you when a gap has been swept by the price. A fair value gap is a price gap that occurs when the market opens at a different level than the previous close, creating an imbalance between buyers and sellers. A gap sweep is when the price moves back to fill the gap, indicating a change in market sentiment and a potential trading opportunity.
Fair Value Gap Sweep indicator has the following
FREE

Zigzag Indicator For RSI, To easily identify the highs and lows of the rsi signal. It is easier to observe divergent and convergent signals. Default setting: InpRsi =14 //Rsi Period InpDepth =12; // Depth InpDeviation =5; // Deviation InpBackstep =3; // Back Step
If you want open Exness account try this link : https://one.exness-track.com/a/teg5teg5 Dev buy taphu: Ha Van Tan - hatatrata - Trader's profile - MQL5 community Email: tan.ha@outlook.com
FREE

品种多空统计(Symbol Stats Board)是 MetaTrader 5 的纯图形面板指标:在图表上按【品种】分别统计「持仓订单」与「已关闭订单」的多空手数、多空盈亏,每个品种一行,末行汇总。 【两张表格】 · 持仓订单表:遍历当前持仓,按品种汇总 多单手数 / 多单盈亏 / 空单手数 / 空单盈亏(浮动盈亏,可选计入库存费)。 · 已关闭订单表:同样四列;统计区间可切换 今日 / 本周 / 本月 / 全部(按服务器时间计算,周以周一起始;盈亏默认含手续费与库存费,可分别关闭)。 · 汇总行:每张表末行为该表全部品种的合计;即使品种数超过显示上限,汇总仍统计全部品种。 · 多空归属:卖出平仓计入多单、买入平仓计入空单(与持仓方向相反),部分平仓按成交手数累加。 【交互】 · 底部按钮:今日 / 本周 / 本月 / 全部 切换统计区间;按品种 / 按盈亏 切换排序(A→Z 或盈亏从大到小);刷新 立即重算。 · 按住标题栏可拖动面板,拖动后不再自动跟随停靠角。 · 面板高度随品种数自动变化;超出图表高度时按缩放系数自动等比收缩,不会被裁切。 · 盈利绿色、亏损红色,便于快速区分。
FREE

BarionQuant MACD Color Lite displays a custom four-color MACD histogram that makes momentum shifts easy to read at a glance. DIF and DEF lines are included; divergence detection is reserved for the paid Divergence Pro edition. HOW IT WORKS DIF = Fast EMA(12) minus Slow EMA(26) DEF = Smoothed signal line of DIF Energy = (DIF − DEF) × 2, split into four histogram colors: Above zero, lengthening → red (momentum building) Above zero, shortening → aqua (momentum fading) Below zero, lengthening → gree
FREE

OracleTrading Candlestick Reversal Signals — 智能多层级确认的反转K线形态搜索工具 该指标可在图表上精准识别 18 种经典反转K线形态 。它不仅会绘制箭头,还会为每个信号赋予 1 到 10 的强度评分 ,评分依据包括与趋势方向的一致性以及来自 10 个主流技术指标 的多重确认。 这不是一个普通的“箭头”指标,而是一个真正的 confluence(多重确认)分析工具 。它能够有效过滤掉随机出现的弱形态,只保留那些从多个独立角度同时得到强力确认的高质量信号。 18 种K线形态 单根与双根K线形态: 锤头线 (Hammer)、倒锤头线 (Inverted Hammer)、吊颈线 (Hanging Man)、射击之星 (Shooting Star)、看涨/看跌吞没形态 (Bullish/Bearish Engulfing)、看涨/看跌孕线 (Bullish/Bearish Harami)、刺透形态 (Piercing Line)、乌云盖顶 (Dark Cloud Cover)、双顶/双底 (Tweezer Top/Bottom)。 强劲的三根K
FREE

LM Donchian Channel MT5 LM Donchian Channel MT5 is a clean and configurable technical indicator for MetaTrader 5. It displays the highest high and lowest low over a selected number of bars, creating a channel that helps users visualise recent price ranges on any chart and timeframe. The indicator is based on the classic Donchian Channel concept: Upper Channel: Highest high over the selected lookback period. Lower Channel: Lowest low over the selected lookback period. It can be used as part of yo
FREE

RSI + EMA Momentum for MetaTrader 5 RSI-Based Momentum Analysis with Multi-Timeframe Evaluation RSI + EMA Momentum is a MetaTrader 5 indicator designed to measure momentum through the relationship between RSI and its Exponential Moving Average (EMA). Instead of relying exclusively on traditional overbought and oversold levels, the indicator evaluates the distance between RSI and its EMA and normalizes the result using standard deviation. This process produces a momentum score that adapts to dif
FREE
+++++++++++++++++++++++++++++
+++ FREE VERSION - EURUSD ONLY
+++++++++++++++++++++++++++++
Please add PREFIX and/or SUFFIX via settings if your Broker Chart Symbol is different (e.g. suffix = .r).
+++
This is forecast system.
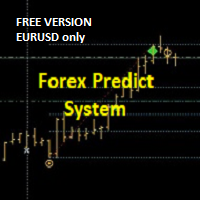
On the moment of the breakout/forecast: the indicator draws retrace zone (yellow) and three targets. The levels act as support and resistance. It can be used on all pairs/indices/timeframes/periods. For the higher timeframes (H4, H1, M30) it's better to engage at Optima
FREE

Introduction Poppsir is a trend-range indicator for metatrader 5 (for now), which distinguishes sideways phases from trend phases.
With this tool it is possible to design a trend following-, meanreversion-, as well as a breakout strategy.
This indicator does not repaint!
The signal of the Poppsir indicator is quite easy to determine. As soon as the RSI and Popsir change their respective color to gray, a breakout takes place or in other words, the sideways phase has ended.
Interpretation
FREE
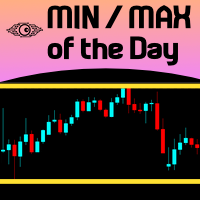
For those Price Action traders who love to trade strong Price points, like yesterday's HIGH and LOW, here is an indicator to ease the identification of those values, drawn directly on your chart! MIN/MAX of the Day will automatically draw 2 lines showing you those points for you, AND, if you like any HIGH and LOW in the past, not just yesterday's prices. It can also be configured to additionally show today's HIGH and LOW prices - just configure the refresh rate of those lines at your own taste/s
FREE


Live MTF Trend Panel for MT5 Professional Multi-Timeframe Trend Dashboard with Live Candlestick Analysis Live MTF Trend Panel adalah indikator profesional MetaTrader 5 yang menampilkan kondisi trend secara real-time pada 9 timeframe sekaligus , mulai dari M1 hingga Monthly , menggunakan analisis murni berdasarkan candlestick tanpa indikator teknikal apa pun. Panel ini dirancang untuk trader yang membutuhkan gambaran cepat mengenai arah pasar dari berbagai timeframe dalam satu tampilan yang ringk
FREE
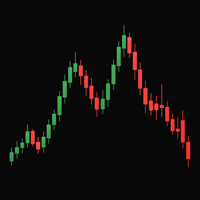
Simple Strategy Indicator The Simple Strategy indicator is a reliable tool for identifying trend direction, leveraging three popular technical indicators: MACD, RSI, and Stochastic. It provides clear trading signals for quick market analysis. Trend Detection Logic Buy signal: MACD above signal line, RSI > 50, Stochastic > 50 Sell signal: MACD below signal line, RSI < 50, Stochastic < 50 Advantages Suitable for various assets: forex, stocks, cryptocurrencies, indices Optimal on daily (D1) timefr
FREE

Descent Blade 指标是一套用于 MetaTrader 5 的非重绘趋势反转信号系统。它将 Wilder 抛物线 SAR 与一根 K 线滞后变体相结合,用于入场信号检测,并叠加比尔·威廉姆斯分形层,用来生成止盈(TP)和重新入场(RE)信号。所有信号都只在已确认收盘的 K 线上计算——一旦历史信号被绘制出来,就不会移动、改变或消失。 该系统解决了“裸用”抛物线 SAR 交易的核心问题:标准 SAR 在震荡行情中频繁翻转,在真正的趋势变化之间制造出大量虚假信号。滞后变体充当结构性确认阀门,在仍然捕捉每一次真实趋势反转的前提下,过滤掉高频噪音。BW 分形层为止盈和重新入场提供与结构相匹配的智能信号,会根据每一笔交易自身的摆动结构进行自适应调整。 查看 MT4 版本: Descent Blade MT4 查看更多产品: 所有产 品 想查看实盘示例和新工具,请访问我的个人主页并发送好友请求,以免错过任何更新! 工作原理 滞后 PSAR 交叉引擎 指标计算一个 Wilder 抛物线 SAR,支持可配置的 Start、Increment 和 Max 加速因子。滞后 PSAR 是在标
FREE

Take a Break Indicator gives any chart its own protection rules: pause before news, stop after a daily loss, trade only during your hours, or pause when your own indicator condition is true. News filter, drawdown protection, time filter and custom indicator rules per chart. It is the free companion of the Take a Break EA, which does the pausing for the whole account. Rules you can set per chart Custom indicator rules (MetaTrader 5): put any indicator on the chart and write a condition. RSI>70 ,
FREE

此指标显示世界主要市场的当前时间。它也显示当前时段。 使用非常容易。它不会占用太多图表空间。 它可以与 EA 或其它面板一起工作, 比如 虚拟交易板 。 这是经典风格版本。 Dear friends and users of our EAs, please add your ratings in the Reviews section. All updates to our forex software are free ! This is a free trading utility! 其它功能: 输入参数中有一个选项: 显示/隐藏鼠标覆盖按钮提示, 您也可以选择提示的语言英语 / 俄语; 关闭按钮终止此应用程序; 最大化/最小化按钮在图表上缩放格板; 格板可以在图表上移动。要想移动,在面板上部靠近关闭和最小化按钮的地方用鼠标拖拽,移动到期望的位置。 Expforex,Vladon,Indicator,Utility
FREE

Predator 8 AI AI 预测未来 8 根 K 线趋势延续概率
我的其他产品: https://www.mql5.com/ru/users/bitksk/seller
_______________________________________________________________________________________ 核心功能 每根 K 线实时输出未来 8 根上涨下跌震荡概率
内置 Lasso+Attention 深度学习模型 模型已固化无需联网无需编程 零重绘历史信号永不闪烁
支持外汇、黄金、加密货币、股指所有品种 AI 模型训练 使用 2015 至 2025 年超过 1200 万根真实 Tick 数据 专为 8 周期趋势延续优化 M15 至 H4 回测胜率 78.4% 信号类型 强多 弱多 震荡 弱空 强空 _______________________________________________________________________________________
使用方法 下载后重启 MT5 拖拽到图表即用 查看概率柱
FREE
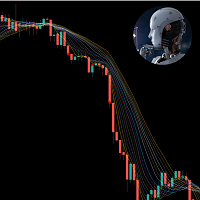
This indicator is very useful in observing the direction of the market. It allows users to enter multiple MA lines with specific display method. In addition, it is also possible to change the candle color same to color of the background of chart, so that we only focus on the MA lines. When a signal appears, represented by a red or green dot, we can consider opening a sell (red dot) or buy (green dot) order. Note: it need to set stoploss at the highest value of MA lines (with sell order) or lowe
FREE

The Horse DCA Signal 1.26 – สุดยอดนวัตกรรมอินดิเคเตอร์สำหรับการเทรดทองคำและทุกสินทรัพย์ The Horse DCA Signal คืออินดิเคเตอร์รุ่นล่าสุดจากตระกูล WinWiFi Robot Series ที่ได้รับการออกแบบมาเพื่อยกระดับการเทรดบนแพลตฟอร์ม MT5 โดยเฉพาะ โดยเป็นการผสมผสานอัจฉริยะระหว่างกลยุทธ์ Follow Trend และ Scalping เข้าด้วยกันอย่างลงตัว คุณสมบัติเด่น: ระบบลูกศรแยกประเภทชัดเจน: ลูกศรสีทอง: บ่งบอกสภาวะตลาดช่วง Sideway เหมาะสำหรับการเทรดแบบ Swing Trade หรือ Scalping เก็บกำไรระยะสั้น (2) ลูกศรสีน้ำเงินและสีแดง: บ่งบอกส
FREE

BarTimer v1.0 | Visualización Dinámica de Tiempo para MT5 BarTimer v1.0 es un indicador de alta precisión diseñado para traders que buscan gestionar el tiempo de cierre de sus velas sin saturar su espacio de trabajo. A diferencia de los contadores numéricos tradicionales, utiliza una barra de progreso visual que permite interpretar el ciclo del mercado de un solo vistazo. BarTimer v1.0 "La gestión del tiempo es tan crítica como la gestión del riesgo. BarTimer transforma un dato abstracto en una
FREE

AE-VWAP with Rejection Bands for Daily/ Weekly / Monthly AE-VWAP is a professional custom indicator that helps you evaluate the fair price of an instrument based on trading volume. The calculation is based on VWAP (Volume Weighted Average Price), a volume—weighted average price that is widely used in intraday and medium-term analysis.
Unlike regular moving averages, VWAP takes into account not only the price, but also the volume, giving more weight to those levels where the main trading activi
FREE
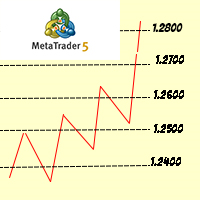
The big figure is a crucial aspect of forex trading, serving as a reference point for trade execution, risk management, and technical analysis. By understanding the importance of the big figure and incorporating it into their trading strategies, forex traders can improve their decision-making process and increase the likelihood of successful trades. Why is the Big Figure Important? The big figure is important for several reasons: Simplification: Traders often refer to the big figure when discu
FREE

WaveTrend Arrow LIGHT is a clean and lightweight WaveTrend-based arrow indicator for MetaTrader 5. This free version focuses purely on visual buy & sell arrows , generated from WaveTrend WT1 and WT2 crossings, without alerts or notifications. It is designed for traders who prefer a simple, non-repainting arrow indicator and for developers who want a stable signal source for EA integration . Features: Buy & Sell arrows based on WaveTrend crossing Non-repainting signals (closed bar option) Clean a
FREE

Fisher Transformation Indicator for MT5 – Spot Trend Reversals Before They Happen! The Fisher Transformation Indicator is your go-to tool for crystal-clear market movement detection. Through mathematical transformation of price data, it delivers unmistakable buy and sell signals – right there in your chart where you need them.
Key Benefits: Early Warning System for Trend Changes – catch uptrends and downtrends before the crowd Crystal Clear Buy & Sell Signals – color-coded for instant recogniti
FREE

Market Structure (BOS & CHoCH) Pro Il trading basato sulla Price Action e sullo Smart Money Concepts (SMC) richiede un'identificazione precisa e tempestiva della struttura di mercato. L'indicatore Market Structure BOS & CHoCH automatizza questo processo complesso, tracciando in tempo reale le rotture di struttura (BOS) e i cambi di carattere (CHoCH) direttamente sul tuo grafico. Che tu sia uno scalper o uno swing trader, questo strumento ti aiuterà a mantenere la concentrazione sulla direzionali
FREE

MACD Signal Pro – Многовременной сканер
MACD Signal Pro – это продвинутый индикатор, разработанный для трейдеров, которым нужны четкие, отфильтрованные и подтвержденные сигналы на разных таймфреймах.
Он сочетает в себе мощь классического MACD с интеллектуальным многовременным сканером, отображаемым в современном визуальном интерфейсе, чтобы избежать ложных сигналов и повысить точность входа.
Идеально подходит для Форекс, индексов, криптовалют и металлов.
ОСНОВНЫЕ ХАРАКТЕРИСТИКИ
FREE

本指标基于抛物线 SAR 指标。它可帮助用户识别何处进行买入、卖出。当新信号出现时,它可发出提示和声音。它还具有发送邮件功能。您的邮件地址和 SMTP 服务器设置应该在 MetaTrader 5 的 "邮箱" 标栏里的设置窗口里指定。 蓝色向上箭头 = 买。 红色向下箭头 = 卖。 Line = 尾随终止。 您可以使用一款我的移动止损产品,来自动移动止损,并包括设置盈亏平衡。 ROMAN5 分形尾随终止 ROMAN5 抛物线SAR 尾随终止 ROMAN5 布林带尾随终止 ROMAN5 HeikenAshi 尾随终止 ROMAN5 均线尾随终止 ROMAN5 高级尾随终止
FREE

Daily PnL Dashboard is a clean, draggable on-chart panel that shows your real trading results at a glance — no more digging through the account history tab.
What it shows: - Today's result — big and clear, with the number of closed trades. - Daily breakdown for the week: each of the last 7 days (or the current week from Monday) with a proportional bar per day, so you instantly see your best and worst days. - Weekly and all-time totals, including the all-time result as a percentage of your net d
FREE
The selective pin bar is designed to identify reversals. To use the selective pin bar effectively, traders typically look for Strong Rejection: The tail of the pin bar should extend significantly beyond the surrounding price action. It indicates that there was a sharp rejection of higher or lower prices during the trading period. A strong rejection suggests that the market sentiment may be changing.
FREE

AI London Session Range Indicator automatically draws the London session's opening range as a box on your chart, giving breakout and session traders an instant, objective reference for the high-volatility window that sets the tone for the rest of the trading day. The indicator tracks the exact high and low reached during the configured opening-range window after the London session start, plots it as a shaded box, and keeps it visible for the rest of the session so you can watch for breakouts, re
FREE

M30 Power: Pullback Analyzer Unlock the precision of multi-timeframe analysis with the M30 Power: Pullback Analyzer . Designed for serious day traders, this indicator bridges the gap between M30 market structure and M1 execution, helping you identify high-probability pullback entries with surgical accuracy. NOTE: Dont overtrade inside a M30 Period. If you took one or two scalps, wait for the next M30 Candle/Period.
Core Functionality The indicator divides the trading day into 30-minute stru
FREE
学习如何在MetaTrader AppStore上购买EA交易,MetaTrader平台的应用程序商店。
MQL5.community支付系统支持通过PayPay、银行卡和热门付款系统进行交易。为更好的客户体验我们强烈建议您在购买前测试EA交易。
