 MetaTrader 5
 专家
专家
 指标
指标
 程序库
程序库
 实用工具
实用工具
 窗口小部件
窗口小部件
 规则
规则
适用于MetaTrader 5的免费技术指标 - 37
 技术指标的信号外汇和股票市场的开仓交易和平仓交易起着至关重要的作用。指标的本质就是一种交易品种的数学转换,旨在预测未来的价格变化。
测试技术指标可以更有利于预测市场行为并从中获利。
技术指标的信号外汇和股票市场的开仓交易和平仓交易起着至关重要的作用。指标的本质就是一种交易品种的数学转换,旨在预测未来的价格变化。
测试技术指标可以更有利于预测市场行为并从中获利。 
The indicator displays divergence for any custom indicator. You only need to specify the indicator name; DeMarker is used by default. Additionally, you can opt for smoothing of values of the selected indicator and set levels whose crossing will trigger an alert. The custom indicator must be compiled (a file with ex5 extension) and located under MQL5/Indicators of the client terminal or in one of the subdirectories. It uses zero bar of the selected indicator with default parameters.
Input parame
FREE

Blame The Box is a lightweight, session range and breakout analysis indicator. It identifies custom intraday consolidation sessions, maps out dynamic breakout levels, and displays real-time position sizing directly on your chart.
Key Features Automated Session Mapping: Automatically detects and frames intraday consolidation ranges (such as the Asian session) with a customisable background and border box. Dynamic Level Projections: Automatically plots Long/Short entry buffers, Stop Loss, Break
FREE
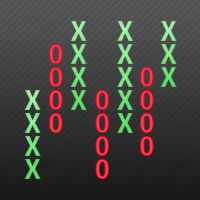
This indicator displays Point & Figure charts (PnF charts) in the indicator window. PnF charts show only price movements that are bigger than the specified box size. It helps to eliminate noise and allows focusing on main trends. Time is not a factor here. Only price movements are taken into account. That is why PnF chart is not synchronized with the main chart it is attached to. More about PnF charts: http://stockcharts.com/school/doku.php?id=chart_school:chart_analysis:pnf_charts Indicator wor
FREE

注意:此免費版本只可使用到2026/09/30
交易最怕的不是虧損,而是「方向不明」
為什麼很多交易者會被掃出場?因為他們只看單一時框。本指標透過 AI 降噪技術,將 H1 的穩健與 M15 的靈敏結合,為您打造一個自動化的趨勢過濾網。
「讓數據說話,讓 AI 帶路,您只需負責收穫成果。」本指標在商品行情圖表中顯示H1(圓點)與M15(箭頭)兩個時間段的趨勢方向,其他時間段的計算結果會顯示於下方的曲線圖中。行情的走向、震盪、強度、交易量等請參考Stochastic, MACD, RSI等指標,指標可精準地判斷波段的方向與合適的進出場時機。
指標特色如下:
1. AI 多重時框(MTF)動態演算
本指標搭載 AI 趨勢過濾算法,自動同步 H1 (長期趨勢監測) 與 M15 (精準進場導航)。AI 會自動過濾掉已知趨勢方向中不具備獲利空間的微小波動,確保你始終站在大趨勢的正確一邊並且減少盤整時的心理壓力。
H1 圓點: 您的導航雷達,鎖定大波段方向。
M15 箭頭: 您的開火按鈕,精準捕捉發動瞬間。
2. 雙週期行情圖,一眼看出方向與
FREE

The indicator draws daily support and resistance lines on the chart, as well as the Pivot level (reversal level).
Adapted to work in MT5
The standard timeframe for calculating support and resistance levels is D1. You can choose other timeframes according to your strategy (for example, for M1-M15, the optimal timeframe for calculations is H1)
The function for calculating support and resistance levels has been updated; in this calculation option, fibonacci levels are taken into account, respec
FREE

RSI Zone Master: Advanced Smooth RSI & Dynamic Visual Zones A revolutionary RSI indicator with anti-noise smoothing algorithms and transparent dynamic visual zones. Spot Overbought, Oversold, and Sideways areas in the blink of an eye! Take Your RSI Analysis to the Professional Level The Relative Strength Index (RSI) is one of the most powerful indicators in the trading world, yet it often produces false signals (noise) due to erratic price movements. RSI Zone Master is here to solve that problem
FREE

I present the well-known Moving Average indicator.
This indicator is presented as a channel, where the upper and lower lines are equidistant from the main line by a percentage set by the user.
The indicator is easy to use. The basic settings of the moving average have been saved and a percentage parameter (Channel%) has been added.
Basic parameters:
Channel% - shows how much we want to deviate from the main line.
The indicator is freely available.
FREE
Fibonacci Timing Indicator by Quant Atlas Creator: https://www.quant-atlas.com/ Fibonacci Timing Indicator is a clean signal based trading tool designed to identify potential turning points through a timing sequence framework inspired by Fibonacci spacing. The indicator studies price behavior across selected historical reference points and looks for repeated directional pressure. When the sequence reaches completion, it plots a clear signal directly on the chart. Signal Display • Green upward t
FREE
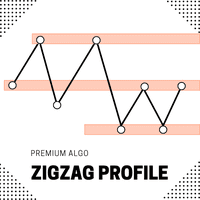
Introducing the ZigZag Profile — a powerful tool designed to identify high-probability pivot zones where price action frequently reverses. This indicator analyzes historical price data to pinpoint key areas where price has pivoted multiple times, providing traders with actionable insights into potential support and resistance levels. The ZigZal Profile indicator continuously scans for zones where price has reversed direction the most, highlighting these critical areas on your chart. By focusing
FREE

DS Candle Range Theory V1.0 Multi-Timeframe Candle Range Analysis Indicator for MetaTrader 5 Overview DS Candle Range Theory V1.0 is a MetaTrader 5 indicator designed to analyse and display candle range behaviour directly on the trading chart. The indicator provides traders with a structured view of candle characteristics including range size, candle body, wick behaviour, expansion, compression, and directional movement. By displaying candle range information across selected timeframes, traders
FREE

The Market Momentum indicator is based on the Volume Zone Oscillator (VZO), presented by Waleed Aly Khalil in the 2009 edition of the International Federation of Technical Analysts journal, and presents a fresh view of this market valuable data that is oftenly misunderstood and neglected: VOLUME. With this new approach of "seeing" Volume data, traders can infer more properly market behavior and increase their odds in a winning trade.
"The VZO is a leading volume oscillator; its basic usefulness
FREE
Мой самый популярный и востребованный продукт здесь https://www.mql5.com/ru/market/product/41605?source=Site+Market+Product+From+Author#
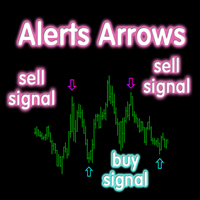
Индикатор стрелочник идеален для торговли в боковике, очень точно показывает моменты перекупленности и перепроданности инструмента, с дополнительными фильтрами также можно использовать для торговли по тренду. На экран выводятся стрелки сигнализирующие о развороте тренда, направление стрелки показывает дальнейшее направление торговли, также имеется звуковое о
FREE
Simple Spread Indicator (SSI) is a simple and lightweight indicator that displays the current spread value directly on the main chart window.
It helps traders instantly recognize market liquidity conditions and trading costs without opening additional panels or tools. Features Real-time spread display on the main chart Customizable position and font size Minimal system load and no data buffering Useful for scalping and low-spread strategy monitoring How it works The indicator calculates the diff
FREE

纯数学助力交易稳定
TPR Dashboard Signals PRO 是一款适用于 MetaTrader 5 的高级多货币对日线信号仪表盘。该指标基于多项式回归、统计概率建模和三层市场机制分类系统,消除了猜测和主观图表解读。
PRO 版本有何不同?
免费版提供原始分析,而 PRO 版本通过添加入场点和止盈点,提供绝对清晰的执行指导。
4.0 版本新增功能:简易版
4.0 版本根据用户反馈进行了重新设计,旨在实现一个目标:让仪表盘易于使用,同时提供清晰的执行指导。只需在交易时段开始时设置挂单和止盈点,即可完成设置,每天只需不到 10 分钟。
1. 全面支持交易时段选择
选择符合您个人交易安排的交易时段。仪表盘会根据您的选择自动重新校准所有数学模型:
亚洲交易时段
欧洲交易时段
纽约交易时段
无需计算时区。该指标会自动检测您经纪商的服务器时间(GMT+3)。
2. 支持所有货币对和所有交易品种
现在,您不仅可以获得外汇货币对的信号,还可以获得商品、加密货币、股票等所有交易品种的信号,前提是这些品种至少有两年的交易历史。
3. 固定入场点和止盈点(专业版)
FREE

Regime Matrix 是一款多时间框架市场状态指标,旨在对所选时间框架上的当前市场环境进行分类。它会直接在图表上显示紧凑的分析面板,并通过 iCustom() 为智能交易系统提供缓冲区。 该指标帮助交易者评估市场是处于趋势、区间、压缩、扩张,还是过度延伸状态。每个时间框架都会独立计算,使短期与高周期市场条件能够在同一视图中进行比较。
面板列 TF — 被分析的时间框架。 STATE — 检测到的市场状态。 LONG — 0 到 100 的方向偏向评分。数值越高,表示多头条件越强。 SHORT — 0 到 100 的方向偏向评分。数值越高,表示空头条件越强。 VOL — 标准化波动率评分。接近 1.00 的数值表示正常波动率,低于 1.00 表示波动率降低,高于 1.00 表示波动率升高。VOL 不表示交易量或跳动量。
市场状态 中性 — 未检测到主导性的市场条件。 上升趋势 — 当前结构偏向上行。 下降趋势 — 当前结构偏向下行。 区间 — 未检测到强烈的方向性主导。 压缩 — 波动率相对收缩。 扩张 — 相较近期条件,波动率处于升高状态。 向上过度延伸 — 价格相对于当前结
FREE

Hammer & Shooting Star — Precise Pattern Detector Detects hammer and shooting star patterns with full control over body size, wicks, ratios, candle color, Bollinger Band filter, and N-candle confirmation. All symbols and timeframes. Full Description Hammer & Shooting Star is a professional candlestick pattern indicator for MetaTrader 5. It detects bullish hammers and shooting stars using a multi-layer filter system that provides precise control over every structural component of the candle — far
FREE
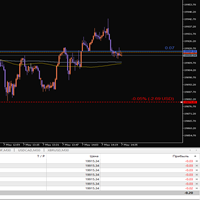
This indicator is designed for visual risk management and monitoring of open positions on the chart. It automatically calculates and displays: The average entry price for all open positions of the current instrument. The total volume of positions. A horizontal Stop Loss line, which can be moved manually. The potential loss if SL is triggered – both as a percentage of the account balance and in the account currency.
FREE

This simple indicator paints with a darker color on the volume bar when the quantity traded is above the average of select number of periods of the volume itself, highlighting the moments when there was a large volume of deals above the average. It is also possible to use a configuration of four colors where the color tone shows a candle volume strength. The indicator defaults to the simple average of 20 periods, but it is possible to change to other types of averages and periods. If you like t
FREE

Anchored VWAP is a lightweight, interactive volume-weighted average price indicator designed for traders who need precision without clutter.
Unlike standard VWAP that resets every session, this tool lets you drop up to five custom anchors directly on any candle. Each anchor calculates VWAP from that exact point forward, complete with standard deviation bands to highlight where price may find support or resistance relative to volume.
Key Features: • Up to 5 simultaneous anchors — compare multi
FREE

*** IMPORTANT NOTE: The indicator dynamically adapts to your chart background. Try switching between Light and Dark themes for the best visual experience. ***
LZ Session Boxes Indicator is a streamlined, automated session time indicator designed to simplify your daily market analysis. It accurately draws the three major trading sessions (London, New York, and Asia) directly on your chart for the current trading day.
Powered by an intelligent Auto-DST (Daylight Saving Time) detection engine, t
FREE

Liquidity Labs Candle Power is a real-time market-analysis indicator for MetaTrader 5 designed to show the strength, direction and condition of the current price move in one compact dashboard.
Instead of requiring several separate indicators and windows, Candle Power brings candle behavior, directional pressure, trend context, momentum, volatility and pattern information together directly on the main chart.
The indicator is designed as a decision-support tool for discretionary traders. It doe
FREE

The "Session Time Vertical Lines" indicator displays vertical lines on the chart that mark the beginning and end of major global trading sessions: Sydney, Tokyo, London, and New York . It is designed to help traders visually identify active market hours, overlaps, and potential high-volume periods directly on the price chart. This tool is especially useful for intraday traders who rely on market session timing to plan entries and exits. Inputs / Settings Parameter Name Description DaysToDraw Num
FREE

动量(Momentum)指标,支持多时间框架,可自定义视觉信号及可配置警报系统。
自由职业编程服务、更新和其他TrueTL产品可在我的 MQL5主页 获取。
非常欢迎您的反馈和评价!
什么是动量指标? 动量指标通过将当前价格与n个周期前的价格进行比较来衡量价格变化的速度。高于100的值表示上升动量(当前价格高于n个周期前),低于100的值表示下降动量。100处的中心线作为零参考。它是最简单却最有效的趋势强度指标之一,帮助交易者及早进入趋势并识别疲竭点。 动量信号在穿越100线(趋势转换)、穿越自定义水平线或出现背离时生成。价格上涨时动量上升确认趋势,而价格上涨时动量下降则暗示可能的反转。 功能特点: 带箭头和垂直线的视觉信号标记 三个具有可配置触发器的独立信号缓冲区 信号检测选项:方向变化、穿越水平线、峰值/谷值 每个信号的可配置警报功能(邮件、推送、声音、弹窗) 支持插值方法的多时间框架(MTF)功能 柱状图或折线图绘制模式 多种颜色模式(简单、基于方向、基于水平) 通过自定义指标调用(iCustom)访问缓冲区,支持Expert Advisor(EA)集成 输入参数: 基本设
FREE

Market Strike SignalBox Market Strike SignalBox is a clean visual indicator that draws structured trade zones directly on the chart: Entry , Stop Loss , TP1 , and TP2 .
It is designed for traders who want a fast, “at-a-glance” view of potential setups without complicated dashboards. This product is NOT an Expert Advisor and does not open/close trades . It provides visual signals only . What You Get on the Chart When a valid signal is detected, the indicator will display: Entry level Stop Loss (S
FREE

GANN TRIANGLE PRO v4.0 - OPTIMIZATION ANALYSIS REPORT CURRENT VERSION ASSESSMENT (v3.8) Strengths Feature Evaluation Swing Point Detection Clear logic using Left/Right bars Fibonacci/Gann Ratios Properly applied 61.8%, 100%, 161.8% Dashboard Real-time updates with visual indicators Code Structure Clean, maintainable architecture Critical Limitations Issue Impact Win Rate Effect No Trend Filter Signals against major trend -20% to -30% Missing Volume Confirmation False breakouts not filt
FREE

The Multi Strategy Ranges Indicator MT5 is a powerful tool designed to detect and visualize price consolidation zones in the market. This indicator identifies ranges and draws them on the chart, providing clear signals for efficient trading. Key Features Our indicator incorporates three essential strategies for trading within consolidation ranges: Range Breakout Strategy: A classic range breakout strategy. When the price breaks the upper or lower boundary of the range, a buy or sell signal i
FREE

TANIN POLYLINE MT5 is the ultimate drawing assistant for Price Action traders. If you love the flexibility of the Polyline tool on TradingView, this indicator brings that exact experience to your MetaTrader 5 terminal.
Designed by Tanin Coder , this tool allows you to map out market structures, waves, and trends with speed and precision. A professional, fast, and convenient Polyline drawing tool inspired by TradingView. Supports Magnetic Snap, Straight Lines, and Auto Price Labels. RECOMMENDE
FREE
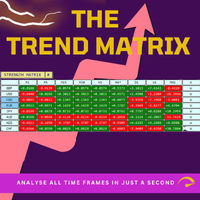
Trend Teller 趋势通告器是一款强大直观的仪表盘工具,可让您一目了然地查看所有主要货币对和时间周期(从 M1 到 MN1)的市场趋势。 由交易者为交易者打造,此工具消除了趋势分析中的猜测,让您始终保持与大趋势一致。 大多数新手交易者在判断市场方向时遇到困难,有时甚至是专业交易者也会出错。 因此,无论您是初学者还是资深交易者,Trend Teller 都是您的理想选择。 主要特点: 多时间周期分析
一键扫描所有主要货币在所有时间周期内的强弱和趋势方向,适合剥头皮、日内或波段交易。 可自定义显示
信息太多?没问题。您可以选择只显示数值或颜色信号,甚至隐藏某些时间周期,让界面更简洁。 内建通知功能
无需全天盯盘!当出现强趋势或交易信号时,系统会自动发送通知,让您在最佳时机做出反应。 新手友好,专业适用
不论您是新手还是老手,掌握趋势方向都是关键。Trend Teller 简化趋势分析,连专业交易者也能受益。 交易信号提示
当出现高概率趋势时,仪表盘底部的信息会从“WAIT A BETTER SETUP”变为实时提示,帮助您在交易前进行验证。 适用于新闻交易
在重大新闻事件
FREE

============================================================================== DIVERGENCE HUNTER PRO v2.01 Advanced Multi-Oscillator Divergence Detection System ==============================================================================
OVERVIEW
Divergence Hunter Pro is a professional-grade divergence detection indicator that automatically identifies high-probability trading oppor
FREE
The Candle Countdown Timer for MetaTrader 4 (also available for MT5) is a vital indicator designed to help you manage your trading time effectively. It keeps you updated about market open and close times by displaying the remaining time before the current candle closes and a new one forms. This powerful tool enables you to make well-informed trading decisions. Key Features: Asia Range: Comes with an option to extend the range. Broker Time, New York, London Time: Displays the current broker time
FREE

CandleForce Pro: The Ultimate Decision-Support Dashboard for Modern Traders Introduction: Overcoming the Chaos of Modern Markets
In today's hyper-connected financial markets, the modern trader faces a paradox of choice. We are inundated with an endless stream of data, indicators, news, and strategies, all promising to unlock the secrets of profitable trading. This constant influx often leads to "analysis paralysis"—a state of cognitive overload where conflicting signals create confusion, hesit
FREE

VWAP Historical Levels is a practical VWAP indicator for MetaTrader 5 that combines the current VWAP structure with important levels calculated from completed sessions or anchor periods. Its main advantage is the ability to preserve the previous period’s VWAP, Upper Band 1 and Lower Band 1 as horizontal historical levels. This makes it easier to see where price was previously considered balanced and how the current market reacts to those levels. HOW HISTORICAL LEVELS CAN BE USED At the end of ea
FREE

这是一个正在积极维护的版本,已针对当前的MT5版本进行了重新构建和扩展。
判断市场是否处于趋势中并不难。但仅凭价格来判断该趋势是否仍具有真正的动能,还是已开始失去动力,则较为困难。
Phoenix 趋势强度计将基于 ADX 的趋势强度与基于 RSI 的方向性信心结合起来,在您的当前图表上形成一条“趋势状态线”,并在趋势状态发生变化或出现疲软迹象时发出警报。
如何解读市场信心
- ADX 强度指标,分为“弱”、“中等”或“强”三类,阈值和周期均可配置 - 基于 RSI 的信心指标,分为五个区域 - “趋势状态线”,将两项读数汇总于一处 - 趋势状态变化和动能枯竭警报,各自设有独立的冷却时间
使用“凤凰趋势强度计”可: - 在入场前确认趋势背后是否具备真实动能 - 当趋势信心开始减弱时获得早期预警 - 在确定交易策略前,过滤掉疲软或方向不明的市场状况
使用方法
1. 添加至任意图表。 2. 入场前请查看“趋势状态线”,而不仅仅是单纯的 ADX 或 RSI 数值。 3. 启用趋势状态变化和动能耗尽警报,以免趋势转变被忽视。
安装
从 MQL5 市场下载并添加到任意图表上。
FREE

Candle Timer displays a live countdown timer showing exactly how much time remains before the current candle closes. It updates every 500 milliseconds, giving you a near-real-time readout directly on your chart — no more guessing when the next bar will form. Key Features & Advantages Two flexible display modes Corner Overlay — pins the timer to any corner of your chart screen (top-left, top-right, bottom-left, bottom-right), staying fixed as you scroll or zoom. Ideal for keeping the timer always
FREE

Im Sorry Ai Signal v1.26 – Precision Gold Scalping for MT5 Elevate your trading with Im Sorry Ai Signal , the latest technical indicator from the WinWiFi Robot Series . Specifically engineered for Gold (XAUUSD) scalpers on the MetaTrader 5 platform, this tool simplifies complex market movements into clear, actionable visual signals. Designed with a focus on Price Action within the M5 (5-Minute) timeframe , this indicator helps traders identify high-probability entry points in the fast-paced gol
FREE

Swiss InsideOutsideBar Imortance of Inside- and Outside Bars Inside bars are completely engulfed by its previous bar. The pattern is also known as "harami" (pregnant). Outsidebars engulf the previous bar. Inside bars might mark situations before an outbreak. They are a condensed form of a symmetrical triangle. Symmetrical triangles represent a battle between bulls and bears. There can be an outbreak to either side, mostly the outbreak is in direction of the main trend. The combination of inside
FREE

This MQL5 indicator, often referred to as the Phoenix March or Freedom Orb, is a comprehensive intraday trading tool that combines Session Range analysis with Smart Money Concepts (SMC). It is designed to automate the detection of key institutional levels and trend shifts directly on the chart. Core Indicator Features Session & ORB Zones: Automatically identifies the "Open Range" based on a user-defined start time (e.g., 03:00) and duration (e.g., 15 minutes). It plots the highest and lowest pr
FREE

Standard RSI uses a fixed smoothing factor. Every bar gets the same weight whether the market is trending cleanly or chopping sideways. That is why most RSI signals fail during consolidation. Mystical RSI measures how chaotic price action is on every bar using the Fractal Dimension Index and dynamically adjusts its smoothing in real time. When the market trends, it reacts fast. When the market chops, it slows down and filters out noise. No manual adjustment needed. How It Works The indicator cal
FREE
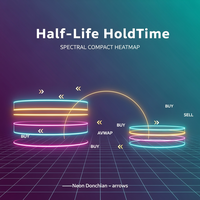
Half-Life HoldTime Spectral Compact Heatmap The Half-Life HoldTime Spectral Compact Heatmap indicator for MetaTrader 5 provides advanced analysis of suggested hold times for trades using AR(1) half-life estimation, spectral cycle fusion, and a confidence heatmap. This tool helps traders optimize their position management by visualizing the most probable hold durations and market regimes. Key Features: AR(1) Half-Life Estimation: Calculates the suggested hold time for a position using autoregres
FREE

The Jackson Auto Candlestick Pattern . It a powerful price action tool which auto detect and alert a hided powerful candlestick patterns . It came with few different chart skins. You can use this indicator alone to make profit, but it powerful when you combine it with trendlines, You can download The Jackson Auto Trendlines for free Link : UCRW695l9Wgg2ucnnf5DL5Vw List of Candlestick Pattern it detect 1. Bullish & Bearish Engulfing's 2. Top and Bottom Tweezer 3. Bullish and Bearish Harams 4.
FREE

FVG Super Trend FVG Super Trend is an advanced Smart Money Concepts (SMC) indicator designed to identify high-probability Fair Value Gaps (FVGs) with trend confirmation and momentum filtering. The indicator combines: Fair Value Gap (FVG) detection MACD momentum confirmation EMA trend filtering ADX angle strength analysis Multi-Timeframe (HTF) candle confirmation Intelligent FVG classification system Real-time alerts and notifications Unlike ordinary FVG indicators, this tool filters weak market
FREE

PINBAR SCANNER PRO with TREND and RSI + CCI OSCILLATORS filter This indicator has been designed to automatically and constantly scan entire market to find high probability pinbar formations, so you can just wait for the perfect trading opportunity come to you automatically.
PINBAR is the strongest candle reversal pattern known in technical analysis. It shows excellent areas to determine potential entries and exits with opportunity to use excellent risk and reward ratios. It includes an RSI and
FREE

The TrendOscillator Indicator is an upgraded version of the traditional Stochastic Oscillator. It comprises two lines: %K and %D. The %K line represents the current market position. In contrast, the %D line is a moving average of the %K line used to generate signals and identify potential entry or exit points. The good thing is the indicator works on all timeframes like the traditional Stochastic. However, to avoid any false signals, applying the indicator on longer timeframes is better
FREE

Trend Multi-Timeframe Dashboard tells you whether the market is going up or down on four timeframes at once, using a fast and a slow exponential moving average on each timeframe. Instead of guessing the direction or flipping through charts, you see the whole picture in one panel. By default it reads the M15, H1, H4 and D1 timeframes, and the settings are fully configurable. Each timeframe is shown in green when the trend is up, red when it is down and grey when it is flat, and the percentage gap
FREE
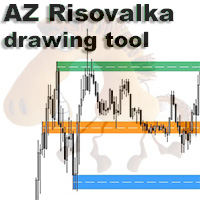
AZ Risovalka levels drawing tool An indicator for simplifying the drawing of levels. Select the indicator mode for the body, shadow, or the whole candle in the settings. Click the 'Draw' button on the drawing panel to create a level, then click on the body or shadow of the candle and select the level color in the color menu that appears. The 'Delete' button to delete level you select, 'Color' to select the color of an already created level. You can set your own colors in the indicator menu (6 co
FREE

Clock GMT Live 拥有您需要了解的有关我们经纪人的所有信息,很多时候您会想知道我现在的格林威治标准时间或我的经纪人正在处理什么格林威治标准时间,使用此工具您将能够实时了解格林威治标准时间和格林威治标准时间 经纪人和你当地时间的时间偏移,你也会不断地知道经纪人的 ping 只需将它放在一天中的某个时间,您就可以获得信息
每次收购价格都会上涨,我们将以此来保护,这样很少有人可以拥有我独特的策略 我的其他开发可以在这里查看
准确的时机可能是交易中的一个关键因素。 目前,伦敦或纽约证券交易所是否已经开市或仍处于关闭状态? 外汇交易的营业时间何时开始和结束? 对于手动交易和实时交易的交易者来说,这不是什么大问题。 使用各种互联网工具、金融工具的规格和时间本身,您可以快速了解何时是根据自己的策略进行交易的正确时间。 对于一些只关注价格走势并在价格走势向他们发出信号时进行买卖的交易者而言,时间本身并不重要。 对于在纽约(股票)市场收盘后和欧盟(股票)市场开盘前进行“夜间剥头皮”交易的交易者,或者专门在“伦敦休市”或其他时间进行交易的交易者而言,情况有所不同 最忙的时候,还是所有买卖
FREE

Quantora Liquidity Zones MT5 is a MetaTrader 5 indicator that displays selected historical price levels and detected Equal High or Equal Low areas on the chart. The indicator plots the previous day, week and month High and Low prices. It also analyzes confirmed price points to identify potential Equal High and Equal Low liquidity zones. Displayed Levels Previous Day High and Low Previous Week High and Low Previous Month High and Low Detected Equal High levels Detected Equal Low levels Optional s
FREE

ICT - FVG • iFVG • BPR Smart Zones - Tjmas is a multi-timeframe institutional PD Array engine for MetaTrader 5. It simultaneously tracks Fair Value Gaps (FVG), Inversion Fair Value Gaps (iFVG), and Balanced Price Ranges (BPR) across M1, M5, M15, M30, H1, H4, and D1 while keeping your candlesticks 100% clean and unobstructed. Key Features: 3-in-1 PD Array Detection: Automatically detects Bullish/Bearish Fair Value Gaps (FVG), Inversion FVGs (iFVG when price displaces through a prior FVG), and ove
FREE
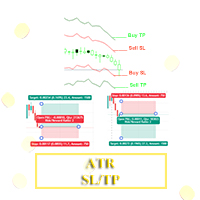
Hello, Traders! I have developed something for traders who uses Average True Range aka ATR value to determine their trade's Stoploss and Takeprofit. With this indicator you can easily set the Takeprofit and Stoploss with the multiplier of your choice.
To use this, kindly adjust the ATR Period to your trading style, then adjust the Stoploss Multiplier and Takeprofit Multiplier accordingly.
Happy Trading. Goodluck and Goodtrading!!!
FREE

Ritz Trinity Scanner – Reversal & RSI Sentiment Ritz Trinity Scanner is a clean and focused reversal detection indicator powered by RSI sentiment analysis and short-term trend validation. The indicator scans price action to identify early bullish and bearish reversal points , filtering signals with RSI overbought/oversold zones and recent market sentiment. Visual arrows highlight potential reversals directly on the chart, while optional alerts, push notifications, and emails keep traders informe
FREE
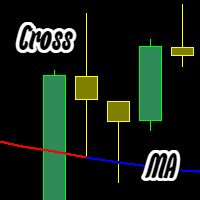
该指标绘制双色移动平均线(MA): 蓝色 — 前一根K线的开盘价和收盘价高于MA线。 红色 — 前一根K线的开盘价和收盘价低于MA线。 可自定义设置: MA类型(简单、指数、平滑、线性); MA周期; MA颜色变化时触发警报。 如有问题,请联系我们修正! bar cross Moving cross candle cross Moving cross bar cross MA cross candle cross MA cross bar cross Moving Average cross candle cross Moving Average cross bar 该指标绘制双色移动平均线(MA): 蓝色 — 前一根K线的开盘价和收盘价高于MA线。 红色 — 前一根K线的开盘价和收盘价低于MA线。 可自定义设置: MA类型(简单、指数、平滑、线性); MA周期; MA颜色变化时触发警报。 如有问题,请联系我们修正!
该指标绘制双色移动平均线(MA): 蓝色 — 前一根K线的开盘价和收盘价高于MA线。 红色 — 前一根K线的开盘价和收盘价低于MA线。
FREE
New Test https://backoffice.aurum.foundation/u/DHXP1U
该指标是基于指标内置的标准指标,该指标考虑到当前指标30个指标 并给出买入或卖出的信号,其他指标的所有趋势的总趋势。 在输入参数中,您可以为每个指标配置特殊参数。 该指标以振荡器的形式执行,并显示所有指标在一个或另一个方向的总趋势和优势。
该指标是基于指标内置的标准指标,该指标考虑到当前指标30个指标 并给出买入或卖出的信号,其他指标的所有趋势的总趋势。 在输入参数中,您可以为每个指标配置特殊参数。 该指标以振荡器的形式执行,并显示所有指标在一个或另一个方向的总趋势和优势。 并显示所有指标在一个或另一个方向的总趋势和优势 。 并显示所有指标在一个或另一个方向的总趋势和优势 。 并显示所有指标在一个或另一个方向的总趋势和优势 。 。 https://youtu.be/UG2ZZEH9B_U
FREE

The Strategies of the World's Most Successful Traders in a Single Indicator Professional Alpha Traders Strategies MT5 is an advanced indicator that compiles the most successful and proven trading methodologies from five legendary traders. This indicator represents decades of experience condensed into a professional tool for real-time opportunity detection. Each strategy has been meticulously programmed following the original rules established by their creators, respecting the trading philosophy
FREE

该指标是TradingView平台"Duyck"开发的"ATR Based Trendlines - JD"指标的MetaTrader 5移植版本。 本指标通过自动持续绘制趋势线运作,其独特之处在于不仅基于价格,还结合ATR反映的波动率。因此趋势线的角度由ATR(的特定百分比)决定。 趋势线角度会跟随价格变化,这种变化由发现枢轴点时的ATR值决定。ATR百分比参数控制趋势线是跟随ATR变化率(100%),还是其分数(<100%)或倍数(>100%)。 输入参数
回溯深度:设定检测枢轴点时需要检查的K线数量
ATR目标百分比:调整趋势线方向上ATR影响的敏感度
依据影线/实体绘制:选择枢轴点和ATR计算使用K线实体还是影线
选择趋势线方向:看涨/看跌/双向
显示全部趋势线开关
最大趋势线数量(当"显示全部趋势线"关闭时)
上升趋势线颜色设置
下降趋势线颜色设置
接收图表提醒
接收应用通知
交易策略指南:
本交易策略结合了我开发的两个指标来确认交易信号——"RC ATR Based Trendlines"和"RC ATR Volatility Hedge Zones"。核心原则是必须两个指
FREE

Session Highlighter and Killzones draws clean colored boxes for the Asia, London and New York trading sessions, plus optional London and New York killzone windows. Time of day is a large part of context in forex, and seeing each session range on the chart explains a lot of what price is doing. Each session box marks the high and the low of that session for the last several days, and the boxes sit behind the candles so the chart stays readable. The session hours are set in server time and are ful
FREE

This indicator automatically draws key weekly and monthly price levels on your chart. All lines end at Sunday 23:59 of the current week. Levels and Default Settings Level Color Style Width Start Point Friday High Red Solid 2 Exact high candle Friday Low Red Solid 2 Exact low candle Friday Close Green Solid 2 23:00 (adjustable) Opening Range High Blue Solid 2 Mon-Tue high candle Opening Range Low Blue Solid 2 Mon-Tue low candle Previous Week High Light Gray DashDotDot 1 Exact high candle Previou
FREE

KS Fibonacci Tool 是一款专为 MetaTrader 5 平台设计的自定义指标,旨在自动识别当前的“聪明钱概念”(SMC)市场结构波段(leg),并实时绘制相应的斐波那契水平线。
核心用途
该指标帮助交易者基于最近一次显著的价格波动(结构波段)直观地查看斐波那契回调和扩展水平,这是 ICT/SMC 交易方法论中的常用手段。
主要功能
自动识别市场结构:
通过追踪波段高点和低点来识别看涨和看跌波段。
支持根据K线实体或K线影线(可配置)来检测结构突破。
实时记录并维护当前结构的高点和低点。
可视化元素:
绘制两条水平线,分别代表当前结构的高点和低点(默认颜色为蓝色)。
在当前波段上绘制最多 5 个可自定义的斐波那契水平线:
默认水平:-0.25、0.0、0.5、1.0、1.25
每个水平线均可独立设置颜色、线型和线宽。
动态特性:
随价格变动实时更新。
当发生结构突破时,指标会自动重置,并针对新波段重新开始绘制斐波那契水平线。
标签同时显示斐波那契比率和精确的价格水平。
FREE
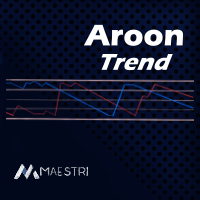
Introducing the Aroon Indicator - Your Ultimate Trend Analysis Tool!
Are you looking to take your trading game to the next level? Want to identify lucrative entry and exit points in the financial markets with ease? Look no further! The Aroon Indicator is here to revolutionize your trading strategy and help you make informed decisions like never before.
Developed by the brilliant mind of Tushar Chande, the Aroon Indicator is a powerful technical analysis tool designed to measure the strength a
FREE

ACTION CHAIN Multi-Engine Confluence & Order Flow Indicator Action Chain is a quantitative signal indicator for MetaTrader 5 built on market structure, volumetric calculations, and order flow mechanics. Rather than relying on a single lagging indicator, Action Chain integrates 6 independent analytical modules into a weighted mathematical confluence matrix. A signal is plotted only when the cumulative weight of active modules meets or exceeds the user-defined threshold. Key Technical Specificatio
FREE

MacD Custom Indicator MTF Plus is a professional MetaTrader 5 port of the original " CM_MacD_Ult_MTF " indicator created by ChrisMoody for TradingView . This version was developed by code4trading for Free provide the MT5 community with high-quality, free access to this proven methodology. Original Concept: ChrisMoody (TradingView) MT5 Development: code4trading Version: 1.0 The Moving Average Convergence Divergence (MACD) is a cornerstone of technical analysis, functioning as a trend-following m
FREE

Get ALERTS for break of your TRENDLINES, SUPPORT LINES, RESISTANCE LINE, ANY LINE!!
1. Draw a line on the chart (Trend, support, resistance, whatever you like) and give it a name (e.g. MY EURUSD line) 2. Load the Indicator and input the Line Name the same name in Indicator INPUT so system knows the name of your line (= MY EURUSD line) 3. Get Alerts when Price breaks the line and closes Works on All Time frames and charts LEAVE A COMMENT AND IF THERE IS ENOUGH INTEREST I WILL WRITE AN EA WHICH W
FREE
A Renko Tick chart based on continuously adjusting percentage.
Live Renko bricks formed by tick data
Adjustable brick width expert for indicator attached Scalp with a Renko, get weird.
The settings can and will break the script if you turn them up too high. Turning off outline mode will not look as nice, but can potentially allow for a larger number of bricks.
FREE

核心优势: 一键保护您的账户。您无需再手动计算手数,也不用盲目猜测会亏损多少。只需移动图表上的线条,面板就会显示精确的手数,让您的风险牢牢掌握在控制之中。 (移动灰色线) 使用方法(只需3步): 设置您的风险: 在参数设置中,选择您想要承担的风险方式:是账户金额的百分比(例如:1%),还是固定金额(例如:$50)。 拖动线条: 图表上会出现 3 条线。用鼠标移动灰色线来调整您的策略: 灰色: 入场价 (Entry Price) 红色: 止损价 (Stop Loss - 您的亏损限制) 绿色: 止盈价 (Take Profit - 您的盈利目标) 复制手数: 查看面板,获取“Lot”数值,然后在 MT5 中手动开仓下单。 面板警报代表什么意思? 面板边缘会改变颜色,以提示您的交易策略是否过于激进: SAFE(绿色): 低风险(小于 1.5%)。一切尽在掌握。 WARNING(黄色): 中度风险(1.5% 至 3%)。请保持谨慎。 DANGER(红色): 高风险(大于 3%)或线条位置错误(例如:把止损位放错了方向)。 重要提示: 本工具仅为计算辅助工具。它不会替您自动开仓下单,而是为您
FREE

ATS Daily Performance 以柱状图和数字在图表上的紧凑面板中显示最近30天每天的盈亏。打开即可一眼看出哪些天赚钱、哪些天亏损,以及本月进展如何。 您将看到 - 每天一根柱:盈利日为绿色,亏损日为红色 - 最近30天的净结果、今天的结果以及未平仓交易的盈亏 - 胜率、盈利天数、盈利因子、最佳日和最差日 - 最近7天的结果列表 - 深色和浅色主题,面板可拖动 工作原理 指标读取您账户的成交历史,并按天汇总盈利、隔夜利息和佣金。日期按经纪商服务器时间。可以统计整个账户或仅统计当前图表品种,也可以不计入隔夜利息和佣金。 指标只读取历史。它从不开仓、修改或平仓,也不需要交易权限。 截图显示的是模拟交易,不是真实或模拟账户。它们展示的是面板,而不是收益。 设置 统计的成交(整个账户 / 图表品种)、是否计入隔夜利息和佣金、显示面板、主题(深色 / 浅色 / 自动)、面板位置。 适用于任何品种和周期。 如果这个工具对您有帮助,欢迎留下简短评价。有问题或功能建议?请在评论中告诉我。 Andy Trading Solutions
FREE
对“ICONIC TRENDLINE SIGNAL”指标的深度解析(中文) 所提供的 MQL5 代码实现了一个面向 MetaTrader 5 的高级多维度顺势指标。它并非简单的均线交叉,而是把趋势强度、波动率、多周期分析与量化评分系统整合为一体,构成完整的决策支持工具。 1. 核心交易策略与逻辑 该指标基于稳健的多层逻辑框架,用于识别高胜率的顺势入场点。 A. 趋势定义:多 EMA 系统 趋势检测的基础是由 5 条指数移动平均线(EMA)构成的高级体系。主图上的“趋势线”采用经典的 EMA 级联(默认 9、21、50),而在后台还会参考更长周期(最高至 200 周期 EMA)以进行更深层的市场分析。 多头趋势(主图) :当 EMA(9) > EMA(21) > EMA(50) 且按“多头顺序”完美排列时,确认强劲上升趋势。这代表短/中/长周期参与者达成一致。 空头趋势(主图) :当 EMA(9) < EMA(21) < EMA(50) 时,定义为空头趋势。 相较于两线交叉,这种级联结构更可靠,因为它要求多个周期同时确认,从而过滤较弱或尚未形成的行情。 B. 趋势确认:ADX 强度过滤
FREE

How to Read EOS AI EOS AI is designed to make its current market assessment easy to understand from one compact dashboard. The panel gives you three main pieces of information:
BUY Probability – the neural model's current bullish assessment SELL Probability – the neural model's current bearish assessment Signal – BUY, SELL or WAIT after the required confirmation rules are applied
The probabilities provide context, while the final signal applies the additional confirmation logic. This means the
FREE

HiLo Ladder 是经典 HiLo 指标 的全新演绎版本。HiLo 指标长期以来被交易者广泛使用,用于识别市场趋势的方向和潜在的反转点。无论是短线交易者还是长期投资者,HiLo 都是帮助他们判断市场节奏的重要工具。 与传统的 HiLo 不同, HiLo Ladder 在图表上的绘制采用阶梯式结构 —— 也就是交易者常说的 “阶梯线” 。这种表现形式不仅在视觉上更直观,而且能够有效地避免连续曲线带来的模糊感。每一段阶梯代表一个清晰的趋势区间,使得价格的上升和下降状态一目了然。 主要优势: 绿色表示价格处于上涨阶段,红色表示下跌阶段,让用户快速区分市场情绪。 阶梯式的走势比传统连线更稳定,减少了噪音干扰。 分析更加直观,无需复杂的解读,新手也能轻松使用。 能够帮助交易者更快地识别趋势变化,尤其是在震荡行情中。 可用作确认入场信号、辅助离场策略或仅作为趋势跟踪工具。 对于希望快速把握市场节奏的交易者来说, HiLo Ladder 提供了一种现代化的方式来解读价格走势。它结合了 HiLo 经典的核心逻辑,同时通过 “阶梯” 视觉效果增强了清晰度和可操作性。在快节奏的市场环境下,它
FREE

Full Description Read Gold’s Complete Picture in One Single Panel Stop switching between M5, M15, H1, H4, and D1 charts. XAU Confluence Matrix Free brings multi-timeframe analysis straight to your main chart in a clean, real-time table. Powered by the quantitative XAU_Engine , this indicator scans 5 timeframes simultaneously on closed candles to give you an accurate directional bias before entering any trade. What You See on Your Screen 5 Timeframes at a Glance: Automatically displays your curre
FREE
Linear Regression Channel (LRC) Indicator – Overview The Linear Regression Channel (LRC) indicator is a professional tool designed to display dynamic price channels around a regression trendline. It automatically adapts to market conditions, helping traders visualize price movement with clarity. Main Features : Regression-based central line with upper/lower channel boundaries. Fully customizable colors, styles, and levels. Optional labels and forward extensions for better chart visualizati
FREE
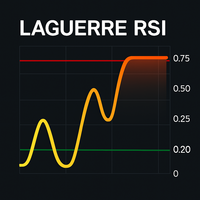
拉盖尔RSI(Laguerre RSI):高级振荡指标 拉盖尔RSI(Laguerre RSI) 是一种基于数字滤波器的高级振荡指标,由 约翰·埃勒斯(John Ehlers) 开发。该指标利用一种称为 拉盖尔滤波器(Laguerre filter) 的技术来平滑价格波动,从而更精确地检测 超买 和 超卖 区域,同时减少市场噪音。 拉盖尔RSI的波动范围在 0到1之间 ,其标准水平如下: 超买: 高于 0.75 超卖: 低于 0.25 该指标是检测 市场转向 、 精确入场点 和 信号确认 的理想选择。 可选功能 拉盖尔RSI包含以下可选功能: 声音、电子邮件或推送警报 关键区域之间的视觉填充 灵活的平滑参数设置( gamma ) 用户手册 可配置参数: 1. 主要配置 gamma (0.1 到 0.9): 控制平滑程度。 较低的值 → 更高的灵敏度,更多的信号。 较高的值 → 更大的平滑度,更少的噪音。 overbought / oversold : 用于标记极端区域的水平。 默认值: overbought = 0.75 oversold = 0.25 2. 视觉外观 mainLine
FREE
MetaTrader 市场 - 在您的交易程序端可以直接使用为交易者提供的自动交易和技术指标。
MQL5.community 支付系统 提供给MQL5.com 网站所有已注册用户用于MetaTrade服务方面的事务。您可以使用WebMoney,PayPal 或银行卡进行存取款。
