Trend Hunter
- 指标
-
Andrey Tatarinov
 Robot for trading on news
https://www.mql5.com/en/market/product/10427
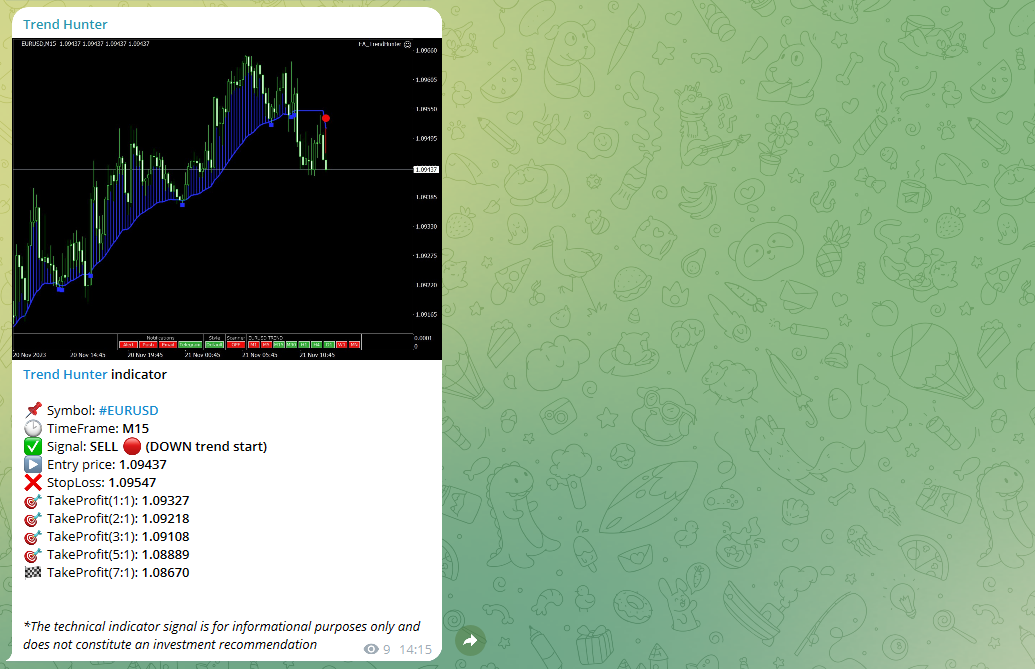
Trend Hunter indicator with the ability to send signals to Telegram - 版本: 3.3
- 更新: 24 十一月 2023
- 激活: 15
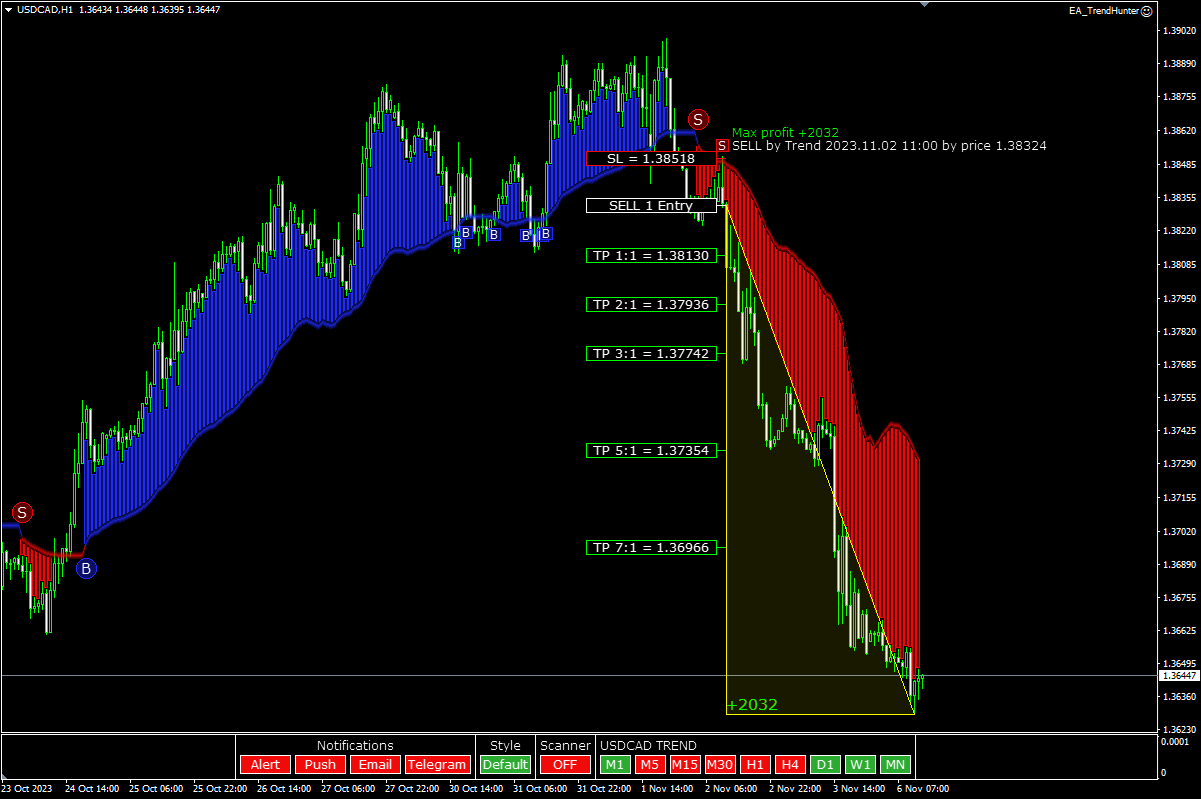
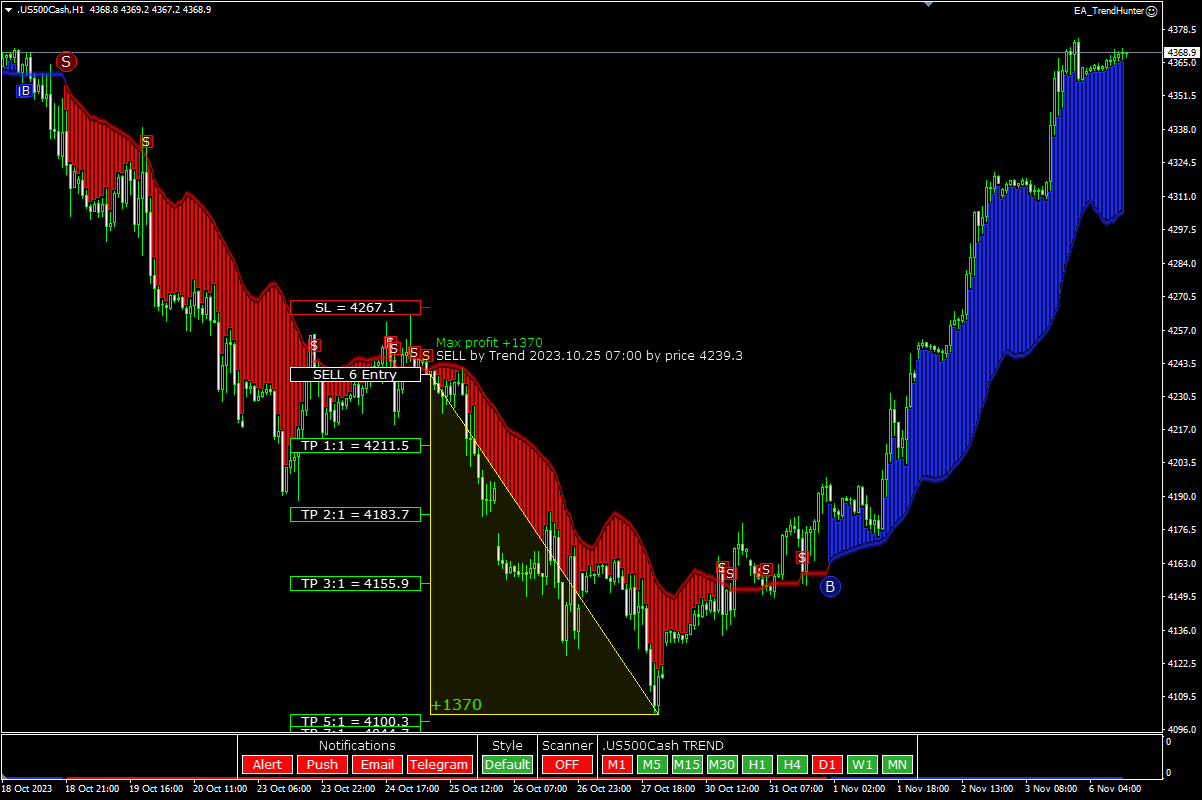
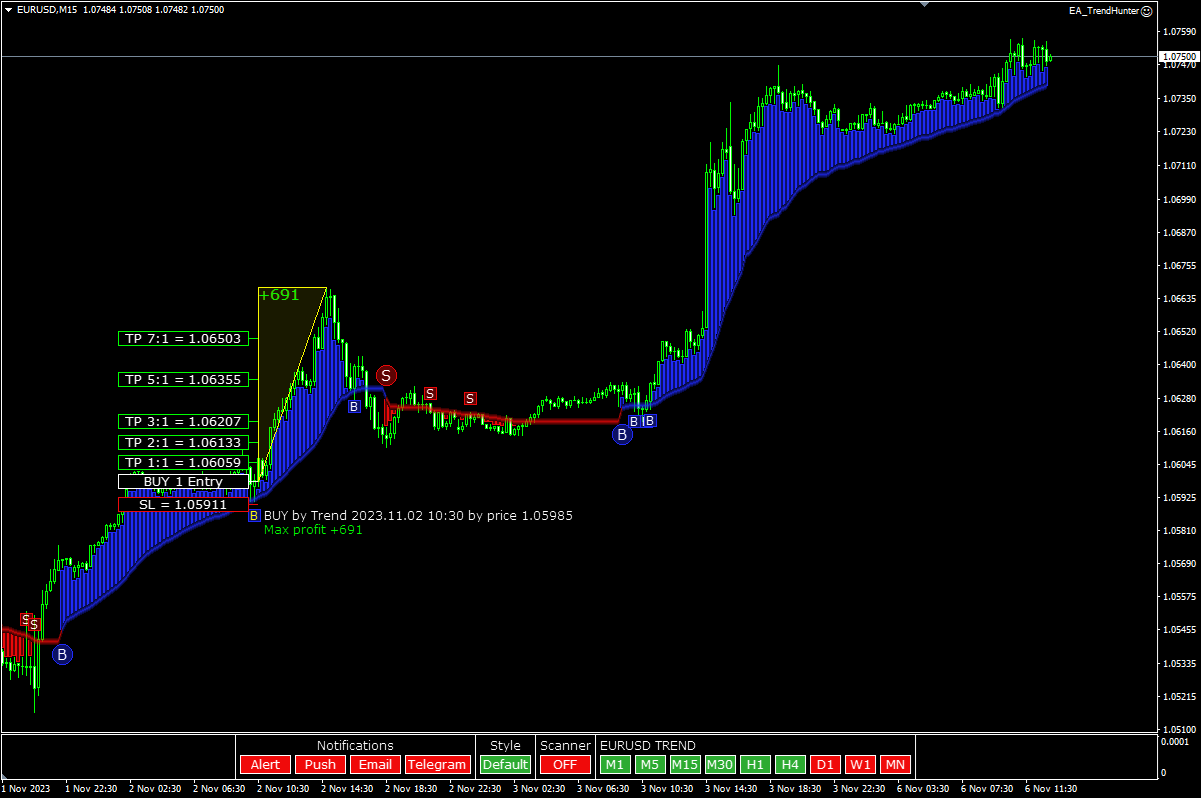
Trend Hunter 是用於外匯市場的趨勢指標。該指標的一個特點是它可以自信地隨趨勢移動,如果價格略微突破趨勢線,則不會改變信號。
指標不重繪,在柱線關閉後出現入市信號。
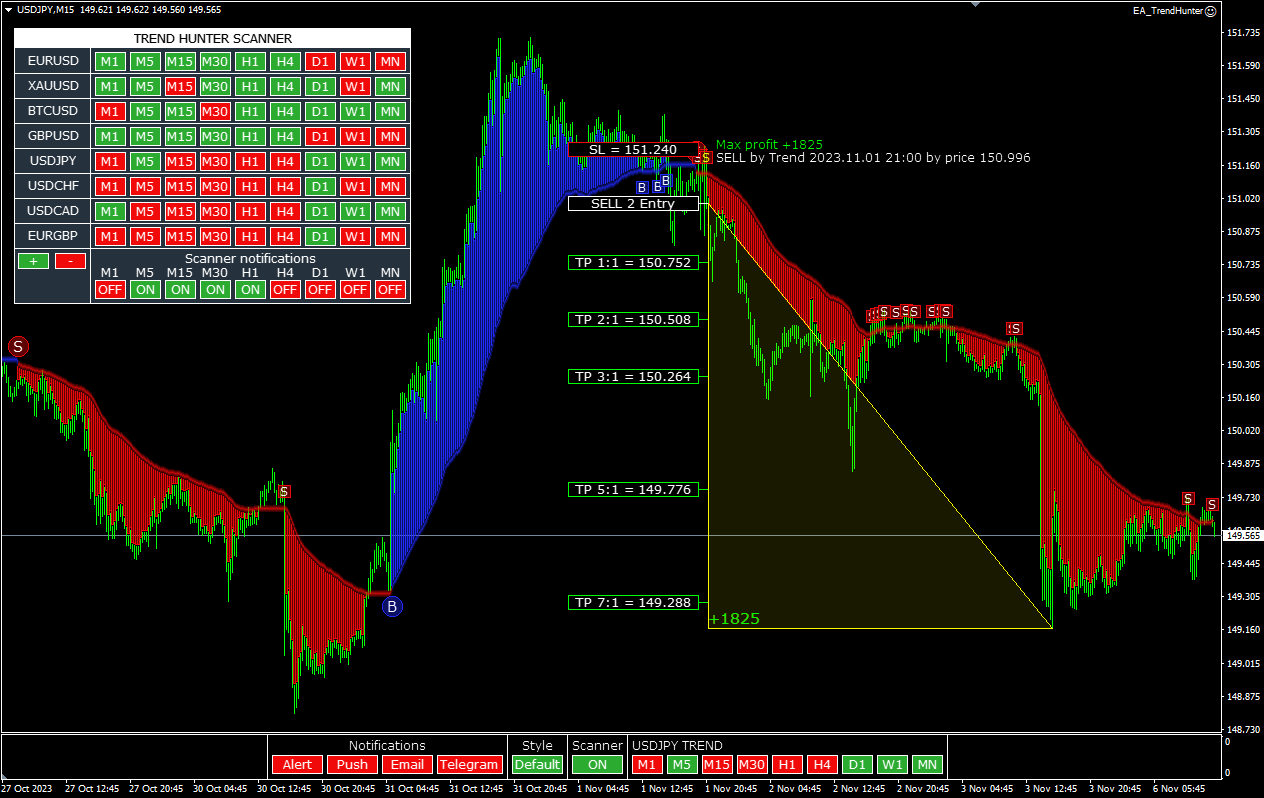
趨勢獵人是一個公平的指標。將鼠標懸停在指標信號上以顯示信號的潛在利潤。
對於使用空頭止損進行交易,當沿著趨勢移動時會提供額外的指標信號。
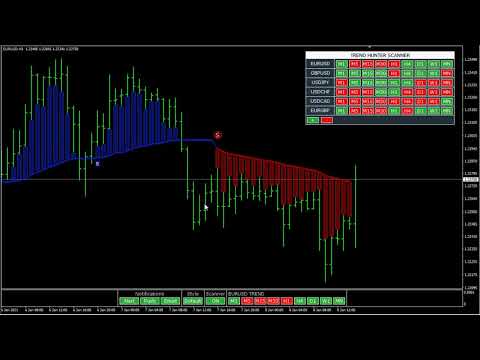
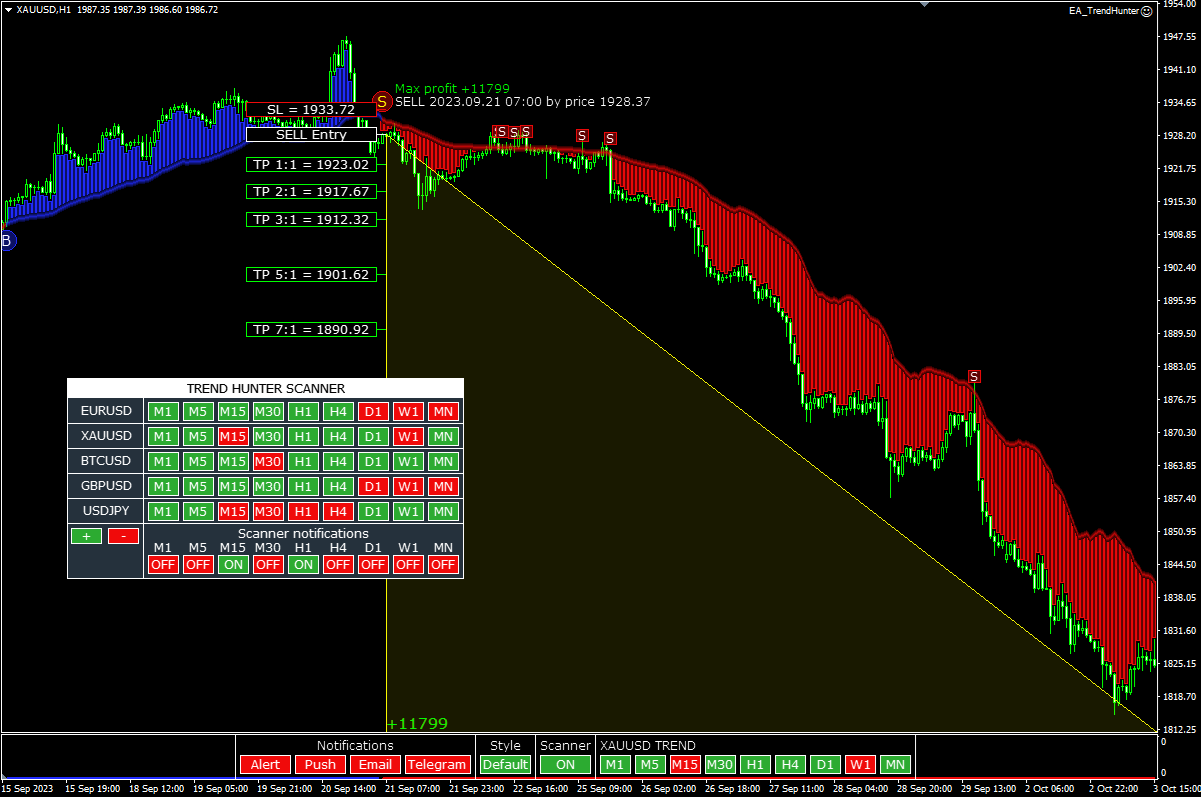
Trend Hunter Scanner 可幫助您評估其他貨幣對和時間範圍內的趨勢方向。
該指標通過位於圖表下方的方便麵板進行控制。
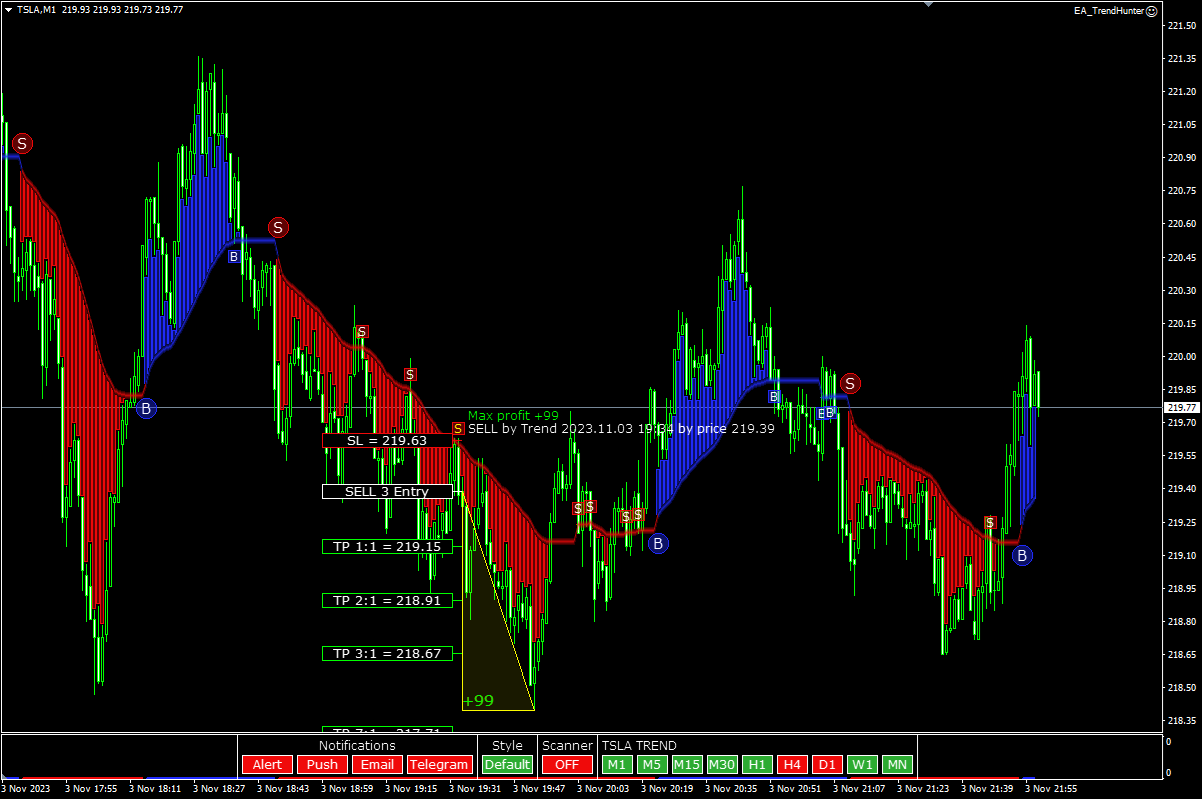
選項
- Alert - 在終端中顯示通知
- EMail - 發送電子郵件通知
- Push - 向智能手機發送推送通知
- Style - 指標繪製樣式
- Scanner - 啟用貨幣對的掃描器
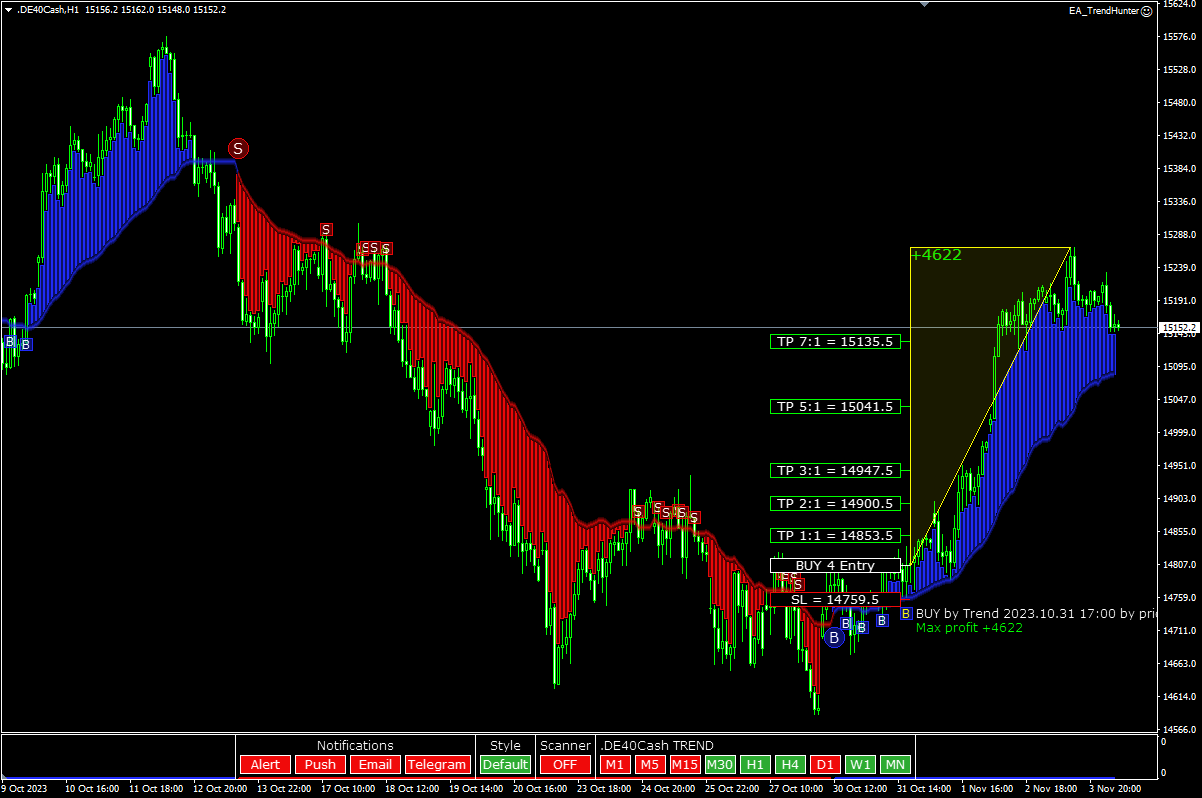
使用額外的指標信號以短期止損進入市場


The problem is that trend changes like the wind. It's a good CCI based trend system. Nice programming too. Congrats. But one need more skills to win from the matket.