
MQL5 简介(第 9 部分):理解和使用 MQL5 中的对象
概述
欢迎回到我们的 MQL5 系列!我们将在本章讨论一个有趣的主题,我相信你会发现它非常有用和引人入胜。我们将开始一个项目,在 MQL5 中使用不同的图表对象,这将是我们未来项目的重要基础。当我们进入更复杂的项目时,比如使用各种谐波模式,这个起点将特别方便。 MQL5 中的图表对象是可以放置在交易图表上的图形元素,可以直观地表示各种类型的数据,包括价格水平、交易区间和文本注释。这些对象为交易者和开发人员提供了创建定制视觉效果的灵活性,从而增强了图表分析,使其更容易识别市场趋势、关键价格水平和交易机会。
MQL5 中提供了不同的图表对象,从基本的线条和形状到复杂的组件,如文本、箭头和自定义指标。通过改变每个对象的颜色、大小、位置和其他属性,可以创建高度定制的交易环境。图表对象不仅仅是装饰性的点缀;它们是生成清晰、可理解的市场数据视觉表示的有效工具。例如,如果用矩形突出显示支撑位和阻力位,那么识别可能的反转点可能会更简单。 通过一个实际项目,本文将向您介绍 MQL5 中图表对象的概念,并向您展示如何使用它们。
我们将在此项目中开发一个 EA 交易,通过在图表上显示清晰的可视化效果来改善交易。EA 将自动显示从入场点到止损和止盈区的路线,为您提供对交易风险和回报的快速视觉评估。在不要求您咨询其他数据源的情况下,EA 将实时更新,以反映您当前的利润或亏损。此外,它将通过显示当前观察头寸的入场价、止损价和止盈价,一目了然地提供准确的信息。
此 EA 对交易设置修改的适应性是其主要特征之一。你的视觉提示将始终是最新的,因为当你修改你的止盈或止损水平时,EA 会立即更新图表。EA 也会根据您的交易时长进行调整。当你持有交易的时间更长时,EA 会逐渐调整自己,使视觉元素变得更加明显。这将使您能够在不同的时段内有效地监控交易,即使在开始时,它们在较高的时段可能不太明显。现在,由于这种动态适应,从较低的时段管理交易并在交易变化时跟踪交易变得更加简单。
EA 可让您检查之前的交易,从而提供深刻的历史分析。它可以帮助您评估您的交易表现,并通过显示您在之前的头寸中赢利或亏损了多少来做出明智的决定。您可以通过定义日期范围直接在图表上查看历史数据。这使您可以全面了解您的交易历史,并可以选择放大特定交易以进行更深入的分析。
当前交易可视化: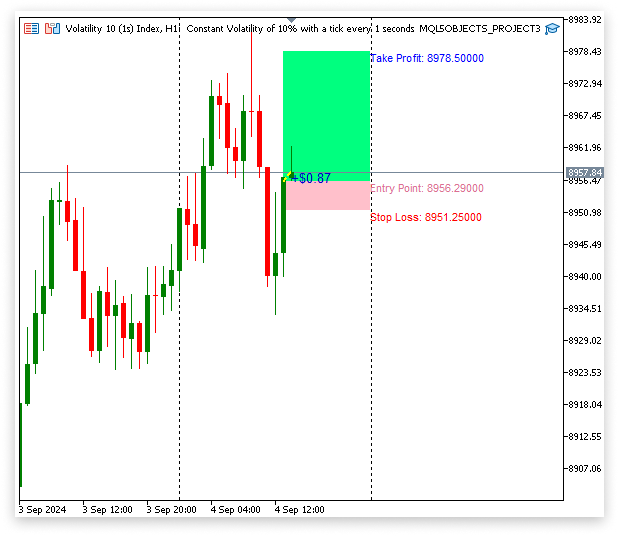
历史交易洞察:
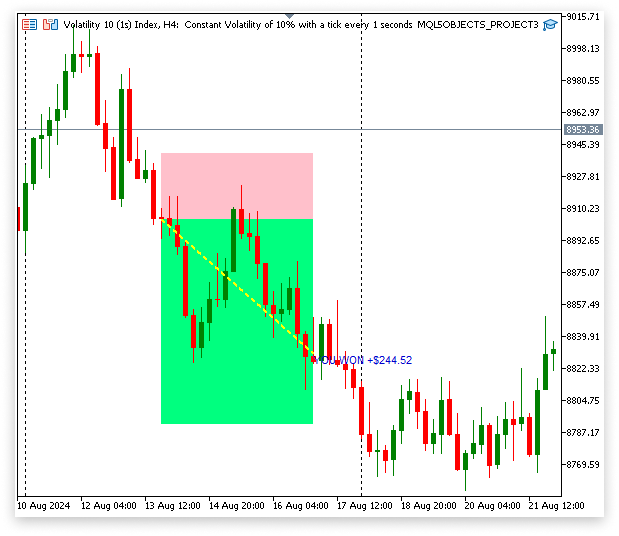
在本文中,您将了解:
- 创建和修改图表对象以增强可视化分析
- 通过头寸循环,在图表上高效管理和显示交易
- 利用历史交易数据通知图表对象的设置
- 在图表上可视化历史交易损益以进行绩效跟踪
- 使用日期时间转换来精确地安排图表对象创建的时间
- 在图表上标注入场点、止盈 (TP) 和止损 (SL) 的详细信息
- 使用输入参数定制您的 EA 交易
本项目旨在让您熟悉 MQL5 中图表对象的有用应用。这种实用方法将教您如何通过有效地集成和修改 EA 交易中的图表对象来管理交易、改进视觉分析以及在图表上显示重要的交易数据。为了帮助您更好地了解如何使用这些工具进行交易决策和绩效跟踪,本项目将引导您完成创建、修改和管理各种图表对象的过程。
1. MQL5 中的图表对象
1.1.什么是图表对象?
MQL5 中的图表对象是可视化组件,交易者可以将其包含在图表中,以改进分析和决策。这些对象可以是更复杂的元素,如通道或箭头,也可以是更简单的形状、线条和文本。图表对象主要用于直观地表示重要数据,帮助交易者计划交易、评估市场状况并跟踪未平仓头寸。图表对象允许您突出显示重要的价格水平,并在图表上绘制指示市场方向的趋势线。通过在图表上可视化这些数据,交易者可以做出明智的交易决策,并快速评估市场状况,而不仅仅依赖于数字数据。
1.2.为什么自定义图表对象很重要?
您可以通过自定义图表对象来提高交易图表的视觉清晰度,并帮助自己做出更好的决策。通过更改这些对象的颜色、大小或位置,您可以使图表更适合您的交易偏好和风格。您可以使用此自定义功能,通过强调最重要的信息,使其一目了然。
如果你的注意力集中在支撑位和阻力位上,你可能想使用大胆、粗的线条,这些线条以鲜艳的颜色突出,即使在快速扫描图表时也很容易看到。这样做可以降低在繁忙的交易时段忽视关键信号的机会。与此类似,使文本注释更加突出可以作为一种视觉提示,帮助您记住重要的交易决策或计划中的策略。
1.3.我们将在项目中使用的图表对象
本项目将使用几个重要的 MQL5 图表对象来改进我们的交易分析。我们将使用的图表对象如下:
1.3.1.趋势线
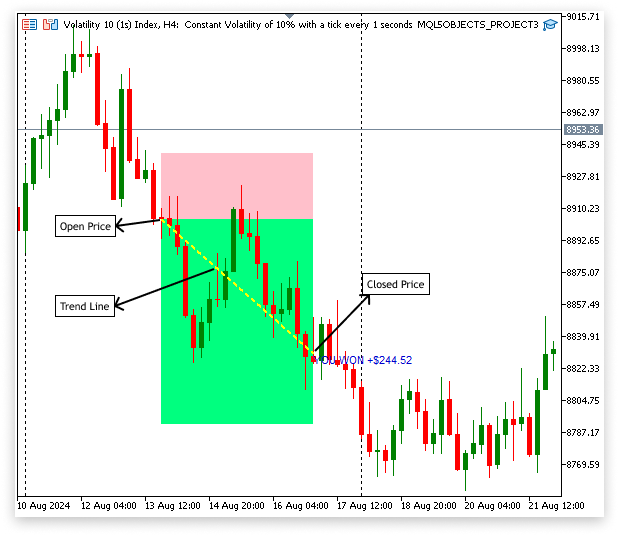
我们项目中的一个重要工具是趋势线,它主要用于跟踪与重要趋势水平相关的当前市场价格,并确定切入点。为了确定市场的总体方向,我们将在重要价格点之间画一条趋势线。 随着市场价格的变化(或“分时报价”),趋势线会实时更新,因此它会从最初的入场价格不断延伸到最近的市场价格。
这确保了趋势线始终反映最新的价格数据,有助于准确跟踪交易表现并做出管理头寸的决策。趋势线通常从进场头寸的价格开始,反映了交易的起点。该线延伸到当前市场价格或要价。这显示了自交易开始以来价格的走势。
1.3.2.文本标签
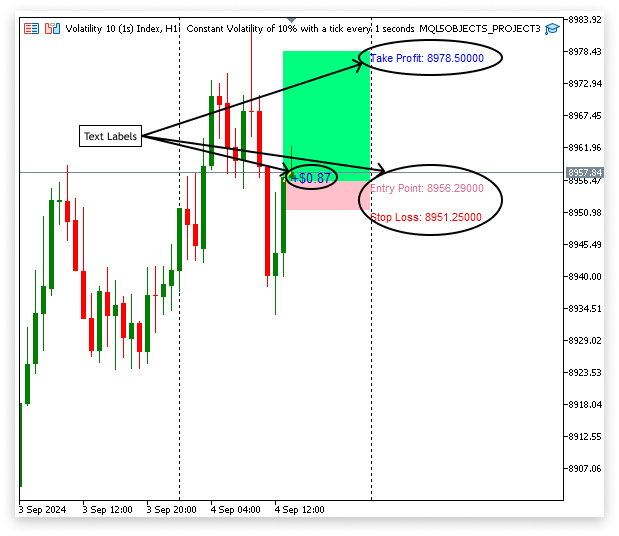
正如图表上的评论所示,文本标签提供了关于交易不同方面的清晰、可理解的细节。重要信息,如出场点、止损水平、止盈目标以及交易策略的任何其他相关说明,都可以显示在上面。通过在图表的重要区域添加文本标签,您可以轻松检索重要信息,而无需使用外部笔记或您的记忆。这种视觉辅助工具使您在做出决策时更容易掌握所需的所有信息。
每个分时都会出现一个文本标签,指示未平仓头寸的当前损益。通过此实时更新,您可以在市场变动时关注他们的交易表现,并立即了解交易是否朝着正确的方向发展。通过在交易旁边加上诸如 +$100 或 -$50 之类的标签,当前的利润或亏损将随着市场的变化而实时显示。这使您能够监控交易的表现并做出必要的调整。
1.3.3.矩形对象
矩形对象可用于指示图表上的支撑位和阻力位等。但在这个项目中,它们的使用将仅限于识别交易中的盈亏区域。当某个仓位目前处于亏损状态时,我们会从入场点到止损位画一个矩形。这有助于我们通过直观地表示交易向负方向发展的区域,快速识别头寸何时接近止损。一旦仓位盈利,就会从入场点到获利水平绘制一个矩形。通过突出显示表现良好的区域,这有助于我们跟踪交易朝着止盈目标的进展。
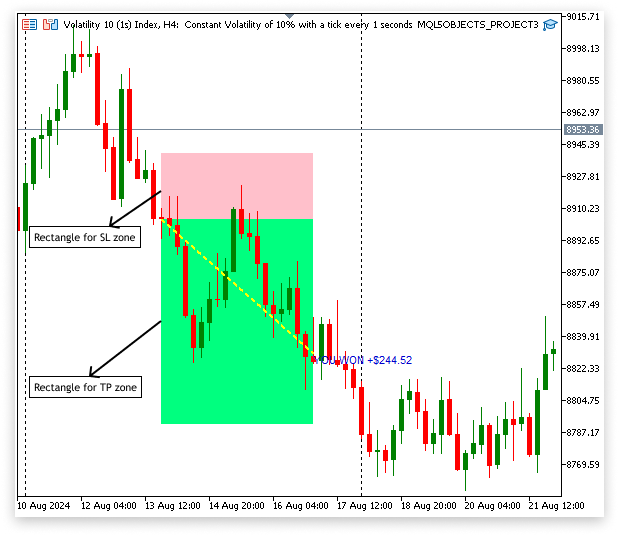
MQL5 中提供了许多不同的图表对象,每个对象都旨在以特定的方式改进交易分析。不过,如果在一篇文章中涵盖所有这些项目,那就太多了。因此,我将重点缩小到我们项目中使用的对象上。 这些选定的对象,包括矩形、趋势线和文本标签,不仅对此特定策略至关重要,而且具有与其他 MQL5 对象相当的创建和修改过程。通过掌握这些特定对象的概念和策略,您将获得在 MQL5 中使用各种图表对象所需的基本知识,使用类似的方法根据您的交易需求创建和修改它们。
2.创建和自定义对象
在本节中,我们将专注于在 MQL5 中创建和修改不同的图表对象。将演示如何创建矩形、趋势线和文本标签等对象,以及如何调整它们的颜色、样式和宽度以适应您的交易计划。
2.1.伪代码
在这个项目中,伪代码是必不可少的,因为在编写任何代码之前,它提供了一个组织良好、简洁的总结,总结了实现我们目标所需的推理和过程。它有助于将困难的任务分解为更小、更易于管理的组件,这有助于规划,帮助发现可能的问题,并保证我们编写的代码高效且组织良好。伪代码使我们能够可视化 EA 交易系统的整个流程,从而更容易实现图表对象和其他功能。
这是我们的 EA 的基本伪代码:
1.初始化:
- 定义 SL 区域、TP 区域和趋势线的颜色。
- 设置仓位索引。
- 指定是否显示历史数据。
- 定义历史数据的开始和结束日期。
- 设置关闭区域的时间。
- 获取当前图表 ID。
- 初始化用于存储仓位详细信息的变量(开仓价、止损、止盈、利润、开仓时间)。
2. 每次分时报价时:
- 将字符串格式时间转换为关闭区域的日期时间对象。
- 获取当前卖价。
- 循环遍历所有仓位。
- 获取该仓位的编号。
- 检查仓位是否与图表交易品种匹配。
- 获取详细信息:开盘价、止损、获利、开盘时间和利润。
- 如果仓位与指定索引匹配。
- 创建并配置 SL 区域矩形。
- 设置属性(颜色、样式、宽度、填充)。
- 创建并配置 TP 区域矩形。
- 设置属性(颜色、样式、宽度、填充)。
- 创建并配置趋势线。
- 设置属性(颜色、样式、宽度)。
- 计算并显示持仓利润。
- 将利润格式化并显示为文本。
- 为入场点、TP 和 SL 创建并配置文本对象:
- 设置属性(颜色、字体大小)。
3.如果启用了历史数据显示:
- 清除之前的评论。
- 选择并循环浏览指定日期范围内的历史交易:
- 获取每笔交易的详细信息(开盘价、收盘价、止损价、止盈价、利润、时间)。
- 显示盈利/亏损信息。
- 创建并配置止损区域、止盈区域和历史交易的趋势线:
- 设置属性(颜色、样式、宽度)。
2.2.实际应用:创建和自定义对象
2.2.1 创建图表对象
MQL5 中一个重要的工具可以让您在交易图表上创建不同类型的对象,那就是 ObjectCreate() 函数。这些对象包括趋势线、矩形、文本标签、箭头等,可以帮助交易者更好地可视化市场数据、分析趋势并在图表上标记重要点。
超越创造:指定对象放置
您不仅可以使用 ObjectCreate() 在图表上创建对象,而且它的参数还可以让您精确控制这些对象的显示位置。通过将这些对象放置在图表上的特定位置并指定特定参数,您可以定位并提高分析的有效性。时间和价格是决定项目在图表上放置位置的两个主要因素。这些元素充当图表上特定位置的对象的锚点。
语法:
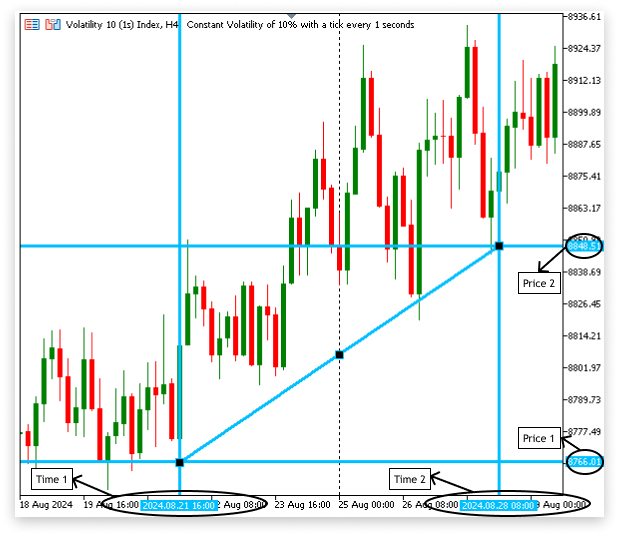
ObjectCreate(chart_id, object_name, object_type, sub_window, time1, price1, time2, price2, time3, price3);对象放置中时间与价格的关系
MQL5交易图表上的每个点都是由价格(纵轴)和时间(横轴)的相互作用决定的。当您使用 ObjectCreate 创建对象时,这两个维度用于指定对象在图表上的确切位置
理解锚点:time1, price1, time2, price2, time3, price3
使用 ObjectCreate() 创建对象时,通常需要定义一个或多个锚点。对象在图表上的精确位置由这些锚点确定。这些锚点分别是参数 time1、price1、time2、price2、time3、price3。
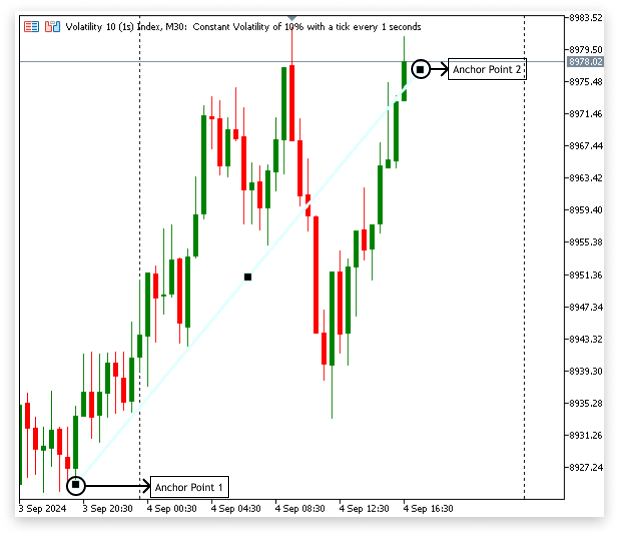
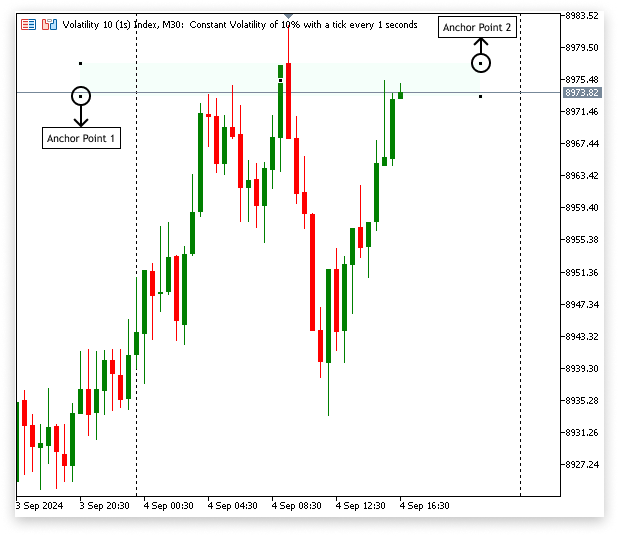
- time1 和 price1: 这些参数确定了对象的初始锚点。例如,如果您正在绘制趋势线,time1 将指示起点的时间(例如特定的蜡烛图),price1 将指示该点的价格水平。
- time2 和 price2: 指定对象的第二个锚点。这将是趋势线示例中线的端点。Price2 表示该时刻的价格水平,time2 表示第二个点的时间。
time3,price3: 对于某些更复杂的对象(例如通道或三角形),第三个锚点是必要的。您可以使用 time3 和 price3 指定第三个点,这在绘制需要三个坐标的某些形状时可能是必需的。
// Get the ID of the current chart
long chart_id = ChartID();

//+------------------------------------------------------------------+
//| Script program start function                                    |
//+------------------------------------------------------------------+
void OnStart()
  {
// Define the first anchor point for the trendline
// 'time1' is the datetime for the first point, and 'price1' is the price at that time
   datetime time1  = D'2024.08.21 16:00';
   double   price1 = 8766.01;

// Define the second anchor point for the trendline
// 'time2' is the datetime for the second point, and 'price2' is the price at that time
   datetime time2  = D'2024.08.28 08:00';
   double   price2 = 8854.51;

// Create a trendline object on the chart
// 'chart_id' is the ID of the chart where the object will be placed
// "Trend Line" is the name of the trendline object
// 'OBJ_TREND' specifies that the object is a trendline
// The last four parameters (0, time1, price1, time2, price2) specify the anchor points of the trendline
   ObjectCreate(chart_id, "Trend Line", OBJ_TREND, 0, time1, price1, time2, price2);
  }
输出:
文本标签(OBJ_TEXT)只需一个锚点即可定位在图表上。锚点根据提供的价格和时间坐标指示文本的位置。图表上的文本标签,在特定时刻和价格处显示“在这里购买”。
示例:
// Get the ID of the current chart
long chart_id = ChartID();

//+------------------------------------------------------------------+
//| Script program start function                                    |
//+------------------------------------------------------------------+
void OnStart()
  {
// Define the time for the text label's position (August 21, 2024, at 16:00)
   datetime time1  = D'2024.08.21 16:00';

// Define the price level for the text label's position (8766.01)
   double   price1 = 8766.01;

// Create a text object named "Text" on the chart at the specified time and price
   ObjectCreate(chart_id, "Text", OBJ_TEXT, 0, time1, price1);

// Set the text content of the object to display "Buy Here"
   ObjectSetString(chart_id, "Text", OBJPROP_TEXT, "Buy Here");
  }
输出:
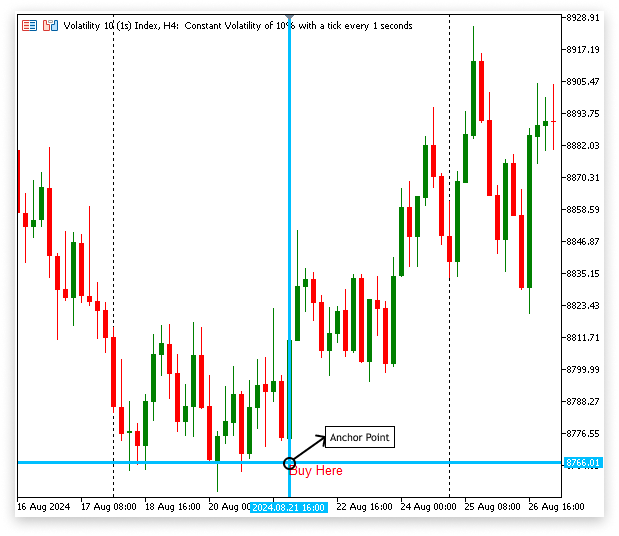
2.3.自定义对象
您可以自定义图表对象的视觉组件以适应您的交易风格。令您高兴的是,您还可以修改它们的大小、颜色和风格。例如,为了使趋势线从图表上的其他元素中脱颖而出,您可以更改其颜色、粗细和位置,以确保它们与重要的市场水平相匹配。 同样,可以通过更改字体和配色方案来更改文本标签,以引起人们对利润目标或切入点等关键细节的关注。
示例:
// Define the time for the text label's position (August 21, 2024, at 16:00)
datetime time1  = D'2024.08.21 16:00';

// Define the price level for the text label's position (8766.01)
double   price1 = 8766.01;

// Create a text object named "Text" on the chart at the specified time and price
ObjectCreate(chart_id, "Text", OBJ_TEXT, 0, time1, price1);

// Set the text content of the object to display "Buy Here"
ObjectSetString(chart_id, "Text", OBJPROP_TEXT, "Buy Here");

// Set the color of the text object to Medium Blue
ObjectSetInteger(chart_id, "Text", OBJPROP_COLOR, clrMediumBlue);
此代码显示文本“在此购买”,在给定的时间和价格向图表添加文本标签,并将文本的颜色更改为中蓝色。
输出:
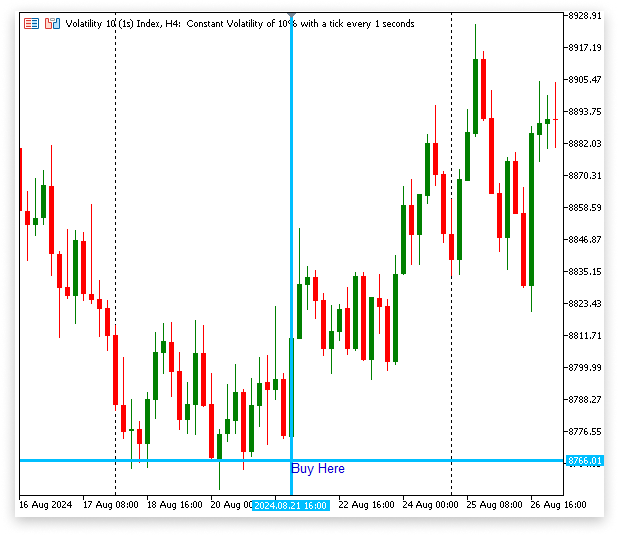
2.3.1.用于在 MQL5 中自定义图表对象的对象函数
可以利用各种对象函数来自定义 MQL5 中的图表对象。借助这些函数,您可以改变图表对象的外观、感觉和位置,以更好地满足您独特的交易需求。
用于设置图表对象的整数类型属性,如颜色、宽度和样式。
示例:// Get the ID of the current chart long chart_id = ChartID(); //+------------------------------------------------------------------+ //| Script program start function | //+------------------------------------------------------------------+ void OnStart() { datetime time1 = D'2024.08.21 16:00'; double price1 = 8766.01; // Define the second anchor point for the trendline // 'time2' is the datetime for the second point, and 'price2' is the price at that time datetime time2 = D'2024.08.28 08:00'; double price2 = 8854.51; // Create a trend line object on the chart with the name "Trend Line" // The trend line will be drawn from time1/price1 to time2/price2 ObjectCreate(chart_id, "Trend Line", OBJ_TREND, 0, time1, price1, time2, price2); // Set the style of the trend line to a dashed line ObjectSetInteger(chart_id, "Trend Line", OBJPROP_STYLE, STYLE_DASH); // Set the width of the trend line to 2 ObjectSetInteger(chart_id, "Trend Line", OBJPROP_WIDTH, 2); }
输出:
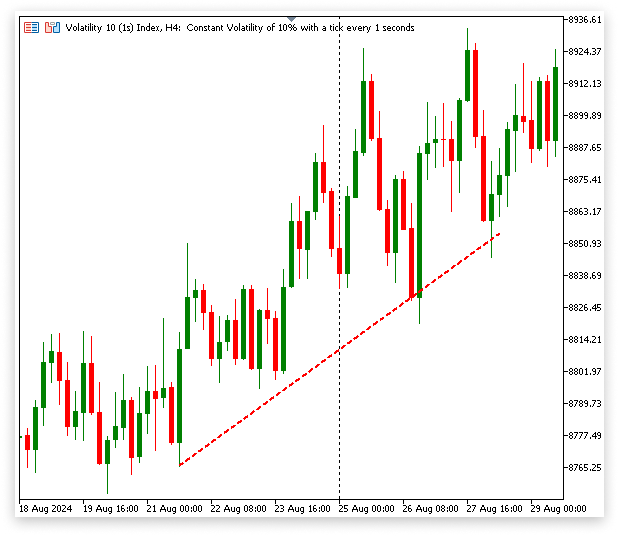
设置双精度型属性,通常涉及价格或时间。 示例:调整趋势线上锚点的坐标。
用于设置字符串类型的属性,例如文本标签显示的文本。
示例: 直接在图表上添加注释或备注。
// Create a text object named "Text" on the chart at the specified time and price
ObjectCreate(chart_id, "Text", OBJ_TEXT, 0, time1, price1);

// Set the text content of the object to display "Buy Here"
ObjectSetString(chart_id, "Text", OBJPROP_TEXT, "Buy Here");
不同类型的图表对象可用于使用 MQL5 中提供的各种对象函数进行构建、自定义和管理。这些函数对于改善交易数据在图表上的直观显示方式至关重要。ObjectCreate 和 ObjectSetInteger 是我们在项目中讨论过的两个重要函数,但还有很多。 您可以查看 MQL5 文档,其中提供了所有可用图表函数的详细信息,以便更深入地了解其他函数。
3.在我们的项目中实现图表对象
3.1.为当前仓位创建图表对象
本节将集中介绍如何配置图表对象来处理和呈现有关图表上当前仓位的数据。为了直观地呈现实时交易数据,这需要创建和修改矩形、趋势线和文本标签。
3.1.1.使用矩形突出显示区域
我们将使用两个不同的矩形来直观地强调图表上设置止损(SL)和止盈(TP)水平的关键区域。这些矩形将动态表示 SL 和 TP 区域,因此您可以轻松地一目了然地关注风险和回报水平。
a.突出显示 SL 区域:
- 锚点 1:SL 区域矩形的第一个锚点将放置在交易的入场价格和开仓的确切时间。
- 锚点 2:第二个锚点将以 SL 价格定位,并水平延伸至当天 23:59。此扩展确保矩形每天动态更新,扩展到视觉上覆盖 SL 区域,直到交易结束或当天结束。
- 目的:此矩形标记图表上的风险区域,使您能够快速确定当前价格与 SL 水平的接近程度。
b.突出显示 TP 区域:
- 锚点 1:TP 区域矩形的第一个锚点也将从交易的入场价开始。
- 锚点 2:第二个锚点水平延伸至当日23:59,将定位在当前仓位的目标价位。与 SL 区域一样,潜在的奖励区域每天都会被这个不断扩大的矩形不断突出显示。
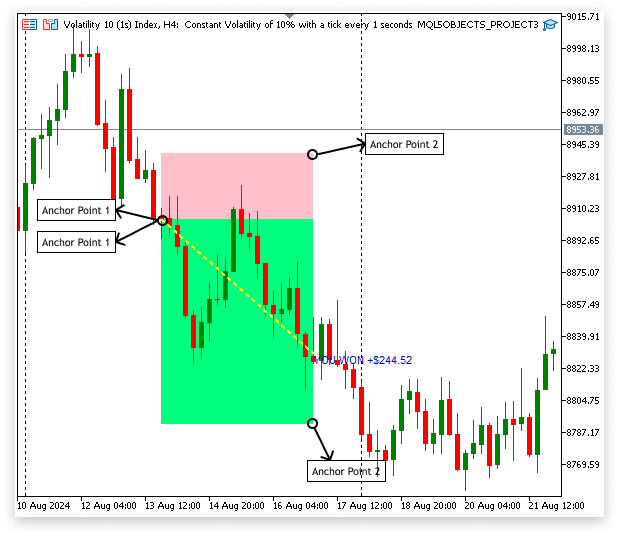
只有在我们以编程方式检索每个仓位的必要信息后,才能制作突出显示 SL 和 TP 区域的矩形。这包括开盘价、止损(SL)水平、止盈(TP)水平以及交易开启时间。我们通过以编程方式获取这些值,确保矩形在图表上处于适当的位置,并与每个仓位的适当级别和时间相匹配。得益于这种自动化方法,矩形还可以动态更新新的位置,使视觉表示始终保持最新和相关。
示例:
// Variables to store position details
double open_price;          // Variable to store the entry price of the position
double stop_loss;           // Variable to store the Stop Loss level of the position
double take_profit;         // Variable to store the Take Profit level of the position
datetime position_open_time; // Variable to store the open time of the position

//+------------------------------------------------------------------+
//| Expert tick function                                             |
//+------------------------------------------------------------------+
void OnTick()
  {
// Loop through all open positions
   for(int i = 0; i < PositionsTotal(); i++)
     {
      // Get the ticket number of the position at index 'i'
      ulong ticket = PositionGetTicket(i);

      // Retrieve and store the entry price of the position
      open_price = PositionGetDouble(POSITION_PRICE_OPEN);

      // Retrieve and store the Stop Loss level of the position
      stop_loss = PositionGetDouble(POSITION_SL);

      // Retrieve and store the Take Profit level of the position
      take_profit = PositionGetDouble(POSITION_TP);

      // Retrieve and store the open time of the position
      position_open_time = (int)PositionGetInteger(POSITION_TIME);

      // Print the retrieved values for debugging or verification
      Print("Open Price index ",i,": ",open_price);
      Print("SL index ",i,": ",stop_loss);
      Print("TP index ",i,": ",take_profit);
      Print("Open time index ",i,": ",position_open_time);
     }
  }
解释:
每次交易工具的价格变动或变化时,OnTick 函数就会运行代码。检索有关交易账户中每个未平仓头寸的重要信息。交易账户中的所有未平仓头寸都要循环检索。PositionsTotal() 函数根据总持仓列表中每个持仓的索引返回有关每个持仓的具体信息。使用 PositionGetDouble 和 PositionGetInteger 函数来检索这些详细信息。为了调试或验证,在将任何视觉元素添加到图表之前,将检索到的数据打印到终端,例如突出显示 SL 和 TP 区域的矩形。这保证了收集准确的数据。
当前的实现将出现两个问题:
- 确定确切仓位:目前,EA 并不知道它正在循环哪个精确仓位来获取时间和价格数据。这意味着当我们只想获取特定仓位的信息时,代码将从所有未平仓位提取数据,这可能会导致混乱或使用不正确的数据。
- 图表工具的特定数据:正在检索的信息需要与图表上当前显示的工具的未平仓头寸和交易相关。如果图表上的交易品种没有被过滤掉,EA 可以从与当前图表无关的其他工具的仓位提取数据,这可能会导致不准确或具有欺骗性的视觉表现。
提供一个输入参数,让用户可以选择他们希望从哪个仓位索引检索数据,这是解决此问题的方法。有了这些信息,EA 将能够专注于用户正在寻找的特定角色。代码还应确保所选仓位与图表上当前可见的工具相匹配,以保证仅使用相关数据进行视觉表示。
示例:
// Variables to store position details
double open_price;          // Variable to store the entry price of the position
double stop_loss;           // Variable to store the Stop Loss level of the position
double take_profit;         // Variable to store the Take Profit level of the position
datetime position_open_time; // Variable to store the open time of the position

// Define the position index for the first position
input int position_index  = 0; // POSITION INDEX (Index starts from 0)

// Get the ID of the current chart
long chart_id = ChartID();


//+------------------------------------------------------------------+
//| Expert tick function                                             |
//+------------------------------------------------------------------+
void OnTick()
  {


// Loop through all open positions
   for(int i = 0; i < PositionsTotal(); i++)
     {
      // Get the ticket number of the position at index 'i'
      ulong ticket = PositionGetTicket(i);

      if(PositionGetInteger(POSITION_TICKET) == PositionGetTicket(position_index) && PositionGetString(POSITION_SYMBOL) == ChartSymbol(chart_id))
        {

         // Retrieve and store the entry price of the position
         open_price = PositionGetDouble(POSITION_PRICE_OPEN);

         // Retrieve and store the Stop Loss level of the position
         stop_loss = PositionGetDouble(POSITION_SL);

         // Retrieve and store the Take Profit level of the position
         take_profit = PositionGetDouble(POSITION_TP);

         // Retrieve and store the open time of the position
         position_open_time = (int)PositionGetInteger(POSITION_TIME);

         // Print the retrieved values for debugging or verification
         Print("Open Price index ",i,": ",open_price);
         Print("SL index ",i,": ",stop_loss);
         Print("TP index ",i,": ",take_profit);
         Print("Open time index ",i,": ",position_open_time);

        }
     }

  }
该算法迭代每个未平仓头寸,确定其是否与所选索引和图表交易品种相对应,然后获取相关信息。 现在,在成功检索给定仓位的价格和时间数据后,我们可以制作两个矩形来指示 SL(止损)和 TP(止盈)区域。为了保证这些矩形能够恰当地描绘图表上的 SL 和 TP 区域,获取的数据将用作 ObjectCreate() 函数的输入参数。
示例:// Variables to store position details double open_price; // Variable to store the entry price of the position double stop_loss; // Variable to store the Stop Loss level of the position double take_profit; // Variable to store the Take Profit level of the position datetime position_open_time; // Variable to store the open time of the position // Define the position index for the first position input int position_index = 1; // POSITION INDEX (Index starts from 0) // Get the ID of the current chart long chart_id = ChartID(); // Store the ID of the current chart string time = "23:59"; // Define a specific time as a string // Define the color for the losing zone input color sl_zonez_color = clrPink; // Choose a color for Losing Zone // Define the color for the winning zone input color tp_zonez_color = clrSpringGreen; // Choose a color for Winning Zone //+------------------------------------------------------------------+ //| Expert tick function | //+------------------------------------------------------------------+ void OnTick() { // Convert the string time to datetime datetime close_zone = StringToTime(time); // Loop through all open positions for(int i = 0; i < PositionsTotal(); i++) { // Get the ticket number of the position at index 'i' ulong ticket = PositionGetTicket(i); // Check if the position matches the specified index and symbol of the current chart if(PositionGetInteger(POSITION_TICKET) == PositionGetTicket(position_index) && PositionGetString(POSITION_SYMBOL) == ChartSymbol(chart_id)) { // Retrieve and store the entry price of the position open_price = PositionGetDouble(POSITION_PRICE_OPEN); // Retrieve and store the Stop Loss level of the position stop_loss = PositionGetDouble(POSITION_SL); // Retrieve and store the Take Profit level of the position take_profit = PositionGetDouble(POSITION_TP); // Retrieve and store the open time of the position position_open_time = (int)PositionGetInteger(POSITION_TIME); // Print the retrieved values for debugging or verification Print("Open Price index ",i,": ",open_price); Print("SL index ",i,": ",stop_loss); Print("TP index ",i,": ",take_profit); Print("Open time index ",i,": ",position_open_time); // Create a rectangle to represent the Stop Loss (SL) zone on the chart ObjectCreate(chart_id, "SL Zone", OBJ_RECTANGLE, 0, position_open_time, open_price, close_zone, stop_loss); // Create a rectangle to represent the Take Profit (TP) zone on the chart ObjectCreate(chart_id, "TP zone", OBJ_RECTANGLE, 0, position_open_time, open_price, close_zone, take_profit); // Set properties for the SL zone rectangle ObjectSetInteger(chart_id, "SL Zone", OBJPROP_COLOR, sl_zonez_color); // Set color to the selected SL zone color ObjectSetInteger(chart_id, "SL Zone", OBJPROP_STYLE, STYLE_SOLID); // Set style to solid ObjectSetInteger(chart_id, "SL Zone", OBJPROP_WIDTH, 1); // Set the width of the rectangle border ObjectSetInteger(chart_id, "SL Zone", OBJPROP_FILL, sl_zonez_color); // Fill the rectangle with the selected SL zone color ObjectSetInteger(chart_id, "SL Zone", OBJPROP_BACK, true); // Set the rectangle to appear behind the chart objects // Set properties for the TP zone rectangle ObjectSetInteger(chart_id, "TP zone", OBJPROP_COLOR, tp_zonez_color); // Set color to the selected TP zone color ObjectSetInteger(chart_id, "TP zone", OBJPROP_STYLE, STYLE_SOLID); // Set style to solid ObjectSetInteger(chart_id, "TP zone", OBJPROP_WIDTH, 1); // Set the width of the rectangle border ObjectSetInteger(chart_id, "TP zone", OBJPROP_FILL, tp_zonez_color); // Fill the rectangle with the selected TP zone color ObjectSetInteger(chart_id, "TP zone", OBJPROP_BACK, true); // Set the rectangle to appear behind the chart objects } } }
解释:
此代码获取每个仓位的开仓时间、止损、止盈和开仓价格。它使用这些信息在图表上绘制两个可见的矩形:一个表示可能的亏损区域,另一个表示潜在的盈利区域。另一方面,未能指定 TP 或 SL 水平可能会导致这些矩形的锚点出现问题,从而影响它们在图表上的位置或显示方式。为了保证准确的可视化,我将实现代码来纠正这种行为。
if(stop_loss > 0)
  {
// Create a rectangle to represent the Stop Loss (SL) zone on the chart
   ObjectCreate(chart_id, "SL Zone", OBJ_RECTANGLE, 0, position_open_time, open_price, close_zone, stop_loss);
  }


if(take_profit > 0)
  {
// Create a rectangle to represent the Take Profit (TP) zone on the chart
   ObjectCreate(chart_id, "TP zone", OBJ_RECTANGLE, 0, position_open_time, open_price, close_zone, take_profit);
  }
解释:
在图表上创建相应的矩形之前,代码片段会验证止损和止盈水平是否大于零。如果设置了 SL(即大于0),则绘制一个矩形代表 SL 区域,标记潜在的亏损区域;如果设置了 TP,则创建另一个矩形代表 TP 区域,标明潜在的盈利区域。通过防止创建具有无效锚点的矩形,这些检查可确保图表可视化的准确性。
输出: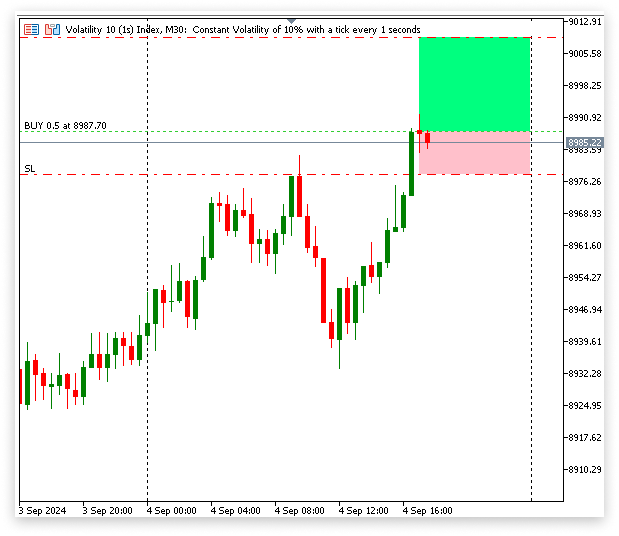
3.1.2.创建趋势线
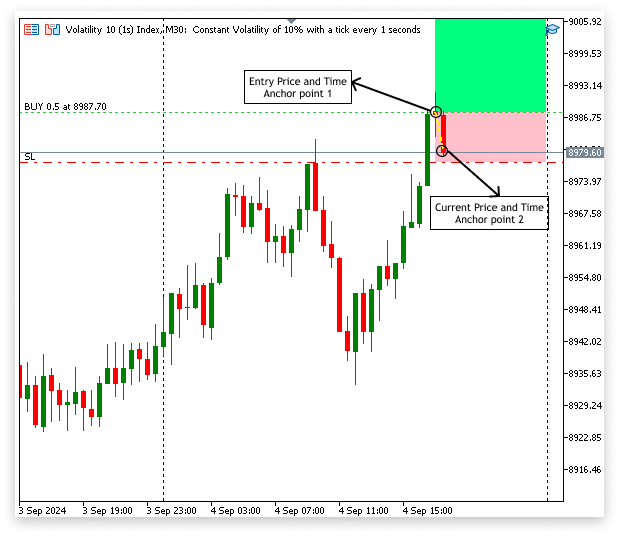
为了说明自交易开始以来的价格走势,我们将在这一部分集中绘制一条从头寸开盘价到当前价格的趋势线。很容易看出这两个入口的市场是如何变化的,这有助于更彻底地查看交易的发展。
示例:// Get the current ask price double ask = SymbolInfoDouble(_Symbol, SYMBOL_ASK); // Create a trend line object on the chart from the position's open time and price to the current time and ask price ObjectCreate(chart_id, "Trend Line", OBJ_TREND, 0, position_open_time, open_price, TimeCurrent(), ask); // Set the color of the trend line ObjectSetInteger(chart_id, "Trend Line", OBJPROP_COLOR, clrYellow); // Set the style of the trend line to dashed ObjectSetInteger(chart_id, "Trend Line", OBJPROP_STYLE, STYLE_DASH); // Set the width of the trend line ObjectSetInteger(chart_id, "Trend Line", OBJPROP_WIDTH, 2);
输出:
3.1.3.添加文本标签
在此阶段,我们将为图表提供四个不同的文本标签。入场价、止盈(TP)、止损(SL)和当前利润都会显示在这些标签上。这些关键的交易参数将为图表上的每个标签提供不同的视觉参考,从而更容易从图表上直接查看交易状态。
示例:// Variables to store position details double open_price; // Variable to store the entry price of the position double stop_loss; // Variable to store the Stop Loss level of the position double take_profit; // Variable to store the Take Profit level of the position datetime position_open_time; // Variable to store the open time of the position // Define the position index for the first position input int position_index = 1; // POSITION INDEX (Index starts from 0) // Get the ID of the current chart long chart_id = ChartID(); // Store the ID of the current chart string time = "23:59"; // Define a specific time as a string // Define the color for the losing zone input color sl_zonez_color = clrPink; // Choose a color for Losing Zone // Define the color for the winning zone input color tp_zonez_color = clrSpringGreen; // Choose a color for Winning Zone // Define the color for the trend line input color line_zonez_color = clrYellow; // Choose a color for the line //+------------------------------------------------------------------+ //| Expert tick function | //+------------------------------------------------------------------+ void OnTick() { // Get the current ask price double ask = SymbolInfoDouble(_Symbol, SYMBOL_ASK); // Convert the string time to datetime datetime close_zone = StringToTime(time); // Loop through all open positions for(int i = 0; i < PositionsTotal(); i++) { // Get the ticket number of the position at index 'i' ulong ticket = PositionGetTicket(i); // Check if the position matches the specified index and symbol of the current chart if(PositionGetInteger(POSITION_TICKET) == PositionGetTicket(position_index) && PositionGetString(POSITION_SYMBOL) == ChartSymbol(chart_id)) { // Retrieve and store the entry price of the position open_price = PositionGetDouble(POSITION_PRICE_OPEN); // Retrieve and store the Stop Loss level of the position stop_loss = PositionGetDouble(POSITION_SL); // Retrieve and store the Take Profit level of the position take_profit = PositionGetDouble(POSITION_TP); // Retrieve and store the open time of the position position_open_time = (int)PositionGetInteger(POSITION_TIME); if(stop_loss > 0) { // Create a rectangle to represent the Stop Loss (SL) zone on the chart ObjectCreate(chart_id, "SL Zone", OBJ_RECTANGLE, 0, position_open_time, open_price, close_zone, stop_loss); } if(take_profit > 0) { // Create a rectangle to represent the Take Profit (TP) zone on the chart ObjectCreate(chart_id, "TP zone", OBJ_RECTANGLE, 0, position_open_time, open_price, close_zone, take_profit); } // Set properties for the SL zone rectangle ObjectSetInteger(chart_id, "SL Zone", OBJPROP_COLOR, sl_zonez_color); // Set color to the selected SL zone color ObjectSetInteger(chart_id, "SL Zone", OBJPROP_STYLE, STYLE_SOLID); // Set style to solid ObjectSetInteger(chart_id, "SL Zone", OBJPROP_WIDTH, 1); // Set the width of the rectangle border ObjectSetInteger(chart_id, "SL Zone", OBJPROP_FILL, sl_zonez_color); // Fill the rectangle with the selected SL zone color ObjectSetInteger(chart_id, "SL Zone", OBJPROP_BACK, true); // Set the rectangle to appear behind the chart objects // Set properties for the TP zone rectangle ObjectSetInteger(chart_id, "TP zone", OBJPROP_COLOR, tp_zonez_color); // Set color to the selected TP zone color ObjectSetInteger(chart_id, "TP zone", OBJPROP_STYLE, STYLE_SOLID); // Set style to solid ObjectSetInteger(chart_id, "TP zone", OBJPROP_WIDTH, 1); // Set the width of the rectangle border ObjectSetInteger(chart_id, "TP zone", OBJPROP_FILL, tp_zonez_color); // Fill the rectangle with the selected TP zone color ObjectSetInteger(chart_id, "TP zone", OBJPROP_BACK, true); // Set the rectangle to appear behind the chart objects // Create a trend line object on the chart from the position's open time and price to the current time and ask price ObjectCreate(chart_id, "Trend Line", OBJ_TREND, 0, position_open_time, open_price, TimeCurrent(), ask); // Set Trend Line properties ObjectSetInteger(chart_id, "Trend Line", OBJPROP_COLOR, line_zonez_color); ObjectSetInteger(chart_id, "Trend Line", OBJPROP_STYLE, STYLE_DASH); ObjectSetInteger(chart_id, "Trend Line", OBJPROP_WIDTH, 2); // Calculate the profit of the current position double profit = PositionGetDouble(POSITION_PROFIT); // Variables to store the formatted profit text string curent_profits; string profit_to_string; // Check if the profit is positive or zero if(profit >= 0) { // Convert the profit to a string with 2 decimal places profit_to_string = DoubleToString(profit, 2); // Format the profit as a positive amount with a '+' sign curent_profits = StringFormat("+$%s", profit_to_string); } // Check if the profit is negative else if(profit < 0) { // Convert the negative profit to a positive number double profit_to_positive = MathAbs(profit); // Convert the positive profit to a string with 2 decimal places profit_to_string = DoubleToString(profit_to_positive, 2); // Format the profit as a negative amount with a '-' sign curent_profits = StringFormat("-$%s", profit_to_string); } // Create a text label on the chart to display the current profit string text_object_name = "Profit"; ObjectCreate(chart_id, text_object_name, OBJ_TEXT, 0, TimeCurrent(), ask); ObjectSetString(chart_id, text_object_name, OBJPROP_TEXT, curent_profits); // Set the color of the profit text based on whether the profit is positive or negative if(profit > 0) { ObjectSetInteger(chart_id, text_object_name, OBJPROP_COLOR, clrMediumBlue); // Positive profit in blue } else if(profit < 0) { ObjectSetInteger(chart_id, text_object_name, OBJPROP_COLOR, clrRed); // Negative profit in red } // Display the Take Profit (TP) level on the chart string tp_display = "TP"; string t_display = StringFormat("Take Profit: %.5f", take_profit); ObjectCreate(chart_id, tp_display, OBJ_TEXT, 0, close_zone, take_profit); ObjectSetString(chart_id, tp_display, OBJPROP_TEXT, t_display); ObjectSetInteger(chart_id, tp_display, OBJPROP_COLOR, clrBlue); // TP text in blue ObjectSetInteger(chart_id, tp_display, OBJPROP_FONTSIZE, 8); // Set font size for TP // Display the Stop Loss (SL) level on the chart string sl_display = "SL"; string s_display = StringFormat("Stop Loss: %.5f", stop_loss); ObjectCreate(chart_id, sl_display, OBJ_TEXT, 0, close_zone, stop_loss); ObjectSetString(chart_id, sl_display, OBJPROP_TEXT, s_display); ObjectSetInteger(chart_id, sl_display, OBJPROP_COLOR, clrRed); // SL text in red ObjectSetInteger(chart_id, sl_display, OBJPROP_FONTSIZE, 8); // Set font size for SL // Display the Entry Price on the chart string en_display = "Entry Price"; string e_display = StringFormat("Entry Point: %.5f", open_price); ObjectCreate(chart_id, en_display, OBJ_TEXT, 0, close_zone, open_price); ObjectSetString(chart_id, en_display, OBJPROP_TEXT, e_display); ObjectSetInteger(chart_id, en_display, OBJPROP_COLOR, clrPaleVioletRed); // Entry Price text in pale violet red ObjectSetInteger(chart_id, en_display, OBJPROP_FONTSIZE, 8); // Set font size for Entry Price } } }
解释:
重要的交易数据旨在通过这段代码直接显示在图表上。它计算当前的头寸利润,并将其显示为文本标签,红色表示负利润,蓝色表示正利润。为了直观地区分 TP 水平、SL 水平和入场价格,它还为每个水平插入文本标签。这些标签的颜色不同。标签已放置在图表上,以方便交易者快速识别关键水平及其头寸的当前利润状态。
输出: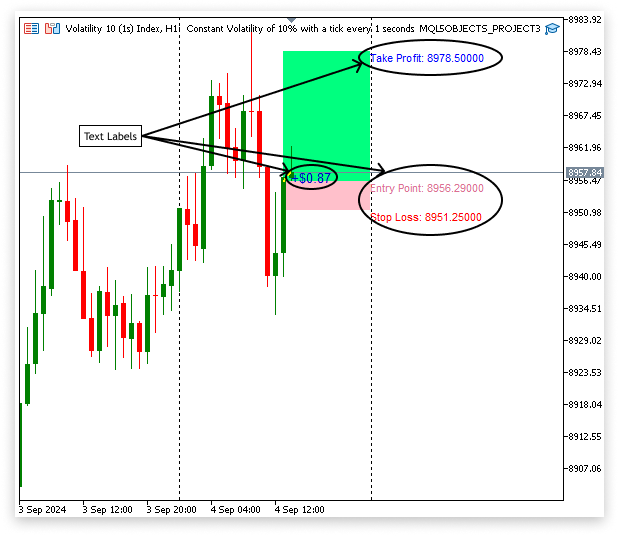
3.2.为历史数据创建图表对象
到目前为止,第 3 章已经介绍了如何创建代表当前仓位的图表对象。我们现在将重点转向处理历史记录,这将使我们能够在图表上看到历史交易趋势和数据。这将使我们能够检查之前的交易并将历史知识应用到当前的交易计划中。
示例:// Define the position index for the first position input int position_index = 1; // POSITION INDEX (Index starts from 0) // Get the ID of the current chart long chart_id = ChartID(); // Store the ID of the current chart string time = "23:59"; // Define a specific time as a string // Define the color for the losing zone input color sl_zonez_color = clrPink; // Choose a color for Losing Zone // Define the color for the winning zone input color tp_zonez_color = clrSpringGreen; // Choose a color for Winning Zone // Define the color for the trend line input color line_zonez_color = clrYellow; // Choose a color for the line // Define whether to show past history or not input string show_history = "no"; // Type yes to show past history // Define the start date to show history input datetime date1 = D'1970.08.10 00:00:00'; // Show history from this date // Define the end date to show history input datetime date2 = D'2024.08.15 00:00:00'; // To this date //+------------------------------------------------------------------+ //| Expert tick function | //+------------------------------------------------------------------+ void OnTick() { // Check if history display is enabled if(show_history == "yes") { Comment(""); // Clear previous comments // Select deal history within the specified date range bool deal_history = HistorySelect(date1, date2); // Variables to store deal details double deal_close_price = 0.0; double deal_open_price = 0.0; double deal_sl = 0.0; double deal_tp = 0.0; double deal_profit = 0.0; datetime deal_close_time = 0; datetime deal_open_time = 0; // Check if deal history is available if(deal_history) { // Loop through all history deals for(int i = 0; i < HistoryDealsTotal(); i++) { ulong ticket = HistoryDealGetTicket(i); // Check for deal entry in if(HistoryDealGetInteger(ticket, DEAL_ENTRY) == DEAL_ENTRY_IN) { if(HistoryDealGetString(ticket, DEAL_SYMBOL) == ChartSymbol(chart_id)) { deal_open_price = HistoryDealGetDouble(ticket, DEAL_PRICE); deal_open_time = (datetime)HistoryDealGetInteger(ticket, DEAL_TIME); } } // Check for deal entry out if(HistoryDealGetInteger(ticket, DEAL_ENTRY) == DEAL_ENTRY_OUT) { deal_profit = HistoryDealGetDouble(ticket, DEAL_PROFIT); deal_close_price = HistoryDealGetDouble(ticket, DEAL_PRICE); deal_sl = HistoryDealGetDouble(ticket, DEAL_SL); deal_tp = HistoryDealGetDouble(ticket, DEAL_TP); deal_close_time = (datetime)HistoryDealGetInteger(ticket, DEAL_TIME); if(HistoryDealGetString(ticket, DEAL_SYMBOL) == ChartSymbol(chart_id)) { string deal_string; string current_deal_profit; string object_name; // Display deal profit/loss if(deal_profit > 0) { deal_string = DoubleToString(deal_profit, 2); current_deal_profit = StringFormat("YOU WON +$%s", deal_string); object_name = StringFormat("PROFIT %d", i); ObjectCreate(chart_id, object_name, OBJ_TEXT, 0, deal_close_time, deal_close_price); ObjectSetString(chart_id, object_name, OBJPROP_TEXT, current_deal_profit); ObjectSetInteger(chart_id, object_name, OBJPROP_COLOR, clrMediumBlue); ObjectSetInteger(chart_id, object_name, OBJPROP_FONTSIZE,8); } else if(deal_profit < 0) { double deal_to_positive = MathAbs(deal_profit); deal_string = DoubleToString(deal_to_positive, 2); object_name = StringFormat("PROFIT %d", i); current_deal_profit = StringFormat("YOU LOST -$%s", deal_string); ObjectCreate(chart_id, object_name, OBJ_TEXT, 0, deal_close_time, deal_close_price); ObjectSetString(chart_id, object_name, OBJPROP_TEXT, current_deal_profit); ObjectSetInteger(chart_id, object_name, OBJPROP_COLOR, clrRed); ObjectSetInteger(chart_id, object_name, OBJPROP_FONTSIZE,8); } // Display deal SL zone string sl_obj_name = StringFormat("SL ZONE %d", i); if(deal_sl > 0) { ObjectCreate(chart_id, sl_obj_name, OBJ_RECTANGLE, 0, deal_open_time, deal_open_price, deal_close_time, deal_sl); } ObjectSetInteger(chart_id, sl_obj_name, OBJPROP_COLOR, sl_zonez_color); ObjectSetInteger(chart_id, sl_obj_name, OBJPROP_STYLE, STYLE_SOLID); ObjectSetInteger(chart_id, sl_obj_name, OBJPROP_WIDTH, 1); ObjectSetInteger(chart_id, sl_obj_name, OBJPROP_FILL, sl_zonez_color); ObjectSetInteger(chart_id, sl_obj_name, OBJPROP_BACK, true); // Display deal TP zone string tp_obj_name = StringFormat("TP ZONE %d", i); if(deal_tp > 0) { ObjectCreate(chart_id, tp_obj_name, OBJ_RECTANGLE, 0, deal_open_time, deal_open_price, deal_close_time, deal_tp); } ObjectSetInteger(chart_id, tp_obj_name, OBJPROP_COLOR, tp_zonez_color); ObjectSetInteger(chart_id, tp_obj_name, OBJPROP_STYLE, STYLE_SOLID); ObjectSetInteger(chart_id, tp_obj_name, OBJPROP_WIDTH, 1); ObjectSetInteger(chart_id, tp_obj_name, OBJPROP_FILL, tp_zonez_color); ObjectSetInteger(chart_id, tp_obj_name, OBJPROP_BACK, true); // Display deal trend line string line_obj_name = StringFormat("line %d", i); ObjectCreate(chart_id, line_obj_name, OBJ_TREND, 0, deal_open_time, deal_open_price, deal_close_time, deal_close_price); ObjectSetInteger(chart_id, line_obj_name, OBJPROP_COLOR, line_zonez_color); ObjectSetInteger(chart_id, line_obj_name, OBJPROP_STYLE, STYLE_DASH); ObjectSetInteger(chart_id, line_obj_name, OBJPROP_WIDTH, 2); } } } } } }
解释:
这段代码首先评估 show_history 变量,以查看历史显示功能是否启用。如果选择“是”,代码将使用 Comment("") 从图表中删除任何先前的注释,只留下最新的可见数据。然后将结果存储在 deal_history 布尔型变量中。然后使用 HistorySelect(date1, date2) 方法选择给定日期范围内的历史交易。我们可以利用历史交易数据来进行这一选择。 然后,将有关每个先前协议的数据存储在各种变量中。交易的收盘价和开盘价记录在 deal_close_price 和 deal_open_price 中。“deal_sl”和“deal_tp”用于记录止损和止盈的值。“deal_close_time”和“deal_open_time”记录了交易的结束和开始时间,以及跟踪交易盈利或亏损的 deal_profit。
代码判断是否可以访问交易历史。如果是,它会启动一个循环,使用 HistoryDealGetTicket(i) 来检索每笔交易的编号,并遍历所有可能的交易。它区分每个编号交易的入场和离场记录。退出交易提供收盘价、利润、止损和获利值,而入场交易则用于记录开盘价和时间。这些细节用于生成各种图表项,例如显示交易过程中价格变动的趋势线、指示损益的文本标签以及表示止盈和止损区域的矩形。这种方法确保了历史交易数据高效地显示在屏幕上,为之前的表现提供了重要的见解。
输出:
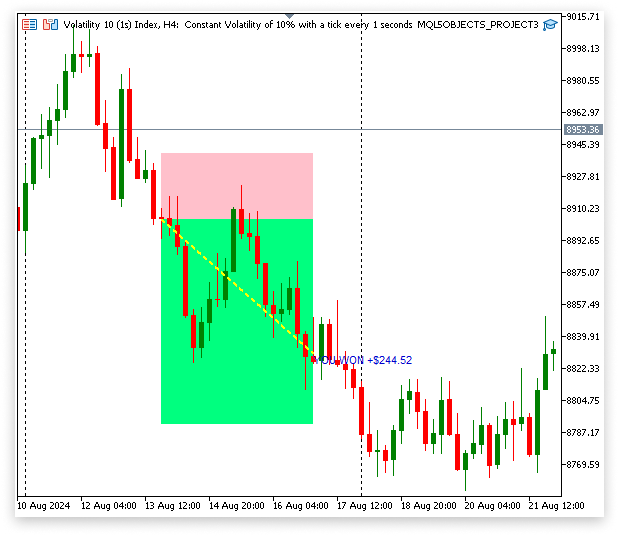
结论
在本文中,我们探讨了如何在 MQL5 中使用对象,重点是构建和修改图表元素以增强交易分析。我们介绍了为止盈区和止损区创建矩形、跟踪价格变化的趋势线以及为重要交易数据创建文本标签。我们还研究了如何使用标签和视觉辅助工具显示以前的交易,从而清楚地了解历史表现。
本文由MetaQuotes Ltd译自英文
原文地址: https://www.mql5.com/en/articles/15764
注意: MetaQuotes Ltd.将保留所有关于这些材料的权利。全部或部分复制或者转载这些材料将被禁止。
本文由网站的一位用户撰写,反映了他们的个人观点。MetaQuotes Ltd 不对所提供信息的准确性负责,也不对因使用所述解决方案、策略或建议而产生的任何后果负责。
 重构经典策略(第九部分):多时间框架分析(第二部分)
 Connexus的头(第三部分):掌握HTTP请求头的使用方法
 基于MQL5和Python的自优化EA(第五部分):深度马尔可夫模型

。