
MQL5入門(第9回):MQL5のオブジェクトの理解と使用
はじめに
MQL5の連載に戻ってきていただき、ありがとうございます。この章では、皆さんにとって非常に有益で興味深いテーマについてお話しします。今回は、MQL5のさまざまなチャートオブジェクトを扱うプロジェクトを始めます。これにより、今後のプロジェクトに必要な基礎を築くことができます。このステップは、複雑なハーモニックパターンを使うプロジェクトに取り組む際にも特に役立つでしょう。 MQL5のチャートオブジェクトは、取引チャート上に価格レベル、取引ゾーン、テキスト注釈など、さまざまなデータを視覚的に表現するためのグラフィック要素です。これにより、トレーダーや開発者はチャート分析を強化するためのカスタマイズされたビジュアルを柔軟に作成でき、市場動向や主要な価格レベル、取引機会の特定が容易になります。
MQL5では、基本的な線や図形から、テキスト、矢印、カスタム指標など複雑なコンポーネントに至るまで、さまざまなチャートオブジェクトが使用できます。各オブジェクトの色、サイズ、位置、その他の属性を調整することで、取引環境を高度にカスタマイズ可能です。チャートオブジェクトは単なる装飾ではなく、市場データを明確で理解しやすい形で表現するための効果的な手段です。たとえば、長方形でサポートやレジスタンスのレベルを示すことで、反転の可能性があるポイントを簡単に特定できます。 この記事では、実践的なプロジェクトを通じてMQL5のチャートオブジェクトの基本概念とその活用方法を解説します。
本プロジェクトでは、チャート上に視覚的なガイドを表示し、取引を改善するエキスパートアドバイザー(EA)を開発します。エントリポイントからストップロスゾーンやテイクプロフィットゾーンまでのルートはEAによって自動的に示されるため、取引のリスクとリターンを即座に視覚的に評価できます。EAは市場の動きに応じて現在の利益や損失をリアルタイムで更新し、他のデータソースを参照することなく、エントリ、ストップロス、テイクプロフィット価格などをチャート上で一目で確認できるようにします。
このEAの主な特徴の1つは、取引設定の変更に対する柔軟な適応性です。テイクプロフィットやストップロスのレベルを調整すると、EAがチャートを即座に更新し、視覚的なガイドも最新の状態に保たれます。また、EAは取引の長さに合わせて調整されます。取引が長引く場合にも自動的に調整され、視覚的要素がより強調されるため、さまざまな時間枠での取引監視が効果的になります。これにより、最初は長い時間枠ではあまり目立たないかもしれませんが、さまざまな時間枠で取引を効果的に監視できるようになります。この動的な適応により、より短い時間枠からの取引を管理し、変化を追跡することがより簡単になります。
さらに、EAを使用することで、過去の取引を見直し、洞察深い履歴分析が可能です。過去の取引での利益や損失を確認することで取引パフォーマンスを評価し、賢明な意思決定に役立てることができます。日付範囲を指定すると、チャート上に履歴データが直接表示され、取引履歴を全体的に把握したり、特定の取引を詳細に分析することも可能です。
現在の取引の可視化 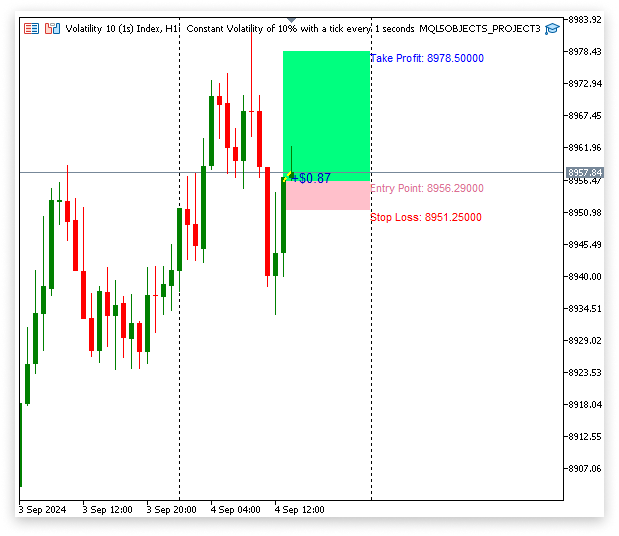
過去の取引に関する洞察:
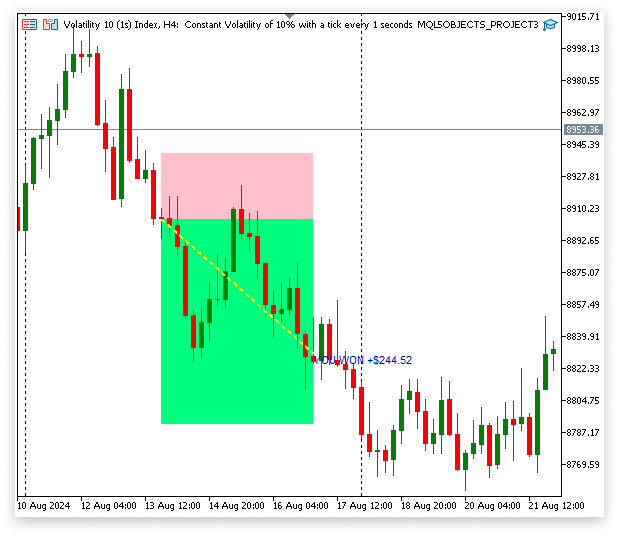
この記事では、次の内容を学びます。
- 視覚的な分析を強化するためのチャートオブジェクトの作成および編集方法
- ポジションをループしながら、取引をチャート上で効率的に管理・表示する方法
- 過去の取引データを活用して、チャートオブジェクトの配置を調整する方法
- パフォーマンス追跡のために、チャート上で過去の取引の利益・損失を可視化する方法
- 日時変換を用いて、チャートオブジェクトの作成時間を正確に計測する方法
- チャート上のエントリ、テイクプロフィット(TP)、ストップロス(SL)に関する詳細な注釈の作成方法
- 入力パラメータを活用して、EAをカスタマイズする方法
このプロジェクトの目的は、MQL5におけるチャートオブジェクトの便利な使い方を習得することです。実践的なアプローチを通じて、EA内でチャートオブジェクトを効率的に統合・編集し、取引の管理や視覚的な分析を強化する方法を学びます。また、重要な取引データをチャート上に表示し、取引判断とパフォーマンス追跡に役立つツールの活用方法も理解できるようになります。本プロジェクトでは、さまざまなチャートオブジェクトの作成、編集、管理のプロセスを順を追って詳しく解説します。
1. MQL5のチャートオブジェクト
1.1.チャートオブジェクトについて
MQL5のチャートオブジェクトとは、トレーダーがチャート上に配置して、分析や意思決定をサポートするための視覚的な要素です。これらのオブジェクトは、シンプルな図形や線、テキストから、チャネルや矢印などの複雑な要素まで、さまざまな形式で構成されます。主に重要なデータを視覚的に表現するために用いられ、トレーダーが取引計画を立てたり、市場状況を評価したり、ポジションを追跡するのに役立ちます。たとえば、重要な価格レベルを強調表示したり、市場の方向を示すトレンドラインを描画することが可能です。このようにデータをチャート上に可視化することで、トレーダーは数値データだけに頼るのではなく、市場の状況を迅速かつ総合的に把握し、的確な取引判断ができるようになります。
1.2.チャートオブジェクトのカスタマイズが重要な理由
チャートオブジェクトをカスタマイズすることにより、取引チャートの視覚的な明瞭性を高め、より効果的な意思決定を支援します。オブジェクトの色、サイズ、位置を調整することで、チャートを自身の取引スタイルや好みに合わせ、最も重要な情報を強調して、一目で理解しやすいようにすることが可能です。
たとえば、サポートやレジスタンスのレベルを視覚的に把握しやすくするために、太い線や鮮やかな色を使用することで、忙しい取引セッション中でも重要なシグナルを見逃しにくくなります。また、目立つテキスト注釈を加えることで、重要な取引判断や戦略を簡単に思い出せる視覚的な手がかりとして活用できます。
1.3. プロジェクトで使用するチャートオブジェクト
このプロジェクトでは、取引分析をより強化するため、いくつかの主要なMQL5チャートオブジェクトを使用します。具体的なオブジェクトは以下の通りです。
1.3.1.トレンドライン
トレンドラインは、私たちのプロジェクトに不可欠なツールです。 これは主に、重要なトレンドレベルにおける現在の市場価格を追跡し、エントリポイントを特定するために使用されます。市場の全体的な方向性を把握するため、主要な価格ポイント間にトレンドラインを描画します。 市場価格が変動(「ティック」)するたびにトレンドラインはリアルタイムで更新され、初回エントリ価格から最新の市場価格まで継続的に延長されます。
これにより、トレンドラインは常に最新の価格データを反映し、取引のパフォーマンスを正確に追跡することが可能となり、ポジション管理の判断に役立ちます。多くの場合、トレンドラインはポジションのエントリ価格から始まり、取引の開始点を示します。そして、現在の市場価格や売値まで延長され、取引開始からの価格の推移を視覚的に示します。
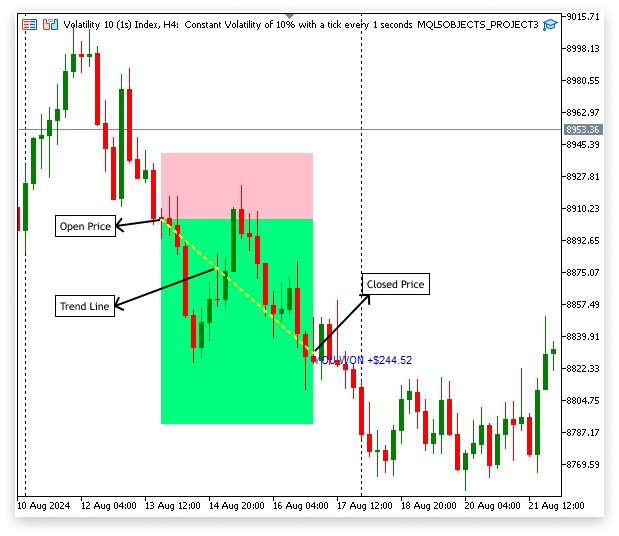
1.3.2. テキストラベル
テキストラベルは、チャート上で取引の各側面に関する明確でわかりやすい情報を提供します。エントリポイント、ストップロスレベル、テイクプロフィットターゲット、取引戦略に関するその他の関連情報など、重要なデータをラベルとして表示できます。チャート上の重要な位置にテキストラベルを追加することで、外部のメモや記憶に頼ることなく、必要な情報を即座に確認することが可能です。この視覚的な補助により、意思決定に必要なデータが手元にある状態を保てます。
ポジションの現在の利益や損失を示すテキストラベルも、ティックごとにリアルタイムで更新されます。この更新により、市場の動きに応じて取引のパフォーマンスを随時監視でき、取引が想定通りの方向に進んでいるかどうかを即座に判断できます。たとえば、取引の横に「+$100」や「-$50」といったラベルが表示され、現在の利益や損失が市場の変動に応じてリアルタイムに更新されます。これにより、取引状況を的確に把握し、必要な調整を即座におこなうことができます。
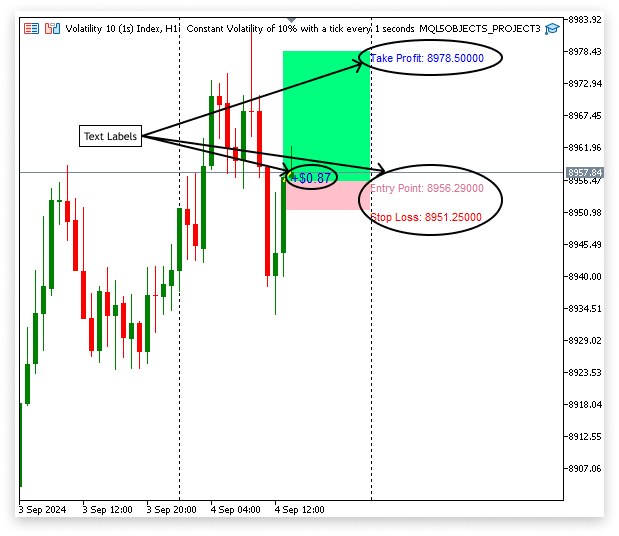
1.3.3.長方形オブジェクト
長方形オブジェクトは、チャート上でサポートレベルやレジスタンスレベルを視覚的に示すために使用できますが、このプロジェクトでは取引における利益ゾーンと損失ゾーンの表示に特化して使用します。ポジションが現在損失を出している場合、エントリポイントからストップロスレベルまでをカバーするように長方形を描画します。これにより、損失ゾーンが視覚的に強調され、ポジションがストップロスに近づいているかどうかを一目で確認できるようになります。一方、ポジションが利益を出している場合は、エントリポイントからテイクプロフィットレベルまで長方形を描画します。これにより、利益ゾーンが視覚的に強調され、取引がテイクプロフィットの目標に向かっているかどうかを追跡することができます。
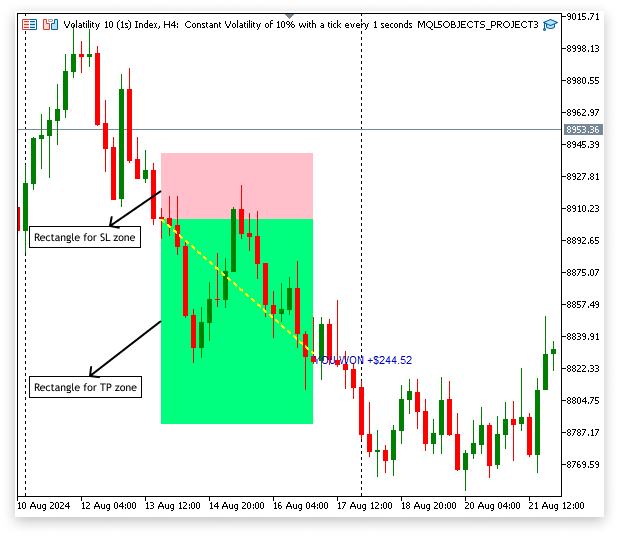
MQL5には多様なチャートオブジェクトが用意されており、それぞれが特定の方法で取引分析を改善するために設計されています。しかし、これらすべてを1つの記事で取り上げるのは情報量が多すぎるため、本プロジェクトで使用する項目に焦点を絞りました。 選択された長方形、トレンドライン、テキストラベルなどのオブジェクトは、この特定の戦略に不可欠であり、他のMQL5オブジェクトの作成や変更のプロセスにも共通しています。これらのオブジェクトの概念と使用方法を理解することで、MQL5のさまざまなチャートオブジェクトを操作するために必要な基礎知識を習得でき、取引のニーズに応じたカスタマイズや新たなオブジェクトの作成もスムーズに行えるようになります。
2.オブジェクトの作成とカスタマイズ
このセクションでは、MQL5におけるさまざまなチャートオブジェクトの作成とカスタマイズ方法に焦点を当てます。具体的には、長方形、トレンドライン、テキストラベルなどのオブジェクトの作成方法と、取引計画に合わせて色、スタイル、幅を調整する方法について説明します。
2.1.擬似コード
このプロジェクトでは、疑似コードが非常に重要です。コードを書く前に、目標を達成するために必要なロジックや手順を整理し、簡潔にまとめることができるからです。疑似コードは、複雑なタスクをより小さく、管理しやすいコンポーネントに分解するのに役立ちます。この過程を経ることで、計画がより明確になり、予想される問題を早期に特定できます。また、記述するコードは効率的で整理されたものになります。疑似コードを活用することで、EAのフロー全体を視覚化でき、チャートオブジェクトやその他の機能の実装がスムーズに進みます。
以下はEAの基本的な擬似コードです。
1. 初期化
- SLゾーン、TPゾーン、トレンドラインの色を定義します。
- ポジションインデックスを設定します。
- 履歴データを表示するかどうかを指定します。
- 履歴データの開始日と終了日を定義します。
- ゾーンを閉じる時間を設定します。
- 現在のチャートIDを取得します。
- ポジションの詳細(始値、ストップロス、テイクプロフィット、利益、開始時間)を保存するための変数を初期化します。
2. ティックごとに
- 文字列時間をクローズゾーンのdatetimeオブジェクトに変換します。
- 現在のAsk価格を取得します。
- すべてのポジションをループします。
- ポジションのチケット番号を取得します。
- 位置がチャートの銘柄と一致しているかどうかを確認します。
- 詳細(始値、ストップロス、テイクプロフィット、開始時間、利益)を取得します。
- ポジションが指定されたインデックスと一致する場合。
- SLゾーンの長方形を作成して構成します。
- プロパティ(色、スタイル、幅、塗りつぶし)を設定します。
- TPゾーンの長方形を作成して構成します。
- プロパティ(色、スタイル、幅、塗りつぶし)を設定します。
- トレンドラインを作成して構成します。
- プロパティ(色、スタイル、幅)を設定します。
- ポジション利益を計算して表示します。
- 利益をテキストとしてフォーマットして表示します。
- エントリ、TP、SLのテキストオブジェクトを作成して構成します。
- プロパティ(色、フォントサイズ)を設定します。
3. 履歴データ表示が有効になっている場合
- 以前のコメントを消去します。
- 指定された日付範囲内の過去の取引を選択してループします。
- 各取引の詳細(始値、終値、SL、TP、利益、時間)を取得します。
- 損益情報を表示します。
- 過去の取引のSLゾーン、TPゾーン、トレンドラインを作成して構成します。
- プロパティ(色、スタイル、幅)を設定します。
2.2. 実用例:オブジェクトの作成とカスタマイズ
2.2.1 チャートオブジェクトの作成
MQL5には、取引チャート上にさまざまなオブジェクトを作成できる重要なツールとして、ObjectCreate()関数があります。これにより、トレーダーは市場データを視覚的にわかりやすく表現し、トレンドを分析し、チャート上で重要なポイントをマークするのに役立ちます。作成できるオブジェクトには、トレンドラインや長方形、テキストラベル、矢印などがあります。
単なる作成を超えて:オブジェクトの配置を指定する
ObjectCreate()は、チャート上にオブジェクトを作成するだけでなく、そのパラメータを使用して、オブジェクトの表示位置を詳細に設定することもできます。チャート上の特定の位置にオブジェクトを配置し、必要なパラメータを指定することで、より的確に分析をおこない、その効果を高めることができます。配置の基準となる主な要素は「時間」と「価格」です。これらの要素は、チャート上の特定の位置にオブジェクトを固定するためのアンカーとして機能します。
構文
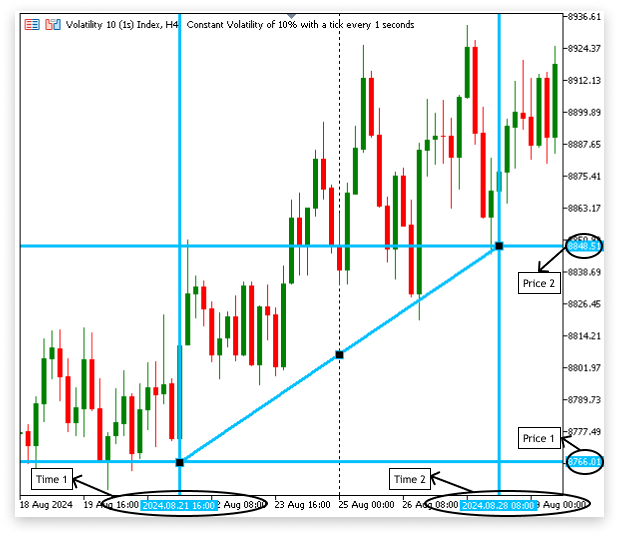
ObjectCreate(chart_id, object_name, object_type, sub_window, time1, price1, time2, price2, time3, price3); オブジェクト配置における時間と価格の関係
MQL5の取引チャート上の各ポイントは、価格(縦軸)と時間(横軸)という2つの次元の相互作用によって決定されます。これらの次元は、ObjectCreate関数を用いてオブジェクトを作成する際、チャート上でのオブジェクトの正確な位置を指定するために活用されます。
アンカーポイント(time1、price1、time2、price2、time3、price3)について
ObjectCreate()でオブジェクトを作成する際には、通常1つ以上のアンカーポイントを指定する必要があります。オブジェクトの正確な位置は、これらのアンカーポイントを基準に決定されます。これらのアンカーポイントには、time1、price1、time2、price2、time3、price3といったパラメータが含まれ、オブジェクトの配置における要となります。
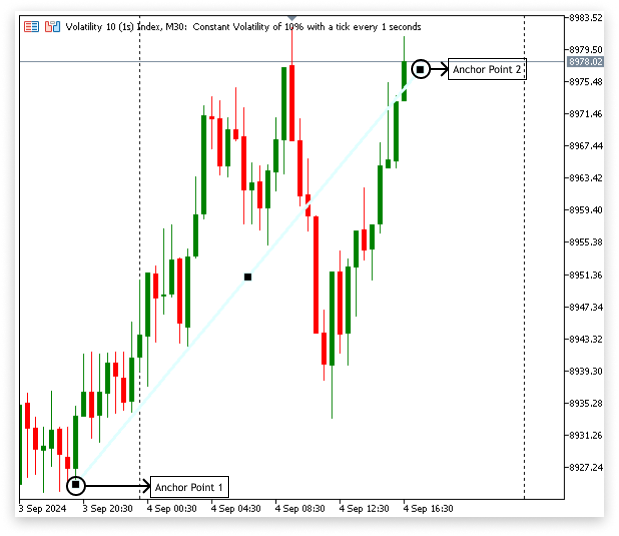
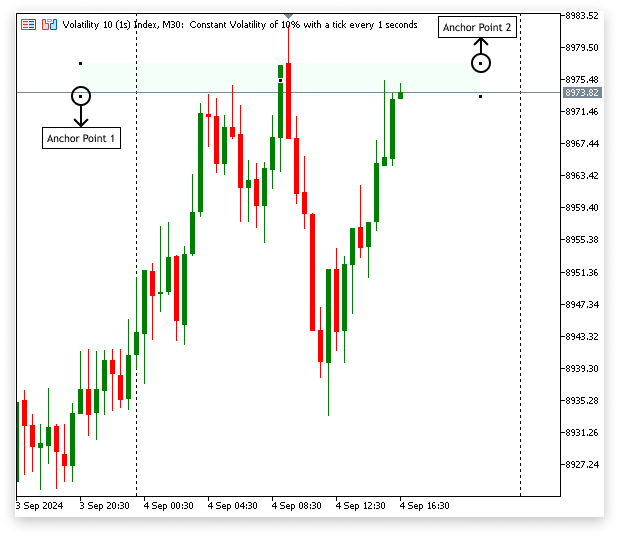
- time1とprice1: これらのパラメータは、オブジェクトの初期アンカーポイントを設定します。たとえば、トレンドラインを描画する場合、time1は開始点の時間(特定のローソク足など)を示し、price1はその時点での価格レベルを示します。
- time2とprice2: オブジェクトの2番目のアンカーポイントを指定します。これは、トレンドラインの例ではラインの終点になります。price2はその瞬間の価格レベルを示し、time2は2番目のポイントの時間を示します。
time3とprice3: チャネルや三角形など、より複雑なオブジェクトには3番目のアンカーポイントが必要です。time3とprice3を使用してこの3番目のポイントを指定します。これは、3つの座標を必要とする図形を描画する際に必要になります。
// Get the ID of the current chart
long chart_id = ChartID();

//+------------------------------------------------------------------+
//| Script program start function                                    |
//+------------------------------------------------------------------+
void OnStart()
  {
// Define the first anchor point for the trendline
// 'time1' is the datetime for the first point, and 'price1' is the price at that time
   datetime time1  = D'2024.08.21 16:00';
   double   price1 = 8766.01;

// Define the second anchor point for the trendline
// 'time2' is the datetime for the second point, and 'price2' is the price at that time
   datetime time2  = D'2024.08.28 08:00';
   double   price2 = 8854.51;

// Create a trendline object on the chart
// 'chart_id' is the ID of the chart where the object will be placed
// "Trend Line" is the name of the trendline object
// 'OBJ_TREND' specifies that the object is a trendline
// The last four parameters (0, time1, price1, time2, price2) specify the anchor points of the trendline
   ObjectCreate(chart_id, "Trend Line", OBJ_TREND, 0, time1, price1, time2, price2);
  }
出力:
テキストラベル(OBJ_TEXT)は、1つのアンカーポイントだけでチャート上に配置できます。アンカーポイントは、提供された価格と時間の座標に基づいてテキストの位置を示します。特定の瞬間と価格でチャート上にテキストラベル「Buy Here」が表示されます。
例
// Get the ID of the current chart
long chart_id = ChartID();

//+------------------------------------------------------------------+
//| Script program start function                                    |
//+------------------------------------------------------------------+
void OnStart()
  {
// Define the time for the text label's position (August 21, 2024, at 16:00)
   datetime time1  = D'2024.08.21 16:00';

// Define the price level for the text label's position (8766.01)
   double   price1 = 8766.01;

// Create a text object named "Text" on the chart at the specified time and price
   ObjectCreate(chart_id, "Text", OBJ_TEXT, 0, time1, price1);

// Set the text content of the object to display "Buy Here"
   ObjectSetString(chart_id, "Text", OBJPROP_TEXT, "Buy Here");
  }
出力:
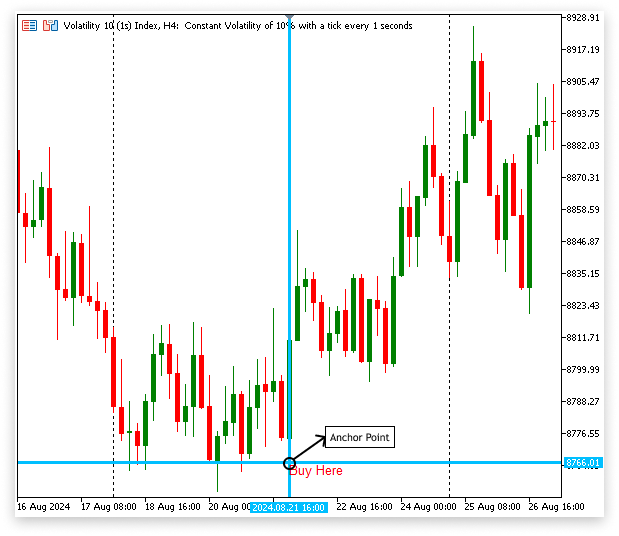
2.3. オブジェクトのカスタマイズ
チャートオブジェクトの視覚的なコンポーネントは、自分の取引スタイルや目的に合わせてカスタマイズできます。オブジェクトのサイズ、色、スタイルを変更することで、取引の重要な要素が視覚的に際立つようにすることが可能です。たとえば、トレンドラインを他のチャート要素から目立たせるために、その色、太さ、位置を調整し、重要な市場レベルに視覚的なフォーカスを合わせることができます。 同様に、テキストラベルのフォントと色を変更することで、利益目標やエントリポイントなど、特に重要な情報に注意を向けやすくなります。
例
// Define the time for the text label's position (August 21, 2024, at 16:00)
datetime time1  = D'2024.08.21 16:00';

// Define the price level for the text label's position (8766.01)
double   price1 = 8766.01;

// Create a text object named "Text" on the chart at the specified time and price
ObjectCreate(chart_id, "Text", OBJ_TEXT, 0, time1, price1);

// Set the text content of the object to display "Buy Here"
ObjectSetString(chart_id, "Text", OBJPROP_TEXT, "Buy Here");

// Set the color of the text object to Medium Blue
ObjectSetInteger(chart_id, "Text", OBJPROP_COLOR, clrMediumBlue);
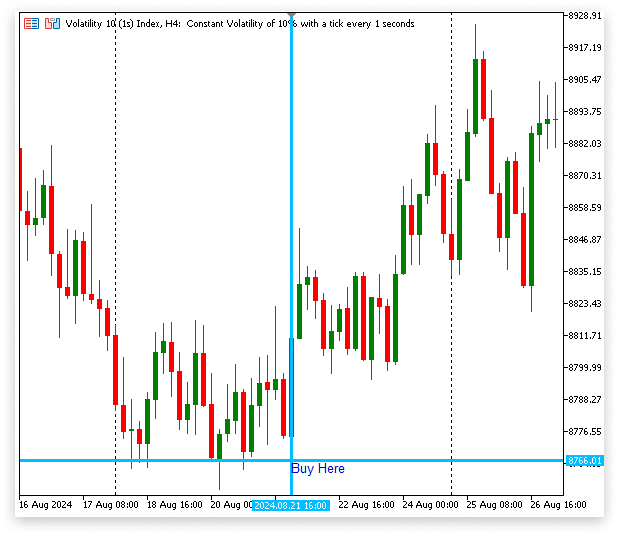
このコードは、「Buy Here」というテキストを表示し、指定された時間と価格でチャートにテキストラベルを追加し、テキストの色をMedium Blueに変更します。
出力:
2.3.1. MQL5でチャートオブジェクトをカスタマイズするためのオブジェクト関数
MQL5のチャートオブジェクトは、さまざまなオブジェクト関数を利用してカスタマイズできます。これらの関数を使用すると、チャートオブジェクトの外観、操作性、位置を変更して、独自の取引要件をより適切に満たすことができます。
色、幅、スタイルなど、チャートオブジェクトの整数型プロパティを設定するために使用されます。
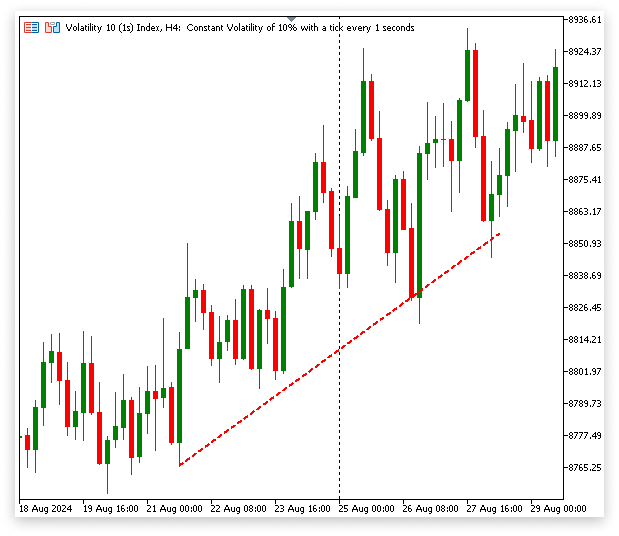
例// Get the ID of the current chart long chart_id = ChartID(); //+------------------------------------------------------------------+ //| Script program start function | //+------------------------------------------------------------------+ void OnStart() { datetime time1 = D'2024.08.21 16:00'; double price1 = 8766.01; // Define the second anchor point for the trendline // 'time2' is the datetime for the second point, and 'price2' is the price at that time datetime time2 = D'2024.08.28 08:00'; double price2 = 8854.51; // Create a trend line object on the chart with the name "Trend Line" // The trend line will be drawn from time1/price1 to time2/price2 ObjectCreate(chart_id, "Trend Line", OBJ_TREND, 0, time1, price1, time2, price2); // Set the style of the trend line to a dashed line ObjectSetInteger(chart_id, "Trend Line", OBJPROP_STYLE, STYLE_DASH); // Set the width of the trend line to 2 ObjectSetInteger(chart_id, "Trend Line", OBJPROP_WIDTH, 2); }
出力:
通常は価格や時間に関するdouble型の属性を設定します (例:トレンドライン上のアンカーポイントの座標の調整)。
テキストラベルによって表示されるテキストなどの文字列型のプロパティを設定するために使用されます
例: チャートへの直接注釈やメモの追加
// Create a text object named "Text" on the chart at the specified time and price
ObjectCreate(chart_id, "Text", OBJ_TEXT, 0, time1, price1);

// Set the text content of the object to display "Buy Here"
ObjectSetString(chart_id, "Text", OBJPROP_TEXT, "Buy Here");
MQL5で利用できるさまざまなオブジェクト関数を使用して、多種多様なチャートオブジェクトを構築、カスタマイズ、管理できます。これらの機能は、チャート上で取引データを効果的に視覚化するために不可欠な要素です。本プロジェクトでは、特に重要な関数としてObjectCreateとObjectSetIntegerを取り上げましたが、MQL5にはこれら以外にも多くの関数が用意されています。 追加の機能についてより深く理解するには、MQL5ドキュメントで利用可能なすべてのチャート関数に関する詳細な情報を確認してください。
3. プロジェクトにチャートオブジェクトを実装する
3.1. 現在ポジションのチャートオブジェクトの作成
このセクションでは、チャート上で現在のポジションに関連するデータを視覚的に表示するためのチャートオブジェクトの構成方法に焦点を当てます。リアルタイムの取引データを効果的に視覚化するために、長方形、トレンドライン、テキストラベルを作成および変更する手順を含めます。
3.1.1.長方形を使用して領域を強調する
2つの異なる長方形オブジェクトを使用して、チャート上でストップロス(SL)レベルとテイクプロフィット(TP)レベルが設定されている重要なゾーンを視覚的に強調します。これらの長方形オブジェクトは、SLゾーンとTPゾーンを動的に表現し、リスクと報酬のレベルを一目で簡単に監視できるようにします。
a. SLゾーンのハイライト
- アンカー1:SLゾーンの長方形の最初のアンカーは、取引のエントリ価格とポジションが開かれた正確な時刻に配置されます。
- アンカー2:2番目のアンカーはSL価格に配置され、当日の23:59まで水平に延長します。このように設定することで、長方形は毎日動的に更新され、取引が終了するかその日の終わりまでSLゾーンを視覚的にカバーします。
- 目的:この長方形はチャート上のリスク領域を示し、現在の価格がSLレベルにどれだけ近いかをすぐに識別できます。
b. TPゾーンのハイライト
- アンカー1:TPゾーンの長方形の最初のアンカーも、取引のエントリ価格から始まります。
- アンカー2:2番目のアンカーは、当日の23:59まで水平に伸び、現在のポジションのTP価格に配置されます。SLゾーンと同様に、潜在的な報酬エリアは、この拡大する長方形によって毎日継続的に強調表示されます。
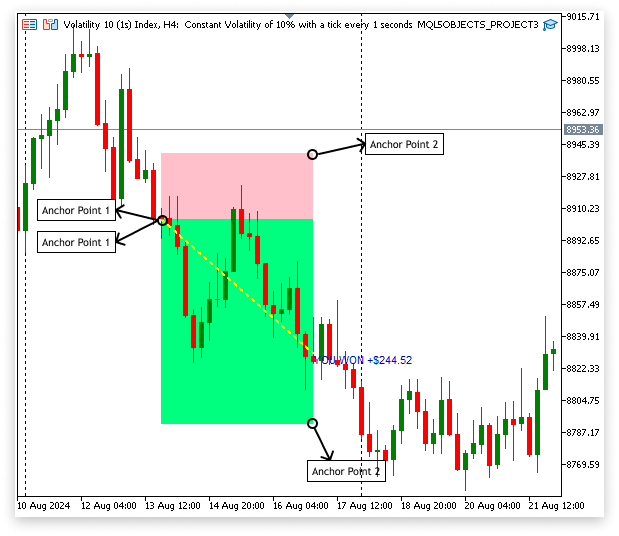
SLゾーンとTPゾーンを強調表示する正方形は、すべての位置の必要な情報をプログラムで取得した後にのみ作成できます。これには、始値、ストップロス(SL)レベル、テイクプロフィット(TP)レベル、取引開始時刻が含まれます。これらの値をプログラムで取得することで、正方形がチャート上に適切に配置され、すべてのポジションで適切なレベルと時間に一致することを確認します。この自動化された方法により、長方形は新しいポジションで動的に更新されるので、視覚的な表現は常に最新かつ関連性のあるものに保たれます。
例:
// Variables to store position details
double open_price;          // Variable to store the entry price of the position
double stop_loss;           // Variable to store the Stop Loss level of the position
double take_profit;         // Variable to store the Take Profit level of the position
datetime position_open_time; // Variable to store the open time of the position

//+------------------------------------------------------------------+
//| Expert tick function                                             |
//+------------------------------------------------------------------+
void OnTick()
  {
// Loop through all open positions
   for(int i = 0; i < PositionsTotal(); i++)
     {
      // Get the ticket number of the position at index 'i'
      ulong ticket = PositionGetTicket(i);

      // Retrieve and store the entry price of the position
      open_price = PositionGetDouble(POSITION_PRICE_OPEN);

      // Retrieve and store the Stop Loss level of the position
      stop_loss = PositionGetDouble(POSITION_SL);

      // Retrieve and store the Take Profit level of the position
      take_profit = PositionGetDouble(POSITION_TP);

      // Retrieve and store the open time of the position
      position_open_time = (int)PositionGetInteger(POSITION_TIME);

      // Print the retrieved values for debugging or verification
      Print("Open Price index ",i,": ",open_price);
      Print("SL index ",i,": ",stop_loss);
      Print("TP index ",i,": ",take_profit);
      Print("Open time index ",i,": ",position_open_time);
     }
  }
説明
取引商品の価格が変動するたびにOnTick関数がコードを実行し、取引口座内の各ポジションに関する重要な情報が取得されます。すべてのポジションがループ処理され、PositionsTotal()関数がポジションの総数を返し、リスト内のインデックスに基づき各ポジションの詳細情報が得られます。この詳細情報の取得にはPositionGetDouble関数やPositionGetInteger関数を使用します。デバッグや検証のため、取得したデータはSLゾーンやTPゾーンを強調表示する長方形などの視覚要素がチャートに追加される前に端末に出力され、正確なデータが収集されていることを確認します。
現在の実装には以下の2点の問題があります。
- 特定のポジションの識別現状ではEAが時間や価格データを取得する際にどのポジションから情報を抽出しているのかが明確でなく、特定のポジション情報が必要な場合でもすべてのポジションをループ処理してしまいます。このため、余分な情報が収集され、誤ったデータが使用されるリスクがあります。
- チャート商品に固有のデータ取得する情報は、現在チャートに表示されている商品のポジションに関連している必要があります。チャート上の銘柄がフィルタされていないと、EAが現在のチャートと異なる商品のポジションデータを抽出してしまうことがあり、不正確または誤解を招く表示が生成される可能性があります。
この問題の解決策として、ユーザーが取得したいポジションインデックスを指定できる入力オプションを提供する方法が考えられます。この情報を使用することで、EAはユーザーが必要とする特定のポジションデータに絞り込んで処理をおこなえます。また、コードは選択されたポジションが現在のチャートに表示されているインストゥルメントと一致するかを確認することで、関連するデータのみを表示に利用し、正確な視覚表現を提供します。
例:
// Variables to store position details
double open_price;          // Variable to store the entry price of the position
double stop_loss;           // Variable to store the Stop Loss level of the position
double take_profit;         // Variable to store the Take Profit level of the position
datetime position_open_time; // Variable to store the open time of the position

// Define the position index for the first position
input int position_index  = 0; // POSITION INDEX (Index starts from 0)

// Get the ID of the current chart
long chart_id = ChartID();


//+------------------------------------------------------------------+
//| Expert tick function                                             |
//+------------------------------------------------------------------+
void OnTick()
  {


// Loop through all open positions
   for(int i = 0; i < PositionsTotal(); i++)
     {
      // Get the ticket number of the position at index 'i'
      ulong ticket = PositionGetTicket(i);

      if(PositionGetInteger(POSITION_TICKET) == PositionGetTicket(position_index) && PositionGetString(POSITION_SYMBOL) == ChartSymbol(chart_id))
        {

         // Retrieve and store the entry price of the position
         open_price = PositionGetDouble(POSITION_PRICE_OPEN);

         // Retrieve and store the Stop Loss level of the position
         stop_loss = PositionGetDouble(POSITION_SL);

         // Retrieve and store the Take Profit level of the position
         take_profit = PositionGetDouble(POSITION_TP);

         // Retrieve and store the open time of the position
         position_open_time = (int)PositionGetInteger(POSITION_TIME);

         // Print the retrieved values for debugging or verification
         Print("Open Price index ",i,": ",open_price);
         Print("SL index ",i,": ",stop_loss);
         Print("TP index ",i,": ",take_profit);
         Print("Open time index ",i,": ",position_open_time);

        }
     }

  }
アルゴリズムは各ポジションを反復処理し、選択したインデックスとチャート銘柄に対応するかどうかを判断し、関連情報を取得します。 指定されたポジションの価格と時間データを正常に取得した後、SL(ストップロス)ゾーンとTP(テイクプロフィット)ゾーンを示す2つの長方形を作成できます。これらの長方形がチャート上のSL領域とTP領域を適切に表すことを保証するために、取得したデータはObjectCreate()関数の入力として使用されます。
例:// Variables to store position details double open_price; // Variable to store the entry price of the position double stop_loss; // Variable to store the Stop Loss level of the position double take_profit; // Variable to store the Take Profit level of the position datetime position_open_time; // Variable to store the open time of the position // Define the position index for the first position input int position_index = 1; // POSITION INDEX (Index starts from 0) // Get the ID of the current chart long chart_id = ChartID(); // Store the ID of the current chart string time = "23:59"; // Define a specific time as a string // Define the color for the losing zone input color sl_zonez_color = clrPink; // Choose a color for Losing Zone // Define the color for the winning zone input color tp_zonez_color = clrSpringGreen; // Choose a color for Winning Zone //+------------------------------------------------------------------+ //| Expert tick function | //+------------------------------------------------------------------+ void OnTick() { // Convert the string time to datetime datetime close_zone = StringToTime(time); // Loop through all open positions for(int i = 0; i < PositionsTotal(); i++) { // Get the ticket number of the position at index 'i' ulong ticket = PositionGetTicket(i); // Check if the position matches the specified index and symbol of the current chart if(PositionGetInteger(POSITION_TICKET) == PositionGetTicket(position_index) && PositionGetString(POSITION_SYMBOL) == ChartSymbol(chart_id)) { // Retrieve and store the entry price of the position open_price = PositionGetDouble(POSITION_PRICE_OPEN); // Retrieve and store the Stop Loss level of the position stop_loss = PositionGetDouble(POSITION_SL); // Retrieve and store the Take Profit level of the position take_profit = PositionGetDouble(POSITION_TP); // Retrieve and store the open time of the position position_open_time = (int)PositionGetInteger(POSITION_TIME); // Print the retrieved values for debugging or verification Print("Open Price index ",i,": ",open_price); Print("SL index ",i,": ",stop_loss); Print("TP index ",i,": ",take_profit); Print("Open time index ",i,": ",position_open_time); // Create a rectangle to represent the Stop Loss (SL) zone on the chart ObjectCreate(chart_id, "SL Zone", OBJ_RECTANGLE, 0, position_open_time, open_price, close_zone, stop_loss); // Create a rectangle to represent the Take Profit (TP) zone on the chart ObjectCreate(chart_id, "TP zone", OBJ_RECTANGLE, 0, position_open_time, open_price, close_zone, take_profit); // Set properties for the SL zone rectangle ObjectSetInteger(chart_id, "SL Zone", OBJPROP_COLOR, sl_zonez_color); // Set color to the selected SL zone color ObjectSetInteger(chart_id, "SL Zone", OBJPROP_STYLE, STYLE_SOLID); // Set style to solid ObjectSetInteger(chart_id, "SL Zone", OBJPROP_WIDTH, 1); // Set the width of the rectangle border ObjectSetInteger(chart_id, "SL Zone", OBJPROP_FILL, sl_zonez_color); // Fill the rectangle with the selected SL zone color ObjectSetInteger(chart_id, "SL Zone", OBJPROP_BACK, true); // Set the rectangle to appear behind the chart objects // Set properties for the TP zone rectangle ObjectSetInteger(chart_id, "TP zone", OBJPROP_COLOR, tp_zonez_color); // Set color to the selected TP zone color ObjectSetInteger(chart_id, "TP zone", OBJPROP_STYLE, STYLE_SOLID); // Set style to solid ObjectSetInteger(chart_id, "TP zone", OBJPROP_WIDTH, 1); // Set the width of the rectangle border ObjectSetInteger(chart_id, "TP zone", OBJPROP_FILL, tp_zonez_color); // Fill the rectangle with the selected TP zone color ObjectSetInteger(chart_id, "TP zone", OBJPROP_BACK, true); // Set the rectangle to appear behind the chart objects } } }
説明
このコードは、ポジションの開始時間、SL、TP、およびすべてのポジションの始値を取得します。この情報を使用して、チャート上に2つの可視長方形を描画します。1つは損失の可能性がある領域用、もう1つは利益の可能性がある領域用です。一方、TPまたはSLレベルを指定しないと、これらの長方形のアンカーポイントに問題が生じ、チャート上での配置や表示に影響する可能性があります。正確な可視化を保証するために、この動作を修正するコードを実装します。
if(stop_loss > 0)
  {
// Create a rectangle to represent the Stop Loss (SL) zone on the chart
   ObjectCreate(chart_id, "SL Zone", OBJ_RECTANGLE, 0, position_open_time, open_price, close_zone, stop_loss);
  }


if(take_profit > 0)
  {
// Create a rectangle to represent the Take Profit (TP) zone on the chart
   ObjectCreate(chart_id, "TP zone", OBJ_RECTANGLE, 0, position_open_time, open_price, close_zone, take_profit);
  }
説明
チャート上に対応する長方形を作成する前に、コードスニペットは、ストップロスとテイクプロフィットのレベルが0より大きいことを確認します。SLが設定されている場合(つまり、0より大きい場合)、SLゾーンを表す長方形が描画され、潜在的な損失領域がマークされます。TPが設定されている場合は、TPゾーンを表す別の長方形が作成され、潜在的な利益領域が示されます。無効なアンカーポイントを持つ四角形の作成を防ぐことで、これらのチェックにより、正確なチャートの視覚化が保証されます。
出力: 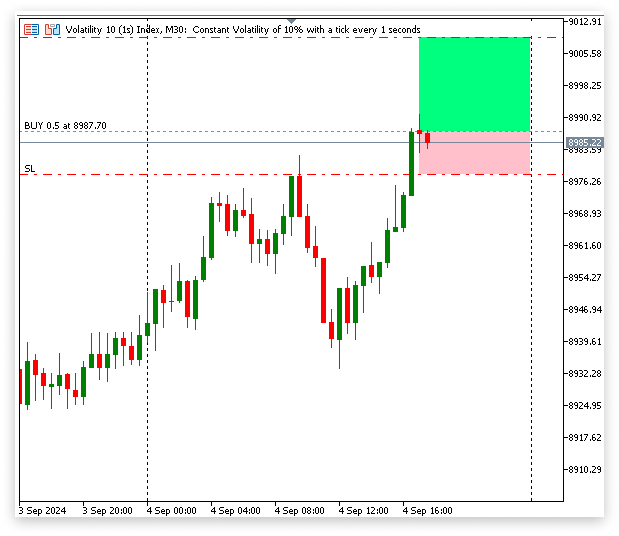
3.1.2. トレンドラインの作成
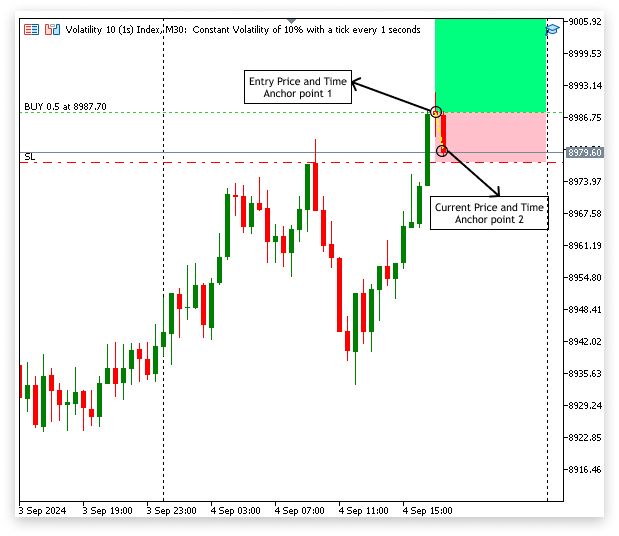
取引が開始されてからの価格変動を説明するために、この部分ではポジションの始値から現在の価格までのトレンドラインを描くことに集中します。この2つのエントリポイントの周辺で市場がどのように変化したかを簡単に確認でき、取引の展開をより徹底的に調査するのに役立ちます。
例:// Get the current ask price double ask = SymbolInfoDouble(_Symbol, SYMBOL_ASK); // Create a trend line object on the chart from the position's open time and price to the current time and ask price ObjectCreate(chart_id, "Trend Line", OBJ_TREND, 0, position_open_time, open_price, TimeCurrent(), ask); // Set the color of the trend line ObjectSetInteger(chart_id, "Trend Line", OBJPROP_COLOR, clrYellow); // Set the style of the trend line to dashed ObjectSetInteger(chart_id, "Trend Line", OBJPROP_STYLE, STYLE_DASH); // Set the width of the trend line ObjectSetInteger(chart_id, "Trend Line", OBJPROP_WIDTH, 2);
出力:
3.1.3. テキストラベルの追加
このフェーズでは、チャートに4つの異なるテキストラベルを付けます。エントリ価格、テイクプロフィット(TP)、ストップロス(SL)、現在の利益はすべてこれらのラベルに表示されます。これらの重要な取引パラメータは、チャート上の各ラベルごとに異なる視覚的な参照を持つため、チャートから取引のステータスを簡単に監視できます。
例:// Variables to store position details double open_price; // Variable to store the entry price of the position double stop_loss; // Variable to store the Stop Loss level of the position double take_profit; // Variable to store the Take Profit level of the position datetime position_open_time; // Variable to store the open time of the position // Define the position index for the first position input int position_index = 1; // POSITION INDEX (Index starts from 0) // Get the ID of the current chart long chart_id = ChartID(); // Store the ID of the current chart string time = "23:59"; // Define a specific time as a string // Define the color for the losing zone input color sl_zonez_color = clrPink; // Choose a color for Losing Zone // Define the color for the winning zone input color tp_zonez_color = clrSpringGreen; // Choose a color for Winning Zone // Define the color for the trend line input color line_zonez_color = clrYellow; // Choose a color for the line //+------------------------------------------------------------------+ //| Expert tick function | //+------------------------------------------------------------------+ void OnTick() { // Get the current ask price double ask = SymbolInfoDouble(_Symbol, SYMBOL_ASK); // Convert the string time to datetime datetime close_zone = StringToTime(time); // Loop through all open positions for(int i = 0; i < PositionsTotal(); i++) { // Get the ticket number of the position at index 'i' ulong ticket = PositionGetTicket(i); // Check if the position matches the specified index and symbol of the current chart if(PositionGetInteger(POSITION_TICKET) == PositionGetTicket(position_index) && PositionGetString(POSITION_SYMBOL) == ChartSymbol(chart_id)) { // Retrieve and store the entry price of the position open_price = PositionGetDouble(POSITION_PRICE_OPEN); // Retrieve and store the Stop Loss level of the position stop_loss = PositionGetDouble(POSITION_SL); // Retrieve and store the Take Profit level of the position take_profit = PositionGetDouble(POSITION_TP); // Retrieve and store the open time of the position position_open_time = (int)PositionGetInteger(POSITION_TIME); if(stop_loss > 0) { // Create a rectangle to represent the Stop Loss (SL) zone on the chart ObjectCreate(chart_id, "SL Zone", OBJ_RECTANGLE, 0, position_open_time, open_price, close_zone, stop_loss); } if(take_profit > 0) { // Create a rectangle to represent the Take Profit (TP) zone on the chart ObjectCreate(chart_id, "TP zone", OBJ_RECTANGLE, 0, position_open_time, open_price, close_zone, take_profit); } // Set properties for the SL zone rectangle ObjectSetInteger(chart_id, "SL Zone", OBJPROP_COLOR, sl_zonez_color); // Set color to the selected SL zone color ObjectSetInteger(chart_id, "SL Zone", OBJPROP_STYLE, STYLE_SOLID); // Set style to solid ObjectSetInteger(chart_id, "SL Zone", OBJPROP_WIDTH, 1); // Set the width of the rectangle border ObjectSetInteger(chart_id, "SL Zone", OBJPROP_FILL, sl_zonez_color); // Fill the rectangle with the selected SL zone color ObjectSetInteger(chart_id, "SL Zone", OBJPROP_BACK, true); // Set the rectangle to appear behind the chart objects // Set properties for the TP zone rectangle ObjectSetInteger(chart_id, "TP zone", OBJPROP_COLOR, tp_zonez_color); // Set color to the selected TP zone color ObjectSetInteger(chart_id, "TP zone", OBJPROP_STYLE, STYLE_SOLID); // Set style to solid ObjectSetInteger(chart_id, "TP zone", OBJPROP_WIDTH, 1); // Set the width of the rectangle border ObjectSetInteger(chart_id, "TP zone", OBJPROP_FILL, tp_zonez_color); // Fill the rectangle with the selected TP zone color ObjectSetInteger(chart_id, "TP zone", OBJPROP_BACK, true); // Set the rectangle to appear behind the chart objects // Create a trend line object on the chart from the position's open time and price to the current time and ask price ObjectCreate(chart_id, "Trend Line", OBJ_TREND, 0, position_open_time, open_price, TimeCurrent(), ask); // Set Trend Line properties ObjectSetInteger(chart_id, "Trend Line", OBJPROP_COLOR, line_zonez_color); ObjectSetInteger(chart_id, "Trend Line", OBJPROP_STYLE, STYLE_DASH); ObjectSetInteger(chart_id, "Trend Line", OBJPROP_WIDTH, 2); // Calculate the profit of the current position double profit = PositionGetDouble(POSITION_PROFIT); // Variables to store the formatted profit text string curent_profits; string profit_to_string; // Check if the profit is positive or zero if(profit >= 0) { // Convert the profit to a string with 2 decimal places profit_to_string = DoubleToString(profit, 2); // Format the profit as a positive amount with a '+' sign curent_profits = StringFormat("+$%s", profit_to_string); } // Check if the profit is negative else if(profit < 0) { // Convert the negative profit to a positive number double profit_to_positive = MathAbs(profit); // Convert the positive profit to a string with 2 decimal places profit_to_string = DoubleToString(profit_to_positive, 2); // Format the profit as a negative amount with a '-' sign curent_profits = StringFormat("-$%s", profit_to_string); } // Create a text label on the chart to display the current profit string text_object_name = "Profit"; ObjectCreate(chart_id, text_object_name, OBJ_TEXT, 0, TimeCurrent(), ask); ObjectSetString(chart_id, text_object_name, OBJPROP_TEXT, curent_profits); // Set the color of the profit text based on whether the profit is positive or negative if(profit > 0) { ObjectSetInteger(chart_id, text_object_name, OBJPROP_COLOR, clrMediumBlue); // Positive profit in blue } else if(profit < 0) { ObjectSetInteger(chart_id, text_object_name, OBJPROP_COLOR, clrRed); // Negative profit in red } // Display the Take Profit (TP) level on the chart string tp_display = "TP"; string t_display = StringFormat("Take Profit: %.5f", take_profit); ObjectCreate(chart_id, tp_display, OBJ_TEXT, 0, close_zone, take_profit); ObjectSetString(chart_id, tp_display, OBJPROP_TEXT, t_display); ObjectSetInteger(chart_id, tp_display, OBJPROP_COLOR, clrBlue); // TP text in blue ObjectSetInteger(chart_id, tp_display, OBJPROP_FONTSIZE, 8); // Set font size for TP // Display the Stop Loss (SL) level on the chart string sl_display = "SL"; string s_display = StringFormat("Stop Loss: %.5f", stop_loss); ObjectCreate(chart_id, sl_display, OBJ_TEXT, 0, close_zone, stop_loss); ObjectSetString(chart_id, sl_display, OBJPROP_TEXT, s_display); ObjectSetInteger(chart_id, sl_display, OBJPROP_COLOR, clrRed); // SL text in red ObjectSetInteger(chart_id, sl_display, OBJPROP_FONTSIZE, 8); // Set font size for SL // Display the Entry Price on the chart string en_display = "Entry Price"; string e_display = StringFormat("Entry Point: %.5f", open_price); ObjectCreate(chart_id, en_display, OBJ_TEXT, 0, close_zone, open_price); ObjectSetString(chart_id, en_display, OBJPROP_TEXT, e_display); ObjectSetInteger(chart_id, en_display, OBJPROP_COLOR, clrPaleVioletRed); // Entry Price text in pale violet red ObjectSetInteger(chart_id, en_display, OBJPROP_FONTSIZE, 8); // Set font size for Entry Price } } }
説明
このコードによって、重要な取引データがチャート上に直接表示されるようになっています。現在のポジション利益を計算し、それをテキストラベルとして表示します。利益がマイナスの場合は赤、プラスの場合は青で表示されます。TPレベル、SLレベル、エントリ価格を視覚的に区別するために、それぞれにテキストラベルも挿入されます。これらのラベルは異なる色で表示されます。ラベルはチャート上に配置されているため、トレーダーは重要なレベルとポジションの現在の利益状況をすばやく識別できます。
出力: 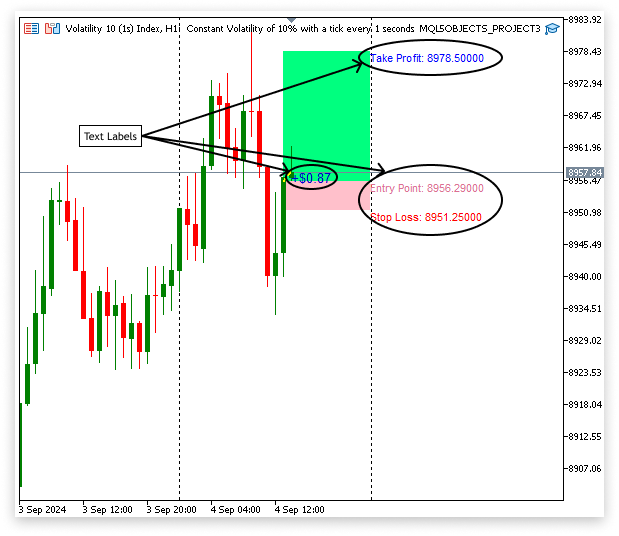
3.2.履歴データのチャートオブジェクトの作成
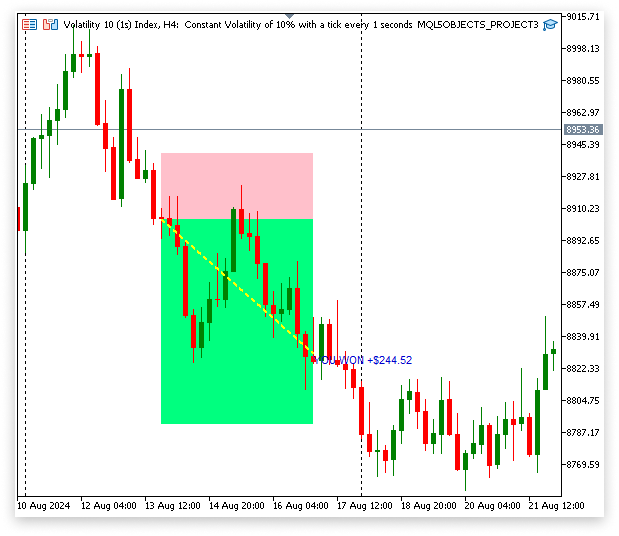
第3章では、現在のポジションを表すチャートオブジェクトの作成について説明しました。ここでは、履歴レコードの処理に焦点を当てます。これにより、チャート上で過去の取引の傾向とデータを確認できます。これにより、以前の取引を調べ、過去の知識を現在の取引計画に適用できます。
例:// Define the position index for the first position input int position_index = 1; // POSITION INDEX (Index starts from 0) // Get the ID of the current chart long chart_id = ChartID(); // Store the ID of the current chart string time = "23:59"; // Define a specific time as a string // Define the color for the losing zone input color sl_zonez_color = clrPink; // Choose a color for Losing Zone // Define the color for the winning zone input color tp_zonez_color = clrSpringGreen; // Choose a color for Winning Zone // Define the color for the trend line input color line_zonez_color = clrYellow; // Choose a color for the line // Define whether to show past history or not input string show_history = "no"; // Type yes to show past history // Define the start date to show history input datetime date1 = D'1970.08.10 00:00:00'; // Show history from this date // Define the end date to show history input datetime date2 = D'2024.08.15 00:00:00'; // To this date //+------------------------------------------------------------------+ //| Expert tick function | //+------------------------------------------------------------------+ void OnTick() { // Check if history display is enabled if(show_history == "yes") { Comment(""); // Clear previous comments // Select deal history within the specified date range bool deal_history = HistorySelect(date1, date2); // Variables to store deal details double deal_close_price = 0.0; double deal_open_price = 0.0; double deal_sl = 0.0; double deal_tp = 0.0; double deal_profit = 0.0; datetime deal_close_time = 0; datetime deal_open_time = 0; // Check if deal history is available if(deal_history) { // Loop through all history deals for(int i = 0; i < HistoryDealsTotal(); i++) { ulong ticket = HistoryDealGetTicket(i); // Check for deal entry in if(HistoryDealGetInteger(ticket, DEAL_ENTRY) == DEAL_ENTRY_IN) { if(HistoryDealGetString(ticket, DEAL_SYMBOL) == ChartSymbol(chart_id)) { deal_open_price = HistoryDealGetDouble(ticket, DEAL_PRICE); deal_open_time = (datetime)HistoryDealGetInteger(ticket, DEAL_TIME); } } // Check for deal entry out if(HistoryDealGetInteger(ticket, DEAL_ENTRY) == DEAL_ENTRY_OUT) { deal_profit = HistoryDealGetDouble(ticket, DEAL_PROFIT); deal_close_price = HistoryDealGetDouble(ticket, DEAL_PRICE); deal_sl = HistoryDealGetDouble(ticket, DEAL_SL); deal_tp = HistoryDealGetDouble(ticket, DEAL_TP); deal_close_time = (datetime)HistoryDealGetInteger(ticket, DEAL_TIME); if(HistoryDealGetString(ticket, DEAL_SYMBOL) == ChartSymbol(chart_id)) { string deal_string; string current_deal_profit; string object_name; // Display deal profit/loss if(deal_profit > 0) { deal_string = DoubleToString(deal_profit, 2); current_deal_profit = StringFormat("YOU WON +$%s", deal_string); object_name = StringFormat("PROFIT %d", i); ObjectCreate(chart_id, object_name, OBJ_TEXT, 0, deal_close_time, deal_close_price); ObjectSetString(chart_id, object_name, OBJPROP_TEXT, current_deal_profit); ObjectSetInteger(chart_id, object_name, OBJPROP_COLOR, clrMediumBlue); ObjectSetInteger(chart_id, object_name, OBJPROP_FONTSIZE,8); } else if(deal_profit < 0) { double deal_to_positive = MathAbs(deal_profit); deal_string = DoubleToString(deal_to_positive, 2); object_name = StringFormat("PROFIT %d", i); current_deal_profit = StringFormat("YOU LOST -$%s", deal_string); ObjectCreate(chart_id, object_name, OBJ_TEXT, 0, deal_close_time, deal_close_price); ObjectSetString(chart_id, object_name, OBJPROP_TEXT, current_deal_profit); ObjectSetInteger(chart_id, object_name, OBJPROP_COLOR, clrRed); ObjectSetInteger(chart_id, object_name, OBJPROP_FONTSIZE,8); } // Display deal SL zone string sl_obj_name = StringFormat("SL ZONE %d", i); if(deal_sl > 0) { ObjectCreate(chart_id, sl_obj_name, OBJ_RECTANGLE, 0, deal_open_time, deal_open_price, deal_close_time, deal_sl); } ObjectSetInteger(chart_id, sl_obj_name, OBJPROP_COLOR, sl_zonez_color); ObjectSetInteger(chart_id, sl_obj_name, OBJPROP_STYLE, STYLE_SOLID); ObjectSetInteger(chart_id, sl_obj_name, OBJPROP_WIDTH, 1); ObjectSetInteger(chart_id, sl_obj_name, OBJPROP_FILL, sl_zonez_color); ObjectSetInteger(chart_id, sl_obj_name, OBJPROP_BACK, true); // Display deal TP zone string tp_obj_name = StringFormat("TP ZONE %d", i); if(deal_tp > 0) { ObjectCreate(chart_id, tp_obj_name, OBJ_RECTANGLE, 0, deal_open_time, deal_open_price, deal_close_time, deal_tp); } ObjectSetInteger(chart_id, tp_obj_name, OBJPROP_COLOR, tp_zonez_color); ObjectSetInteger(chart_id, tp_obj_name, OBJPROP_STYLE, STYLE_SOLID); ObjectSetInteger(chart_id, tp_obj_name, OBJPROP_WIDTH, 1); ObjectSetInteger(chart_id, tp_obj_name, OBJPROP_FILL, tp_zonez_color); ObjectSetInteger(chart_id, tp_obj_name, OBJPROP_BACK, true); // Display deal trend line string line_obj_name = StringFormat("line %d", i); ObjectCreate(chart_id, line_obj_name, OBJ_TREND, 0, deal_open_time, deal_open_price, deal_close_time, deal_close_price); ObjectSetInteger(chart_id, line_obj_name, OBJPROP_COLOR, line_zonez_color); ObjectSetInteger(chart_id, line_obj_name, OBJPROP_STYLE, STYLE_DASH); ObjectSetInteger(chart_id, line_obj_name, OBJPROP_WIDTH, 2); } } } } } }
説明
このコードセクションは、まずshow_history変数の値を評価し、履歴表示機能が有効かどうかを確認します。有効(「はい」)の場合、コードはComment("")を使用してチャート上の以前のコメントを消去し、最新のデータのみが表示されるようにします。次に、結果がdeal_historyというブール変数に格納され、HistorySelect(date1, date2)メソッドで指定された日付範囲内の取引履歴を選択します。これにより、過去の取引データが利用可能となります。 各過去の取引に関するデータは、以下のさまざまな変数に格納されます。終値と始値はdeal_close_priceとdeal_open_priceに、テイクプロフィットとストップロスの値はdeal_tpとdeal_slに、また取引の終値と始値の時刻はdeal_close_timeとdeal_open_timeに記録されます。取引の利益や損失はdeal_profitに記録され、履歴データの活用が容易になります。
このコードは、取引履歴にアクセスできるかどうかを確認し、アクセス可能であればHistoryDealGetTicket(i)を使用して各取引のチケット番号を取得し、すべての取引を反復処理するループを開始します。すべてのチケットについて、エントリ取引とエグジット取引を区別し、エグジット取引では終値、利益、ストップロス、テイクプロフィットの値を取得します。エントリ取引では始値と開始時刻を記録します。これらのデータは、価格変動を示すトレンドライン、利益または損失を示すテキストラベル、テイクプロフィットおよびストップロスのゾーンを表す庁法形などのチャートオブジェクトを生成するために利用されます。このメソッドにより、過去の取引データが効率的に画面に表示され、過去のパフォーマンスについて重要な洞察が得られます。
出力:
結論
この記事では、MQL5のオブジェクト操作に関する詳細を説明し、取引分析を強化するためのチャート要素の作成とカスタマイズに焦点を当てました。具体的には、テイクプロフィットゾーンとストップゾーンを示す庁法形、価格変動を追跡するためのトレンドライン、重要な取引データを表示するテキストラベルの作成方法について解説しました。また、ラベルや視覚的補助ツールを活用して過去の取引データを表示し、過去のパフォーマンスを視覚的に明確に示す方法についても触れました。
MetaQuotes Ltdにより英語から翻訳されました。
元の記事: https://www.mql5.com/en/articles/15764
警告: これらの資料についてのすべての権利はMetaQuotes Ltd.が保有しています。これらの資料の全部または一部の複製や再プリントは禁じられています。
この記事はサイトのユーザーによって執筆されたものであり、著者の個人的な見解を反映しています。MetaQuotes Ltdは、提示された情報の正確性や、記載されているソリューション、戦略、または推奨事項の使用によって生じたいかなる結果についても責任を負いません。
 確率最適化と最適制御の例
 MQL5-Telegram統合エキスパートアドバイザーの作成(第5回):TelegramからMQL5にコマンドを送信し、リアルタイムの応答を受信する
 知っておくべきMQL5ウィザードのテクニック(第37回):線形カーネルとMatérnカーネルによるガウス過程回帰
 古典的な戦略を再構築する(第8回):USDCADをめぐる為替市場と貴金属市場
- 無料取引アプリ
- 8千を超えるシグナルをコピー
- 金融ニュースで金融マーケットを探索
お返事ありがとうございました。