
面向初学者的 MQL4 语言。自定义指标(第 2 部分)
简介
这是“面向初学者的 MQL4 语言”系列的第五篇文章。今天我们将学习使用图形对象,这是个非常强大的开发工具,可以大幅拓宽指标的应用范围。此外,它们可以用于脚本和 Expert Advisor。我们将学习创建对象,更改其参数以及检查错误。当然,我不可能详细地描述所有对象,那也太多了。但你会获得让你能够自主学习这些对象的所有必要知识。本文还包含一个逐步引导你创建复杂信号指标的示例。于此基础上,你可以创建任意信号指标,为多个指标显示所有周期上的交易信号。在这里示例中,很多参数都是可调整的,这样就能轻松更改指标的外观。
关于图形对象
使用 MetaTrader 4 终端时,你经常会和它们打交道。图形对象有很多用途。交易者可以设置支撑位和阻力位、枢轴点、斐波纳契位等。我们来看一个简单的对象用例:
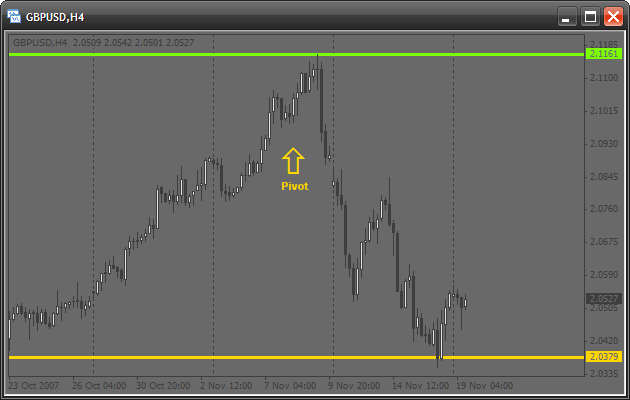
四个图形对象连接到此图表:
- 两条水平线
- 一个文本对象
- 一个对象符号(箭头)
今天我们要学习使用 MQL4 连接此类对象。想象一下,有多少手动操作可以通过使用对象实现自动化!举个例子,你曾手动计算过枢轴点、支撑位和阻力位,然后再手动绘制它们吗?好吧,这个工作量并不算多,但如果在 MQL4 中自动化这个流程,终端会自动计算并绘制对应的价位。你要做的就是双击脚本名称,然后坐等结果。此外,你可以使用图形对象编写非常有用的信号指标。
处理对象的概念
在 MQL4 中处理所有图形对象的算法如下:
- 创建对象
- 修改其参数(移动、更改颜色、板框等)
- 删除对象
这就是一个特定的“生命周期”。现在我们来详细说明各个阶段。
创建图形对象
要绘制任何图形对象,都会用到通用函数 ObjectCreate()。以下是其原型:
bool ObjectCreate(string name, int type, int window, datetime time1,
                  double price1, datetime time2=0,double price2=0,
                  datetime time3=0, double price3=0)
如果一切正常,此函数返回true,如果无法创建对象或出现错误,则返回 false要找出错误代码,使用函数 GetLastError():
if(ObjectCreate(/* arguments */)==false)
{
   // an error occurred, its code should be recorded into a journal
   Print("Error of calling ObjectCreate():",GetLastError());
}
我们要错误代码做什么?它会帮助你找到错误说明,或可消除错误。所有代码说明都包含在:MQL4 参考 -> 标准常数 -> 错误代码中。
我们来仔细看看函数 ObjectCreate() 的所有参数:
- name- 对象的唯一名称。不可用相同名称创建两个对象。此外,此名称将在其他函数中用于更改相关对象表征的参数或移动该对象。
- type - 对象类型。可创建的所有对象类型都包含在:MQL4 参考 -> 标准常数 -> 对象类型中。注意,是否应使用最后一个函数参数取决于对象类型。再看一遍原型。最后四个参数的值是默认分配的:不同的对象在创建时需要不同的数据量。这很简单。假设你需要绘制一个点。你需要什么信息?很明显,需要点的位置。这就够了,不是吗?要绘制一个矩形,我们需要左上角的点和右下角的点的位置。函数 ObjectCreate() 的情况也是如此。这是共通的。所以,它需要一个点的位置来绘制一根水平线,以及两个点的位置来绘制一个线段。要绘制三角形,则需要三个点。所以我们建议你在创建对象时要正确找出绘制时所需的点数。
- window - 绘制对象时所在窗口的编号。如需在图表(即主窗口)上绘制对象,使用0 作为窗口编号。
- time1 - 第一个点的 X 坐标。终端中的 X 轴显示时间,所以要在这里指示时间值。例如,要找出最后一个可用柱的时间,可以使用预定义数组 Time[],具体就是:Time[0]。
- price1- 第一个点的 Y 坐标。终端中的 Y 轴显示价格,所以要使用价格值。例如,使用预定义数组 Open[]、Close[] 等。
-
other arguments 指两对类似的坐标,用于定义绘制更复杂的对象时所需的点。如果对象很简单,就无需使用这些参数。
创建对象的示例。绘制线条
现在,为了更好地理解,我们来绘制几个线条。我们标记最后一天的最低价和最高价。首先我们需要创建一个新脚本,并更改函数 start():
int  start()
{
   double price=iHigh(Symbol(),PERIOD_D1,0);
   // this useful function returns the maximal price for:
   // * specified security, in our case it is Symbol() -
   //   active security
   // * specified period, in our case it is PERIOD_D1 (daily)
   // * specified bar, in our case it is 0, the last bar

   ObjectCreate("highLine",OBJ_HLINE,0,0,price);
   // let us view all parameters:
   // "highLine" - the unique object name
   // OBJ_HLINE - object type of the horizontal line
   // 0 - the object is drawn in the main window (chart window)
   // 0 - X coordinate (time), it shouldn't be indicated, because
   //     we are drawing a horizontal line
   // price - Y coordinate (price). It is the maximal price

   price=iLow(Symbol(),PERIOD_D1,0);
   // the function is identical with iHigh in arguments, but it returns
   // the minimal price

   ObjectCreate("lowLine",OBJ_HLINE,0,0,price);

   return(0);
}
当然我们已经忽略了错误检查步骤。所以要是你给两个对象取了同一个名称,那可不能怪我。启动脚本后,显示如下:
线条是绘制了,但有个地方我不太喜欢。红色太深了,所以建议使用浅色调。一般来说可以设置线条外观。
修改对象属性。设置线条外观
有一个特殊函数可用于设置已创建图形对象的参数。这个函数就是ObjectSet()。其原型如下:
bool ObjectSet( string name, int index, double value);
和上一个函数类似,如果一切正常,返回true,如果无法创建对象或出现错误,则返回false。例如你指定了一个不存在的对象名称。我们来看看此函数的参数:
- name - 已创建对象的名称。开始修改之前,确保有使用这个名称的对象存在。
- index - 要修改的对象属性的索引。所有索引都可在以下位置找到:MQL4 参考 -> 标准常数 -> 对象属性。此函数也是通用函数。它的工作原理如下:你指定要修改的属性以及要分配给此属性的值。
- value - 选定属性应更改至的目标值。例如,如果你要更改颜色,那就在这里指定一个新颜色。
现在让我们更改我们的线条,即其颜色、线宽和样式。更改start() 函数:
int  start()
{
   double price=iHigh(Symbol(),PERIOD_D1,0);

   ObjectCreate("highLine",OBJ_HLINE,0,0,price);
   price=iLow(Symbol(),PERIOD_D1,0);
   ObjectCreate("lowLine",OBJ_HLINE,0,0,price);

   ObjectSet("highLine",OBJPROP_COLOR,LimeGreen);
   // changing the color of the upper line
   ObjectSet("highLine",OBJPROP_WIDTH,3);
   // now the line will be 3 pixel wide

   ObjectSet("lowLine",OBJPROP_COLOR,Crimson);
   // changing the color of the lower line
   ObjectSet("lowLine",OBJPROP_STYLE,STYLE_DOT);
   // now the lower line will be dashed

   return(0);
}
你会在图表上看到以下内容:
删除对象
你会经常需要删除旧的或不需要的对象。以下几个函数就能实现这个目的:
bool ObjectDelete(string name);
此函数删除使用指定名称的对象。如果指示了一个不存在的名称,则返回“false”。
int ObjectsDeleteAll(int window=EMPTY,int type=EMPTY);
这是一个高级函数,它返回已删除对象的数量。它还有默认值。如果没有指定任何参数,终端将删除活动图表的所有对象:
ObjectsDeleteAll();
// deleting all objects
如果你在一个子窗口(例如在某个指标的窗口中)中创建了一个对象,可通过在第一个参数中指定此窗口的编号来删除其所有对象。子窗口稍后会再讨论,所以现在我们在第一个参数中指示 0。
如果需要删除某特定类型的所有对象,那就在第二个参数中指定此类型:
ObjectsDeleteAll(0, OBJ_ARROW);
// deleting all arrows
如何正确使用所有这些东西?
你可能认为你需要很多知识才能把这些都运用自如。例如,应了解对象的所有这些属性和类型。但是事实上并非如此。所有东西都能在“用户指南”中找到。
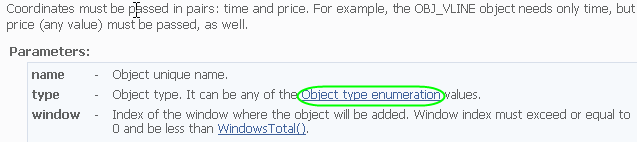
首先打开工具箱 (CTRL+T)。底部有数个选项卡,选择帮助。假设你需要绘制一个图形对象,但不知道该怎么做。此时应使用函数ObjectCreate() 。写入此函数,将参数留空。现在将光标放在函数名称内,然后按 F1。“帮助”窗口将显示关于此函数的信息。这意味着你无需搜索任何东西。现在来看函数说明。函数说明后面是其所有参数的说明。注意参数 type(类型)的说明:
它包含一个链接。单击此链接,便可看到现有对象的列表。假设你想要绘制一个椭圆形:
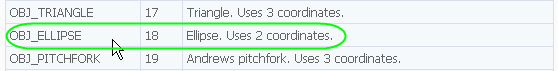
阅读说明,你会发现需要两个坐标。让我们开始吧:
int  start()
{
   ObjectCreate("ellipse",OBJ_ELLIPSE,0,Time[100],Low[100],Time[0],High[0]);
   // indicate 2 points for creating an ellipse:
   // * 1st - lower left point
   // * 2nd - upper right point

   return(0);
}
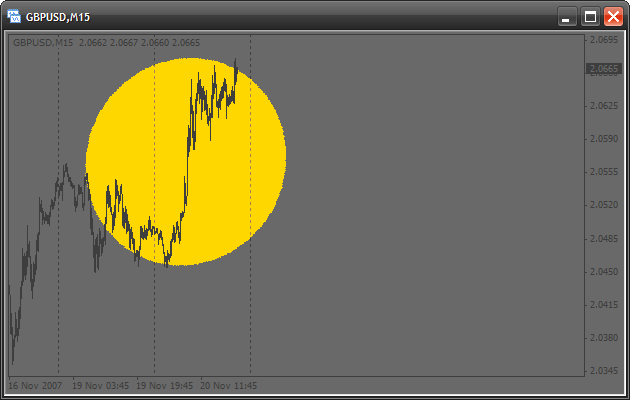
我们也会看到,属性OBJPROP_SCALE决定了边的关联性。所以,如果我们将其设为 1,我们会获得一个圆形:
int  start()
{
   ObjectsDeleteAll();
   // clear the chart before drawing

   ObjectCreate("ellipse",OBJ_ELLIPSE,0,Time[100],Low[100],Time[0],High[0]);

   ObjectSet("ellipse",OBJPROP_SCALE,1.0);
   // change the correlation of sides
   ObjectSet("ellipse",OBJPROP_COLOR,Gold);
   // change the color

   return(0);
}
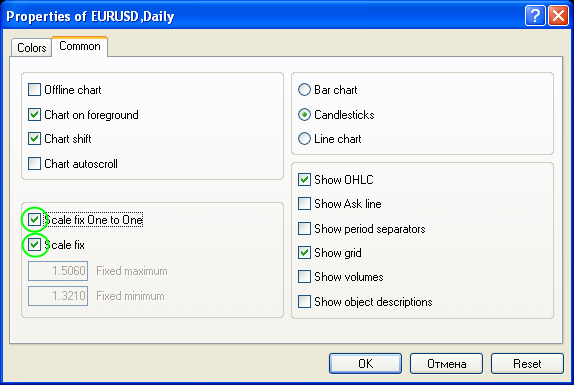
我可以肯定你也不想画个圆圈,因为 1:1 比例应该在图表属性中设置(右键单击图表任意空白处,并选择属性):
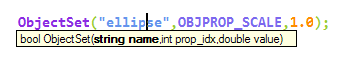
看,一切都很简单。实际上你可以将光标放在任何关键字上,并按F1,之后就会看到“帮助”中的对应信息。所以你无需记住所有类型和属性的名称,使用内置”帮助“便可快速有效地编写代码。MetaEditor 还有一个非常重要的属性,可以帮助你编写代码:在内置函数中编写参数时,按 CTRL + SHIFT + 空格键。你会看到相关提示和函数原型:
在子窗口中创建图形对象
如果你需要在子窗口(例如在自定义指标的窗口)中绘制图形对象,你应该要知道其编号。举个例子,我们将编写一个简单的指标,用其在单独窗口中绘制一条水平线。创建一个自定义指标并在代码中添加以下内容:
//+------------------------------------------------------------------+
//|                                   creatingObjectsInSubWindow.mq4 |
//|                                                     Antonuk Oleg |
//|                                            antonukoleg@gmail.com |
//+------------------------------------------------------------------+
#property copyright "Antonuk Oleg"
#property link      "antonukoleg@gmail.com"

#property indicator_separate_window
// indicator will be written in a separate window
#property indicator_minimum 1
// minimal indicator value is 1
#property indicator_maximum 10
// maximal is 10

//+------------------------------------------------------------------+
//| Custom indicator initialization function                         |
//+------------------------------------------------------------------+
int init()
{
   IndicatorShortName("NiceLine");
   // this simple function sets a short indicator name,
   // you see it in the upper left corner of any indicator.
   // What for do we need it? The function WindowFind searches a subwindow
   // with a specified short name and returns its number.

   int windowIndex=WindowFind("NiceLine");
   // finding the window number of our indicator

   if(windowIndex<0)
   {
      // if the number is -1, there is an error
      Print("Can\'t find window");
      return(0);
   }

   ObjectCreate("line",OBJ_HLINE,windowIndex,0,5.0);
   // drawing a line in the indicator subwindow

   ObjectSet("line",OBJPROP_COLOR,GreenYellow);
   ObjectSet("line",OBJPROP_WIDTH,3);

   WindowRedraw();
   // redraw the window to see the line

   return(0);
}
//+------------------------------------------------------------------+
//| Custom indicator deinitialization function                       |
//+------------------------------------------------------------------+
int deinit()
{
   ObjectsDeleteAll();
   // delete all objects

   return(0);
}
//+------------------------------------------------------------------+
//| Custom indicator iteration function                              |
//+------------------------------------------------------------------+
int start()
{
   return(0);
}
启动指标。没看到水平线!
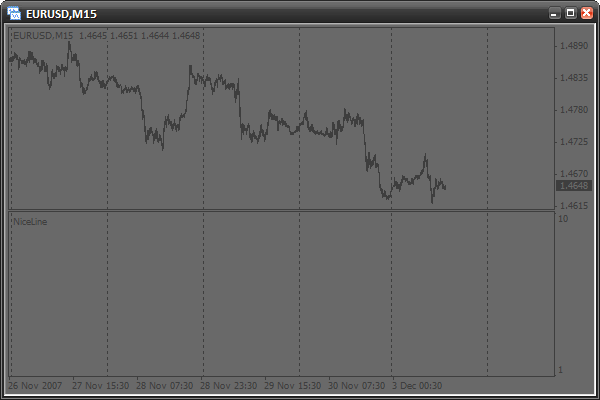
我们需要更改图表周期。
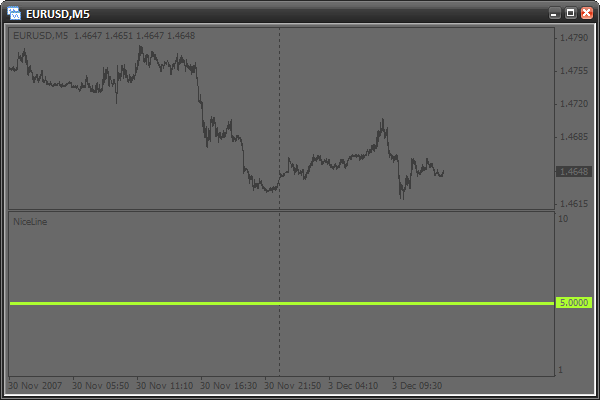
现在能看到了。发生了什么事?事实上,如果函数 init() 是首次启动, 那么函数内是找不到子窗口编号的。原因也许是终端在初始化期间还尚未创建子窗口吧。有一种方法可以避免这种情况 - 创建窗口后,所有操作都在函数 start()中执行,如下所示:
//+------------------------------------------------------------------+
//|                                   creatingObjectsInSubWindow.mq4 |
//|                                                     Antonuk Oleg |
//|                                            antonukoleg@gmail.com |
//+------------------------------------------------------------------+
#property copyright "Antonuk Oleg"
#property link      "antonukoleg@gmail.com"

#property indicator_separate_window
#property indicator_minimum 1
#property indicator_maximum 10

bool initFinished=false;
// adding a variable that will remember the initialization state.
// false - there was no initialization
// true - there was initialization

//+------------------------------------------------------------------+
//| Custom indicator initialization function                         |
//+------------------------------------------------------------------+
int init()
{
   return(0);
}
//+------------------------------------------------------------------+
//| Custom indicator deinitialization function                       |
//+------------------------------------------------------------------+
int deinit()
{
   ObjectsDeleteAll();
   // deleting all objects

   return(0);
}
//+------------------------------------------------------------------+
//| Custom indicator iteration function                              |
//+------------------------------------------------------------------+
int start()
{
   if(initFinished==false)
   {
      IndicatorShortName("NiceLine");

      int windowIndex=WindowFind("NiceLine");

      if(windowIndex<0)
      {
         // if the subwindow number is -1, there is an error
         Print("Can\'t find window");
         return(0);
      }

      ObjectCreate("line",OBJ_HLINE,windowIndex,0,5.0);
      // drawing a line in the indicator subwindow

      ObjectSet("line",OBJPROP_COLOR,GreenYellow);
      ObjectSet("line",OBJPROP_WIDTH,3);

      WindowRedraw();
      // redraw the window to see the line

      initFinished=true;
      // drawing is finished
   }

   return(0);
}
现在所有东西都将第一次开始绘制。这里你应该记住的是,子窗口编号是在函数 start() 中找出的,而不是 init()。
做一些练习
试着使用“帮助”学习一些新的图形对象类型。之后,编写一个可以绘制它们并设置参数的脚本。把这个研究清楚,做一些练习,之后再继续阅读本文。
编写一个信号指标。这是什么?
想象一下这个情景。交易者使用多个指标来做入市的相关决策:移动平均线、抛物线转向指标和威廉指标。这些是内置指标,见下图:
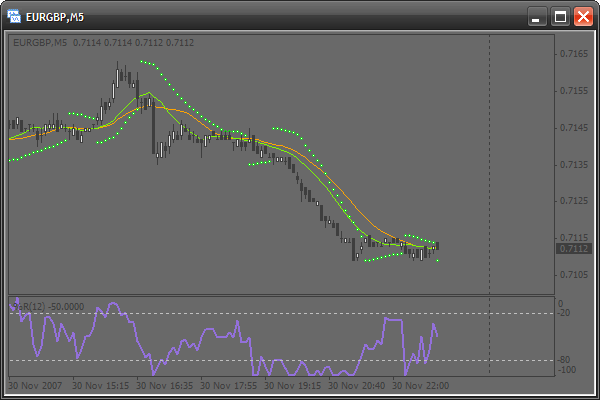
交易者不断通过以下方式评估市场情况:当三个指标之一发出信号时,就是进场的时候。
- 如果快速移动平均线在慢速移动平均线的上方,就是一个买入信号。反之就是卖出信号。
- 如果价格在抛物线转向指标的下方,就是一个卖出信号。反之就是买入信号。
- 如果 WPR 大于 -20,就是一个买入信号。如果 WPR 小于 -80,就是一个卖出信号。
交易者必须不断检查所有条件,还要试着跟踪多个周期的情况。这是个繁重的工作。所以,一个可以执行所有检查的信号指标可以帮到他:
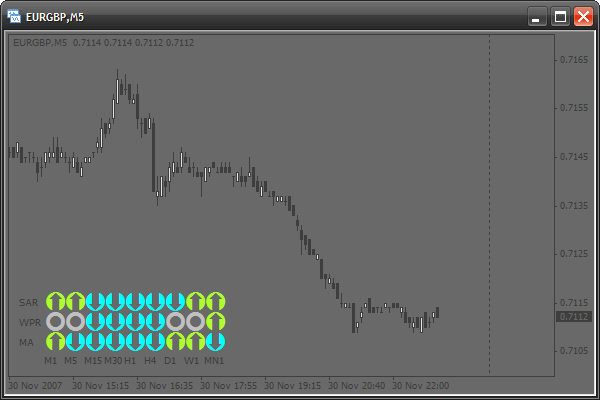
今天我们将学会解决这个问题。我们将编写一个信号指标,你可以很轻松地设置它。此外,你可以以此为基础轻松自行修改你喜爱的指标。
基础知识
创建此指标时,我们将面临一些绘制方面的问题。所有图形对象都是用价格坐标和时间坐标绘制的。因此,绘制内容一直在变化。为了使对象保持在一个位置,我们需要不断更改其坐标。但如果你要查看先前的内容并移动图表位置,信号表也会移位。然而凡事皆有例外。图形对象中,有一个对象名为 OBJ_LABEL。它是一个文本标记,但它定位的不是价格和时间,而是像素形式的窗口坐标。这很简单:
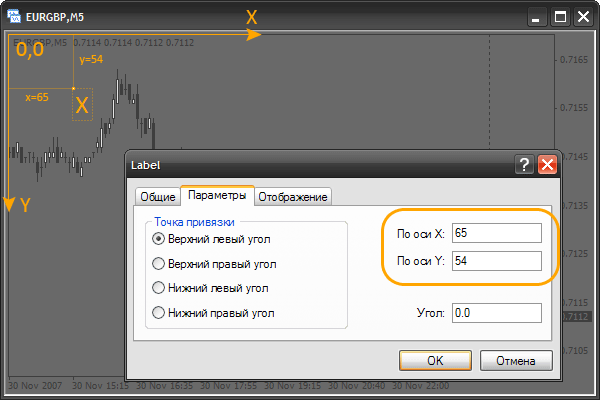
我们看到一个常见的文本符号“X”。在其参数中,你可以看到它的坐标是用像素来指定的。像素就是屏幕上最小的点。注意,左上角的坐标是:x=0, y=0 (0,0)。如果我们增大 x,对象将向右移动,如果我们减小它,则对象向左移动。y坐标也是如此。它可以向上或向下移动。务必了解并记住这个原则。要进行实践,可以创建一个标记并移动它的位置,看它的坐标在属性中的变化情况。你还可以通过移动图表位置来查看旧报价。此时标记不会移位。我们可以使用此类标记创建信号指标,而不会有上述不利之处。
文本标记的选项
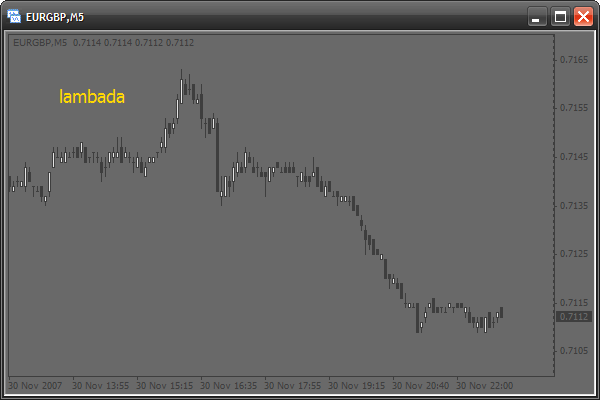
我们的信号指标将仅使用文本标记。那么我们来详细说说这些指标的选项。首先,创建一个新指标(不使用数据缓冲区和参数),并更改函数 init():
int init()
{
   // now we will crate a text mark.
   // for this use the function ObjectCreate.
   // do not indicate coordinates
   ObjectCreate("signal",OBJ_LABEL,0,0,0,0,0);

   // change the x-coordinate
   ObjectSet("signal",OBJPROP_XDISTANCE,50);

   // change the y-coordinate
   ObjectSet("signal",OBJPROP_YDISTANCE,50);

   // to indicate the mark text, use the following function
   ObjectSetText("signal","lambada",14,"Tahoma",Gold);
   // "signal" - object name
   // "lambada" - text
   // 14 - font size
   // Gold - color

   return(0);
}
看,一切都很简单。ObjectCreate()函数将仅在初始化中用于创建所有必要的对象。我们可以根据函数 start() 中每次价格变动,使用 ObjectSetText() 更改对象的外观。start()。我们还需要更改函数 deinit():
int deinit()
{
   // when deleting the indicator delete all objects
   ObjectsDeleteAll();

   return(0);
}
现在启动指标并查看结果:
我们将使用标记的以下选项:
- 将字体更改为 Wingdings,以便能够使用特殊符号(方块、圆圈、笑脸等等):
- 我们将更改标记的颜色和文本
- 我们将更改标记的位置和大小
使用字体 Wingdings
让我们用 Wingdings 字体创建一个标记。更改init()函数:
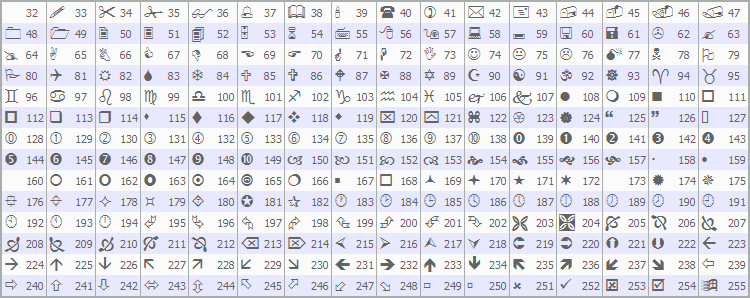
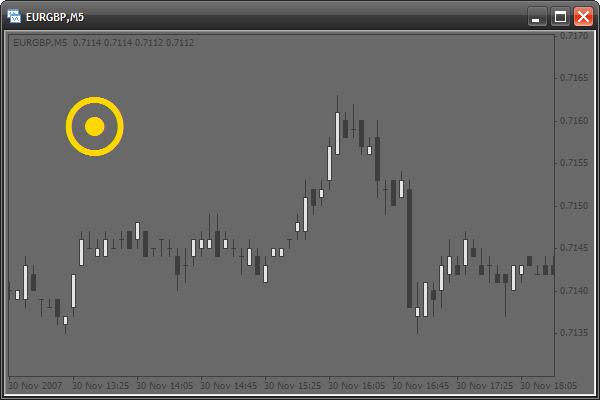
int init()
{

   ObjectCreate("signal",OBJ_LABEL,0,0,0,0,0);
   ObjectSet("signal",OBJPROP_XDISTANCE,50);
   ObjectSet("signal",OBJPROP_YDISTANCE,50);

   // use symbols from the Wingdings font
   ObjectSetText("signal",CharToStr(164),60,"Wingdings",Gold);
   // CharToStr() - this function returns a line with a single
   // symbol, the code of which is specified in the single argument.
   // Simply select a symbol from the table above and write
   // its number into this function
   // 60 - use large font
   // "Wingdings" - use font Wingdings

   return(0);
}
结果如下:
绘制信号表的模型
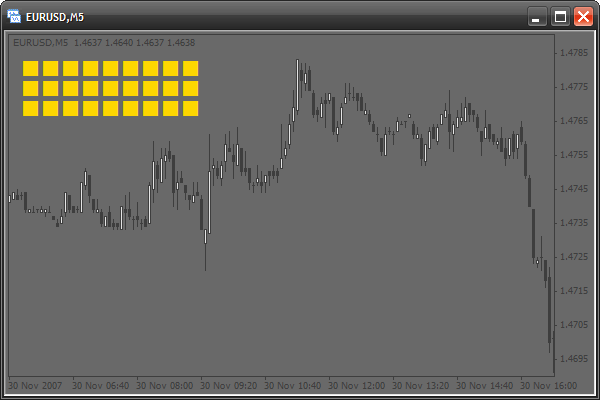
现在让我们绘制一个信号表的模型。实际上这个模型是大量的方块组成的:
int init()
{
   // use 2 cycles. The first cycle, with the counter "x" draws one by one
   // each column from left to wright. The second cycle draws symbols of each
   // column from top downward. At each iteration the cycle will create a mark.
   // These 2 cycles create 9 columns (9 periods) 3 marks each (3 signal types).
   for(intx=0;x<9;x++)
      for(inty=0;y<3;y++)
      {
         ObjectCreate("signal"+x+y,OBJ_LABEL,0,0,0,0,0);
         // create the next mark, Note that the mark name
         // is created "on the fly" and depends on "x" and "y" counters

         ObjectSet("signal"+x+y,OBJPROP_XDISTANCE,x*20);
         // change the X coordinate.
         // x*20 - each mark is created at the interval of 20 pixels
         // horizontally and directly depends on the "x" counter

         ObjectSet("signal"+x+y,OBJPROP_YDISTANCE,y*20);
         // change the Y coordinate.
         // y*20 - each mark is created at the interval of 20 pixels
         // vertically and directly depends on the "y" counter

         ObjectSetText("signal"+x+y,CharToStr(110),20,"Wingdings",Gold);
         // use the 110th symbol code (square)
      }

   return(0);
}
模式准备就绪。我们来添加左方和上方的缩进,以便可以看到终端文本:
int init()
{
   for(int x=0;x<9;x++)
      for(int y=0;y<3;y++)
      {
         ObjectCreate("signal"+x+y,OBJ_LABEL,0,0,0,0,0);
         ObjectSet("signal"+x+y,OBJPROP_XDISTANCE,x*20+12);
         // adding a horizontal indent 12 pixels
         ObjectSet("signal"+x+y,OBJPROP_YDISTANCE,y*20+20);
         // adding a vertical indent 20 pixels
         ObjectSetText("signal"+x+y,CharToStr(110),20,"Wingdings",Gold);
      }

   return(0);
}
激活此模式
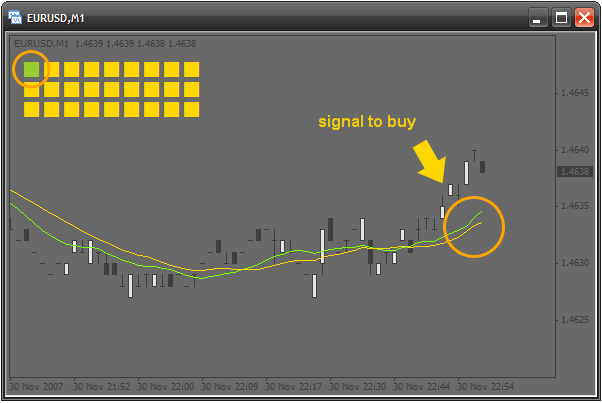
现在让我们对其中至少一个方块进行操作。假设左上角的方块将在分钟时间范围 (M1) 上显示一个移动平均线信号。如果这是个买入信号,那么这个方块将变为绿色。如果是卖出信号,则变为红色。我们需要更改函数start():
int start()
{
   // if quick moving average (period - 13) is larger than the slow one,
   // this is a signal to buy. Check the last bar
   if(iMA(Symbol(),1,13,0,0,0,0)>iMA(Symbol(),1,24,0,0,0,0))
      ObjectSetText("signal00",CharToStr(110),20,"Wingdings",YellowGreen);
   // change the color of the mark named "signal00" (the upper left)
   // into green

   else
   // else, if the quick MA is smaller than the slow one, this is a signal to sell.
      ObjectSetText("signal00",CharToStr(110),20,"Wingdings",Tomato);
      // change the color into red

   return(0);
}
激活上行
我们继续进行激活。左方块指示最小的时间范围 - M1。现在我们要让每个方块指示的时间范围都大于上一个方块。所以,第二个方块显示 M5 上的信号,第三个方块显示 M15 上的信号,以此类推,直至 MN1。当然,这些工作都将在循环中完成。所要更改的内容是名称和周期。我们有 0 个方块,所以我们使用 1 个计数器。但我们面临一个与周期相关的问题,就是周期的变化毫无规律可言。看:
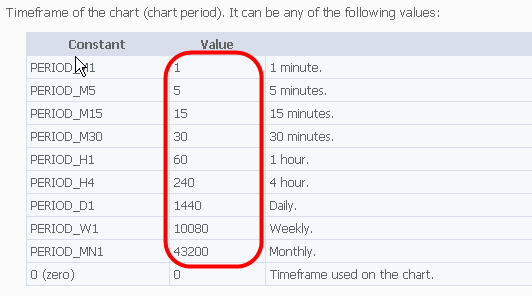
有人会认为,既然没有什么规律,就不能使用循环。并非如此。我们需要做的只是在指标代码开头声明一个特殊数组:
//////////////////////////////////////////////////////////////////////
//
//                                                  signalTable.mq4
//                                                     Antonuk Oleg
//                                            antonukoleg@gmail.com
//
//////////////////////////////////////////////////////////////////////
#property copyright "Antonuk Oleg"
#property link      "antonukoleg@gmail.com"

#property indicator_chart_window

intperiod[]={1,5,15,30,60,240,1440,10080,43200};
所有周期都已记录到这个数组中,现在可以很轻松地在循环中使用它们:
int start()
{
   // use a cycle to activate all squares of the first line
   for(int x=0;x<9;x++)
   {
      if(iMA(Symbol(),period[x],13,0,0,0,0)>iMA(Symbol(),period[x],24,0,0,0,0))
         ObjectSetText("signal"+x+"0",CharToStr(110),20,"Wingdings",YellowGreen);
         // "signal"+x+"0" - create a mark name dynamically depending on
         // the counter "x"
      else
         ObjectSetText("signal"+x+"0",CharToStr(110),20,"Wingdings",Tomato);
   }

   return(0);
}
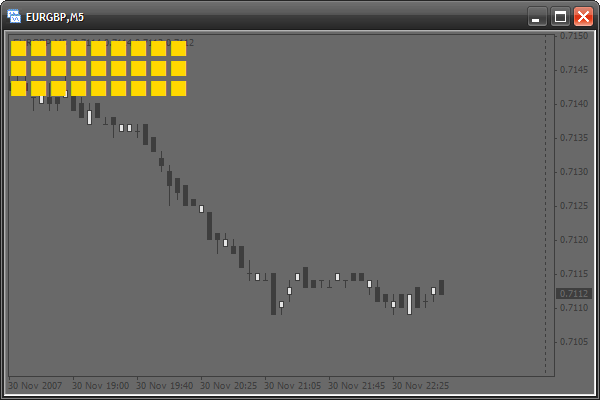
我们将数组 period[] 用作“X”计数器和周期的对应表。想象一下,如果没有这个小小的数组,我们需要写多少代码!好了,第一行信号方块就绪,如下所示:
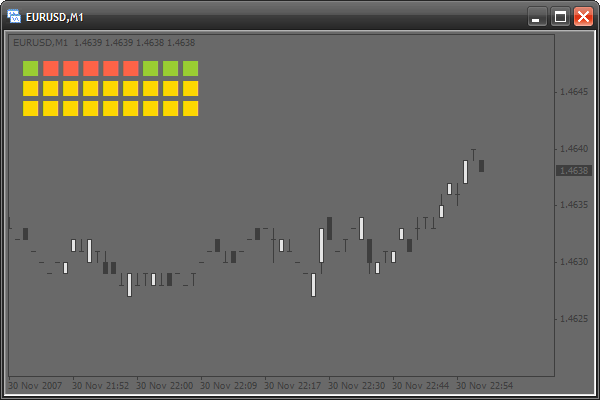
添加文字
一切正常,不过弄清楚方块的时间范围有点难,所以我们要创建说明性签名。我们还将使用一个对应性数组,它们将存储各列的文字:
#property indicator_chart_window

int period[]={1,5,15,30,60,240,1440,10080,43200};

stringperiodString[]={"M1","M5","M15","M30","H1","H4","D1","W1","MN1"};
将通过以下循环在init()中创建这些文字:
int init()
{
   for(int x=0;x<9;x++)
      for(int y=0;y<3;y++)
      {
         ObjectCreate("signal"+x+y,OBJ_LABEL,0,0,0,0,0);
         ObjectSet("signal"+x+y,OBJPROP_XDISTANCE,x*20+12);
         ObjectSet("signal"+x+y,OBJPROP_YDISTANCE,y*20+20);
         ObjectSetText("signal"+x+y,CharToStr(110),20,"Wingdings",Gold);
      }

   // create writings for periods from left to right
   for(x=0;x<9;x++)
   {
      // everything is as usual
      ObjectCreate("textPeriod"+x,OBJ_LABEL,0,0,0,0,0);
      ObjectSet("textPeriod"+x,OBJPROP_XDISTANCE,x*20+12);
      ObjectSet("textPeriod"+x,OBJPROP_YDISTANCE,10);
      ObjectSetText("textPeriod"+x,periodString[x],8,"Tahoma",Gold);
      // we use the array periodString[], to indicate writings
   }

   return(0);
}
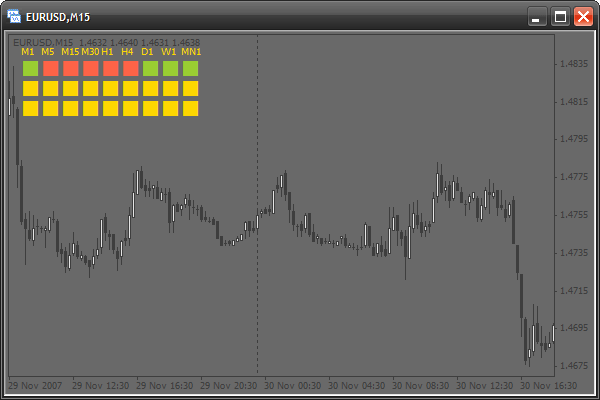
添加一些参数
为了让指标变得更灵活一些,我们可以添加一些参数,以便用户可以设置指标的外部视图:
#property copyright "Antonuk Oleg"
#property link      "antonukoleg@gmail.com"

#property indicator_chart_window

extern int scaleX=20, // horizontal interval at which the squares are created
           scaleY=20, // vertical interval
           offsetX=35, // horizontal indent of all squares
           offsetY=20, // vertical indent
           fontSize=20; // font size

int period[]={1,5,15,30,60,240,1440,10080,43200};
string periodString[]={"M1","M5","M15","M30","H1","H4","D1","W1","MN1"};
我们再来更改函数init()和start():
int init()
{
   for(int x=0;x<9;x++)
      for(int y=0;y<3;y++)
      {
         ObjectCreate("signal"+x+y,OBJ_LABEL,0,0,0,0,0);
         ObjectSet("signal"+x+y,OBJPROP_XDISTANCE,x*scaleX+offsetX);
         ObjectSet("signal"+x+y,OBJPROP_YDISTANCE,y*scaleY+offsetY);
         ObjectSetText("signal"+x+y,CharToStr(110),fontSize,"Wingdings",Gold);
      }

   for(x=0;x<9;x++)
   {
      ObjectCreate("textPeriod"+x,OBJ_LABEL,0,0,0,0,0);
      ObjectSet("textPeriod"+x,OBJPROP_XDISTANCE,x*scaleX+offsetX);
      ObjectSet("textPeriod"+x,OBJPROP_YDISTANCE,offsetY-10);
      ObjectSetText("textPeriod"+x,periodString[x],8,"Tahoma",Gold);
   }

   return(0);
}

int start()
{
   for(int x=0;x<9;x++)
   {
      if(iMA(Symbol(),period[x],13,0,0,0,0)>iMA(Symbol(),period[x],24,0,0,0,0))
         ObjectSetText("signal"+x+"0",CharToStr(110),fontSize,"Wingdings",YellowGreen);
      else
         ObjectSetText("signal"+x+"0",CharToStr(110),fontSize,"Wingdings",Tomato);
   }

   return(0);
}
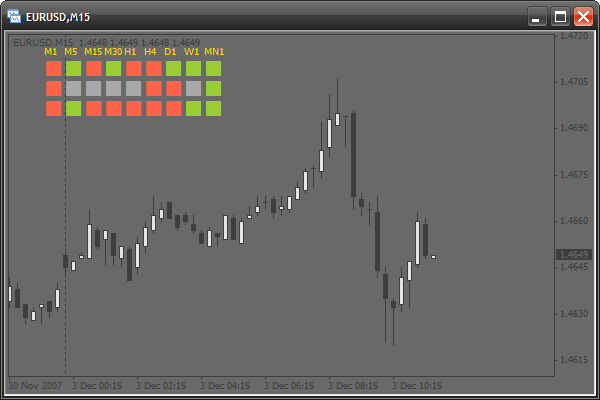
激活其他行
第二行指示威廉指标的信号,第三行指示抛物线转向指标 的信号。修改函数start():
int start()
{
   for(int x=0;x<9;x++)
   {
      if(iMA(Symbol(),period[x],13,0,0,0,0)>iMA(Symbol(),period[x],24,0,0,0,0))
         ObjectSetText("signal"+x+"0",CharToStr(110),fontSize,"Wingdings",YellowGreen);
      else
         ObjectSetText("signal"+x+"0",CharToStr(110),fontSize,"Wingdings",Tomato);
   }

   // activate the second row
   for(x=0;x<9;x++)
   {
      // if the absolute value of WPR is lower than 20, this is a signal to buy
      if(MathAbs(iWPR(Symbol(),period[x],13,0))<20.0)
         ObjectSetText("signal"+x+"1",CharToStr(110),fontSize,"Wingdings",YellowGreen);
      // if the absolute value of WPR is larger than 80, this is a signal to sell
      else if(MathAbs(iWPR(Symbol(),period[x],13,0))>80.0)
         ObjectSetText("signal"+x+"1",CharToStr(110),fontSize,"Wingdings",Tomato);
      // else, if there are no signals, a square is painted gray
      else
         ObjectSetText("signal"+x+"1",CharToStr(110),fontSize,"Wingdings",DarkGray);
   }

   // activate the third row
   for(x=0;x<9;x++)
   {
      // if the current price is larger than the value of SAR, this is a signal to buy
      if(iSAR(Symbol(),period[x],0.02,0.2,0)<Close[0])
         ObjectSetText("signal"+x+"2",CharToStr(110),fontSize,"Wingdings",YellowGreen);
      // otherwise, it is a signal to sell
      else
         ObjectSetText("signal"+x+"2",CharToStr(110),fontSize,"Wingdings",Tomato);
   }

   return(0);
}
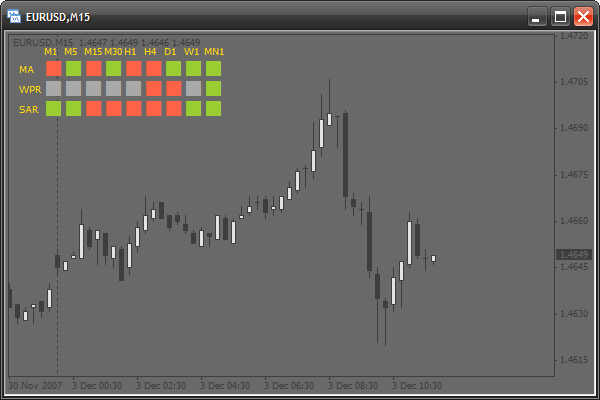
添加信号名称
现在我们为各行设置一个名称。我们像之前那样用数组在左侧创建三个文字图标。
int period[]={1,5,15,30,60,240,1440,10080,43200};
string periodString[]={"M1","M5","M15","M30","H1","H4","D1","W1","MN1"},
       // create one more array with indicator names
string signalNameString[]={"MA","WPR","SAR"};
更改init():
int init()
{
   for(int x=0;x<9;x++)
      for(int y=0;y<3;y++)
      {
         ObjectCreate("signal"+x+y,OBJ_LABEL,0,0,0,0,0);
         ObjectSet("signal"+x+y,OBJPROP_XDISTANCE,x*scaleX+offsetX);
         ObjectSet("signal"+x+y,OBJPROP_YDISTANCE,y*scaleY+offsetY);
         ObjectSetText("signal"+x+y,CharToStr(110),fontSize,"Wingdings",Gold);
      }

   for(x=0;x<9;x++)
   {
      ObjectCreate("textPeriod"+x,OBJ_LABEL,0,0,0,0,0);
      ObjectSet("textPeriod"+x,OBJPROP_XDISTANCE,x*scaleX+offsetX);
      ObjectSet("textPeriod"+x,OBJPROP_YDISTANCE,offsetY-10);
      ObjectSetText("textPeriod"+x,periodString[x],8,"Tahoma",Gold);
   }

   // draw signal names from top downwards
   for(y=0;y<3;y++)
   {
      ObjectCreate("textSignal"+y,OBJ_LABEL,0,0,0,0,0);
      ObjectSet("textSignal"+y,OBJPROP_XDISTANCE,offsetX-25);
      ObjectSet("textSignal"+y,OBJPROP_YDISTANCE,y*scaleY+offsetY+8);
      ObjectSetText("textSignal"+y,signalNameString[y],8,"Tahoma",Gold);
   }

   return(0);
}
添加更改绑定角的选项
现在我们将添加一个选择信号指标位置的选项。现在将它绑定到左上角。如果我们更改标记属性OBJPROP_CORNER,则角将发生更改。此属性可以取以下值:
- 0 - 左上角
- 1 - 右上角
- 2 - 左下角
- 3 - 右下角
那么,我们来添加一个新参数 - corner:
#property indicator_chart_window

extern int scaleX=20,
           scaleY=20,
           offsetX=35,
           offsetY=20,
           fontSize=20,
           corner=0; // adding a parameter for choosing a corner
更改函数init():
int init()
{
   // a table of signals
   for(int x=0;x<9;x++)
      for(int y=0;y<3;y++)
      {
         ObjectCreate("signal"+x+y,OBJ_LABEL,0,0,0,0,0);
         ObjectSet("signal"+x+y,OBJPROP_CORNER,corner);
         // change the corner
         ObjectSet("signal"+x+y,OBJPROP_XDISTANCE,x*scaleX+offsetX);
         ObjectSet("signal"+x+y,OBJPROP_YDISTANCE,y*scaleY+offsetY);
         ObjectSetText("signal"+x+y,CharToStr(110),fontSize,"Wingdings",Gold);
      }

   // name of timeframes
   for(x=0;x<9;x++)
   {
      ObjectCreate("textPeriod"+x,OBJ_LABEL,0,0,0,0,0);
      ObjectSet("textPeriod"+x,OBJPROP_CORNER,corner);
      // changing the corner
      ObjectSet("textPeriod"+x,OBJPROP_XDISTANCE,x*scaleX+offsetX);
      ObjectSet("textPeriod"+x,OBJPROP_YDISTANCE,offsetY-10);
      ObjectSetText("textPeriod"+x,periodString[x],8,"Tahoma",Gold);
   }

   // names of indicators
   for(y=0;y<3;y++)
   {
      ObjectCreate("textSignal"+y,OBJ_LABEL,0,0,0,0,0);
          ObjectSet("textSignal"+y,OBJPROP_CORNER,corner);// change the corner
      ObjectSet("textSignal"+y,OBJPROP_XDISTANCE,offsetX-25);
      ObjectSet("textSignal"+y,OBJPROP_YDISTANCE,y*scaleY+offsetY+8);
      ObjectSetText("textSignal"+y,signalNameString[y],8,"Tahoma",Gold);
   }

   return(0);
}
添加新参数
我们可以再添加一些参数,便于灵活地设置指标外观。所有参数:
- 所有可用颜色
- 所有可用符号代码
首先我们需要在代码开头声明所有这些参数:
extern int scaleX=20,
           scaleY=20,
           offsetX=35,
           offsetY=20,
           fontSize=20,
           corner=0,
           symbolCodeBuy=110, // a symbol code for a buy signal
           symbolCodeSell=110, // sell signal
           symbolCodeNoSignal=110; // no signal

extern color signalBuyColor=YellowGreen, // color of the symbol of a buy signal
             signalSellColor=Tomato, // for a sell signal
             noSignalColor=DarkGray, // no signal
             textColor=Gold; // color of all writings
更改函数init():
int init()
{
   // table of signals
   for(int x=0;x<9;x++)
      for(int y=0;y<3;y++)
      {
         ObjectCreate("signal"+x+y,OBJ_LABEL,0,0,0,0,0);
         ObjectSet("signal"+x+y,OBJPROP_CORNER,corner);
         ObjectSet("signal"+x+y,OBJPROP_XDISTANCE,x*scaleX+offsetX);
         ObjectSet("signal"+x+y,OBJPROP_YDISTANCE,y*scaleY+offsetY);
         ObjectSetText("signal"+x+y,CharToStr(symbolCodeNoSignal),
                       fontSize,"Wingdings",noSignalColor);
      }

   // names of timeframes
   for(x=0;x<9;x++)
   {
      ObjectCreate("textPeriod"+x,OBJ_LABEL,0,0,0,0,0);
      ObjectSet("textPeriod"+x,OBJPROP_CORNER,corner);
      ObjectSet("textPeriod"+x,OBJPROP_XDISTANCE,x*scaleX+offsetX);
      ObjectSet("textPeriod"+x,OBJPROP_YDISTANCE,offsetY-10);
      ObjectSetText("textPeriod"+x,periodString[x],8,"Tahoma",textColor);
   }

   // names of indicators
   for(y=0;y<3;y++)
   {
      ObjectCreate("textSignal"+y,OBJ_LABEL,0,0,0,0,0);
      ObjectSet("textSignal"+y,OBJPROP_CORNER,corner);
      ObjectSet("textSignal"+y,OBJPROP_XDISTANCE,offsetX-25);
      ObjectSet("textSignal"+y,OBJPROP_YDISTANCE,y*scaleY+offsetY+8);
      ObjectSetText("textSignal"+y,signalNameString[y],8,"Tahoma",textColor);
   }

   return(0);
}
更改函数start():
int start()
{
   for(int x=0;x<9;x++)
   {
      if(iMA(Symbol(),period[x],13,0,0,0,0)>iMA(Symbol(),period[x],24,0,0,0,0))
         ObjectSetText("signal"+x+"0",CharToStr(symbolCodeBuy),fontSize,
         "Wingdings",signalBuyColor);
      else
         ObjectSetText("signal"+x+"0",CharToStr(symbolCodeSell),fontSize,
         "Wingdings",signalSellColor);
   }

   for(x=0;x<9;x++)
   {
      if(MathAbs(iWPR(Symbol(),period[x],13,0))<20.0)
         ObjectSetText("signal"+x+"1",CharToStr(symbolCodeBuy),fontSize,
         "Wingdings",signalBuyColor);
      else if(MathAbs(iWPR(Symbol(),period[x],13,0))>80.0)
         ObjectSetText("signal"+x+"1",CharToStr(symbolCodeSell),fontSize,
         "Wingdings",signalSellColor);
      else
         ObjectSetText("signal"+x+"1",CharToStr(symbolCodeNoSignal),fontSize,
         "Wingdings",noSignalColor);
   }

   for(x=0;x<9;x++)
   {
      if(iSAR(Symbol(),period[x],0.02,0.2,0)<Close[0])
         ObjectSetText("signal"+x+"2",CharToStr(symbolCodeBuy),fontSize,
         "Wingdings",signalBuyColor);
      else
         ObjectSetText("signal"+x+"2",CharToStr(symbolCodeSell),fontSize,
         "Wingdings",signalSellColor);
   }

   return(0);
}
更改外部视图
指标已准备就绪。通过更改输入函数,我们可以完全改变外部视图:
extern int scaleX=20,
           scaleY=20,
           offsetX=35,
           offsetY=20,
           fontSize=20,
           corner=2,
           symbolCodeBuy=67,
           symbolCodeSell=68,
           symbolCodeNoSignal=73;

extern color signalBuyColor=Gold,
             signalSellColor=MediumPurple,
             noSignalColor=WhiteSmoke,
             textColor=Gold;
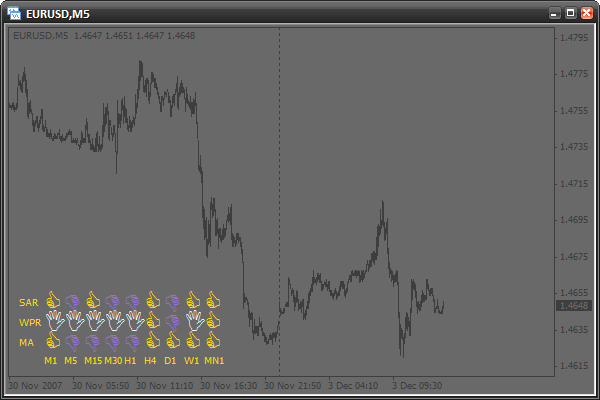
家庭作业
试着创建自己的信号条件,并多添加一行。创建多个新参数。例如,一个可以检测文字(时间范围和信号名称)字体大小的参数。根据自己的喜好设置指标的外观。
总结
今天我们学习了在脚本和指标中使用图形对象。我们了解了如何创建对象,修改其参数以及检查错误。理解这些知识后,你就可以自主学习新的图形对象类型了。你还逐步创建了一个复杂的指标,并可轻松对其进行灵活的设置。
之前的文章都属于“面向初学者的 MQL4 语言”系列:
本文由MetaQuotes Ltd译自英文
原文地址: https://www.mql5.com/en/articles/1503
注意: MetaQuotes Ltd.将保留所有关于这些材料的权利。全部或部分复制或者转载这些材料将被禁止。
本文由网站的一位用户撰写,反映了他们的个人观点。MetaQuotes Ltd 不对所提供信息的准确性负责,也不对因使用所述解决方案、策略或建议而产生的任何后果负责。

 懒惰是进步的动力。半自动标记模板


你好
接下来的文章什么时候能写出来?
期待!!!!