
MQL4 Language for Newbies. Custom Indicators (Part 2)
Introduction
This is the fifth article from the series "MQL4 Languages for Newbies". Today we will learn to use graphical objects - a very powerful development tool that allows to widen substantially possibilities of using indicators. Besides, they can be used in scripts and Expert Advisors. We will learn to create objects, change their parameters, check errors. Of course, I cannot describe in details all objects - there are a lot of them. But you will get all necessary knowledge to be able to study them yourself. This article also contains a step-by-step guide-example of creating a complex signal indicator. On its basis you can create any signal indicators that will show trade signals on all periods for several indicators. At that, many parameters will be adjustable which will make it possible to change easily the appearance of the indicator.
About Graphical Objects
You often deal with them when working in MetaTrader 4 terminal. You can use graphical objects for various purposes. Traders place support and resistance levels, pivot points, Fibonacci levels etc. Let us view a simple example of using objects:
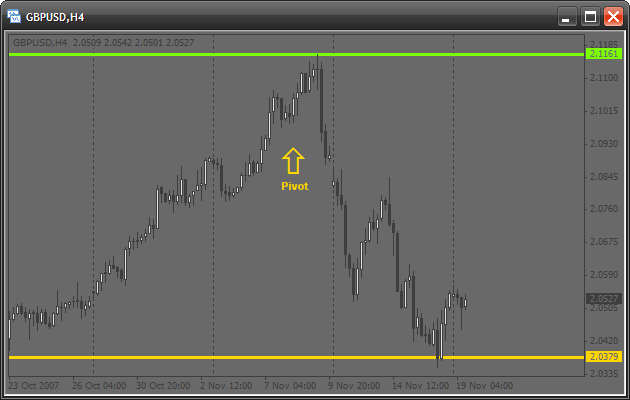
Four graphical objects are attached to this chart:
- 2 horizontal lines
- a text object
- an object-symbol (an arrow)
Today we will learn to attach such objects using MQL4. Just imagine how many manual actions can be automated by using objects! For example, have you ever calculated pivot points, support and resistance levels and then drawn them manually? Well, there is not so much work, but if this process is automated in MQL4, the terminal will calculate and draw the corresponding levels itself. All you need is a double click on the script name, and everything will be done. Besides, using graphical objects one can write very useful signal indicators.
Concepts of Working with Objects
The algorithm of working with all graphical objects in MQL4 is the following:
- creating an object
- modifying its parameters (moving, changing color, stile etc.)
- deleting an object
This is a certain "life cycle". Now let's dwell on each stage.
Creating a Graphical Object
For drawing any graphical object the universal function ObjectCreate() is used. Here is its prototype:
bool ObjectCreate(string name, int type, int window, datetime time1,
                  double price1, datetime time2=0,double price2=0,
                  datetime time3=0, double price3=0)
The function returns true, if everything is correct, and false, if an object cannot be created or an error has occurred. To find out the error code, use the function GetLastError():
if(ObjectCreate(/* arguments */)==false)
{
   // an error occurred, its code should be recorded into a journal
   Print("Error of calling ObjectCreate():",GetLastError());
}
What for do we need the error code? It will help you to find the error description and possibly eliminate it. All code descriptions are contained in: MQL4 Reference -> Standard Constants -> Error Codes.
Let's dwell on all the arguments of the function ObjectCreate():
- name – a unique name of an object. You cannot create 2 objects with the same name. Further this name will be used in other functions for changing the parameters of the object representation or moving the object.
- type – an object type. All object types that can be created are contained in: MQL4 Reference -> Standard Constants -> Object Types. Note, it depends on the object type, whether the last function arguments should be used. Look once again at the prototype. Values to the last 4 arguments are assigned by default: different objects require different amount of data for creation. It is easy. Suppose you need to draw a point. What information do you need? Obviously, the point position. This will be enough, right? And to draw a rectangle we need 2 - positions of the upper left and the lower right points. The same is with the function ObjectCreate(). It is universal. So, it needs position of one point for drawing a horizontal line and of two points for drawing a line segment. For drawing a triangle it needs three points. That's why when creating an object it is recommended to study properly the number of points needed for drawing it.
- window – the window number, in which the object should be drawn. If you need to draw an object on a chart, i.e. in the main window, use 0 as the window number.
- time1 – the X coordinate of the first point. The X-axis in the terminal shows time, so indicate here time value. For example, to find out the time of the last available bar you may use the predefined array Time[], like this: Time[0].
- price1 – the Y coordinate of the first point. The Y-axis in the terminal shows price, so price values should be used. For example, use the predefined arrays Open[], Close[] etc.
-
other arguments are 2 pairs of the analogous coordinates that define points for drawing more complex objects. If an object is simple, these parameters are not used.
Example of Creating Objects. Drawing Lines
Now for better understanding, let's draw a couple of lines. Let's mark the minimal and the maximal price of the last day. First we need to create a new script and change the function start():
int  start()
{
   double price=iHigh(Symbol(),PERIOD_D1,0);
   // this useful function returns the maximal price for:
   // * specified security, in our case it is Symbol() -
   //   active security
   // * specified period, in our case it is PERIOD_D1 (daily)
   // * specified bar, in our case it is 0, the last bar

   ObjectCreate("highLine",OBJ_HLINE,0,0,price);
   // let us view all parameters:
   // "highLine" - the unique object name
   // OBJ_HLINE - object type of the horizontal line
   // 0 - the object is drawn in the main window (chart window)
   // 0 - X coordinate (time), it shouldn't be indicated, because
   //     we are drawing a horizontal line
   // price - Y coordinate (price). It is the maximal price

   price=iLow(Symbol(),PERIOD_D1,0);
   // the function is identical with iHigh in arguments, but it returns
   // the minimal price

   ObjectCreate("lowLine",OBJ_HLINE,0,0,price);

   return(0);
}
Of course we have missed checking for errors. So if you write the same name for the two objects, it will be your fault. When you start the script, it should look like this:
Lines are drawn but there is something that I dislike. It is the red color, which is too intense, so it is recommended to use tints. Generally the line appearance can be set up.
Modifying Object Properties. Setting Up the Appearance of Lines
There is a special function that allows setting up parameters of a created graphical object. It is the function ObjectSet(). Its prototype is:
bool ObjectSet( string name, int index, double value);
Like the previous function it returns true, if everything is correct, and false, if there are any problems. For example, you have specified a non-existent object name. Let's view the arguments of this function:
- name – name of a created object. Before starting the modification, make sure that an object with such a name exists.
- index – index of an object's property that should be modified. All indexes can be found in: MQL4 Reference -> Standard Constants -> Object properties. This function is also universal. It operates according to the following principle: you specify what property should be modified and what value should be assigned to this property.
- value – this is the value, to which a selected property should be changed. For example, if you change the color, specify here a new color.
Now let us change our lines, namely: their color, width and style. Change the function start() of the same script:
int  start()
{
   double price=iHigh(Symbol(),PERIOD_D1,0);

   ObjectCreate("highLine",OBJ_HLINE,0,0,price);
   price=iLow(Symbol(),PERIOD_D1,0);
   ObjectCreate("lowLine",OBJ_HLINE,0,0,price);

   ObjectSet("highLine",OBJPROP_COLOR,LimeGreen);
   // changing the color of the upper line
   ObjectSet("highLine",OBJPROP_WIDTH,3);
   // now the line will be 3 pixel wide

   ObjectSet("lowLine",OBJPROP_COLOR,Crimson);
   // changing the color of the lower line
   ObjectSet("lowLine",OBJPROP_STYLE,STYLE_DOT);
   // now the lower line will be dashed

   return(0);
}
You will see the following on the chart:
Deleting Objects
You will often need to delete old or unnecessary objects. There are several functions for doing this:
bool ObjectDelete(string name);
This function deletes an object of the specified name. If you indicate a non-existent name, 'false' will be returned.
int ObjectsDeleteAll(int window=EMPTY,int type=EMPTY);
This is an advanced function, it returns the number of deleted objects. It also has default values. If you do not specify any parameters, the terminal will delete all objects of an active chart:
ObjectsDeleteAll();
// deleting all objects
If you have created an object in a sub-window (for example, in a window of some indicator), by specifying the number of this window in the first argument, you can delete all its objects. We will discuss sub-windows later, so now indicate 0 in the first argument.
If you need to delete all objects of a certain type, specify this type in the second argument:
ObjectsDeleteAll(0, OBJ_ARROW);
// deleting all arrows
How to Use All This Correctly?
You may think that you need much knowledge for using all this correctly. For example, that one should know all these properties and types of objects. But this is not so. Everything can be found in a Userguide.
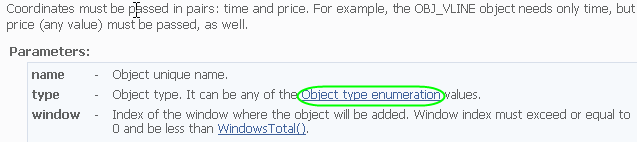
First open Toolbox (CTRL+T). There are several tabs in the bottom, select Help. Suppose you need to draw a graphical object, but don't know how to do this. The function ObjectCreate() should be used. Write it and leave the arguments empty. Now place the cursor inside the function name and press F1. And the Help window will show the information about this function. It means you don't need to search anything. Now see the function description. It is followed by the description of all its arguments. Pay attention to the description of the argument type:
It contains a link. By clicking it you will see the list of existing objects. Suppose you like an ellipse:
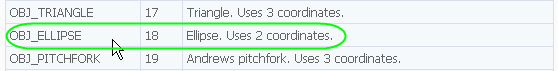
Read the description and you will find that 2 coordinates are needed. Let's start:
int  start()
{
   ObjectCreate("ellipse",OBJ_ELLIPSE,0,Time[100],Low[100],Time[0],High[0]);
   // indicate 2 points for creating an ellipse:
   // * 1st - lower left point
   // * 2nd - upper right point

   return(0);
}
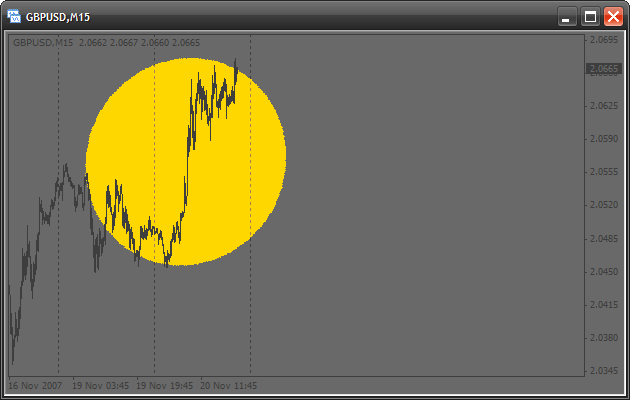
It is also written that the property OBJPROP_SCALE determines the correlation of sides. So if we place it as 1, we will get a circle:
int  start()
{
   ObjectsDeleteAll();
   // clear the chart before drawing

   ObjectCreate("ellipse",OBJ_ELLIPSE,0,Time[100],Low[100],Time[0],High[0]);

   ObjectSet("ellipse",OBJPROP_SCALE,1.0);
   // change the correlation of sides
   ObjectSet("ellipse",OBJPROP_COLOR,Gold);
   // change the color

   return(0);
}
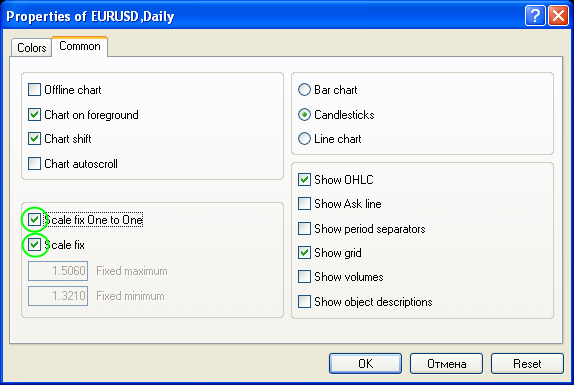
I am sure you also didn't get a circle, because one-to-one scale should be set in the chart properties (click right button on any empty place of the chart and select Properties):
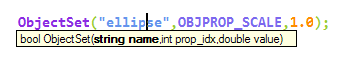
You see, everything is easy. Actually you can place the cursor on any key word and press F1, after that you will see the corresponding information from the Help. So you do not need to remember all names of types and properties for quick and efficient code writing using the built-in Help. MetaEditor has one more very important property that will help you to write a code: when writing arguments in a built-in function, press CTRL + SHIFT + space. You will see a prompting with the function prototype:
Creating Graphical Objects in Subwindows
If you need to draw graphical objects in a subwindow for example in a window of a custom indicator, you should know its number. As an example we will write a simple indicator that will draw a horizontal line in a separate window. Create a custom indicator and add the following in the code:
//+------------------------------------------------------------------+
//|                                   creatingObjectsInSubWindow.mq4 |
//|                                                     Antonuk Oleg |
//|                                            antonukoleg@gmail.com |
//+------------------------------------------------------------------+
#property copyright "Antonuk Oleg"
#property link      "antonukoleg@gmail.com"

#property indicator_separate_window
// indicator will be written in a separate window
#property indicator_minimum 1
// minimal indicator value is 1
#property indicator_maximum 10
// maximal is 10

//+------------------------------------------------------------------+
//| Custom indicator initialization function                         |
//+------------------------------------------------------------------+
int init()
{
   IndicatorShortName("NiceLine");
   // this simple function sets a short indicator name,
   // you see it in the upper left corner of any indicator.
   // What for do we need it? The function WindowFind searches a subwindow
   // with a specified short name and returns its number.

   int windowIndex=WindowFind("NiceLine");
   // finding the window number of our indicator

   if(windowIndex<0)
   {
      // if the number is -1, there is an error
      Print("Can\'t find window");
      return(0);
   }

   ObjectCreate("line",OBJ_HLINE,windowIndex,0,5.0);
   // drawing a line in the indicator subwindow

   ObjectSet("line",OBJPROP_COLOR,GreenYellow);
   ObjectSet("line",OBJPROP_WIDTH,3);

   WindowRedraw();
   // redraw the window to see the line

   return(0);
}
//+------------------------------------------------------------------+
//| Custom indicator deinitialization function                       |
//+------------------------------------------------------------------+
int deinit()
{
   ObjectsDeleteAll();
   // delete all objects

   return(0);
}
//+------------------------------------------------------------------+
//| Custom indicator iteration function                              |
//+------------------------------------------------------------------+
int start()
{
   return(0);
}
Start the indicator. There is no line!
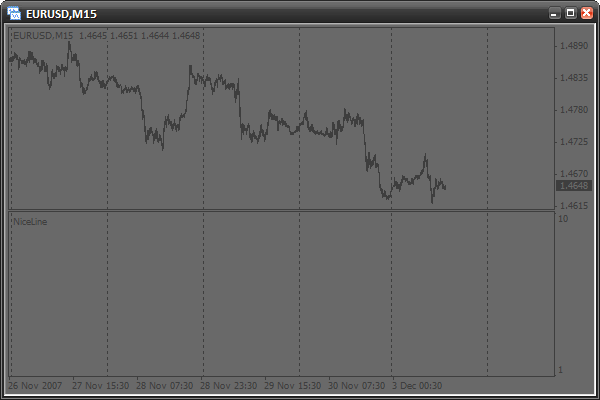
We need to change the chart period.
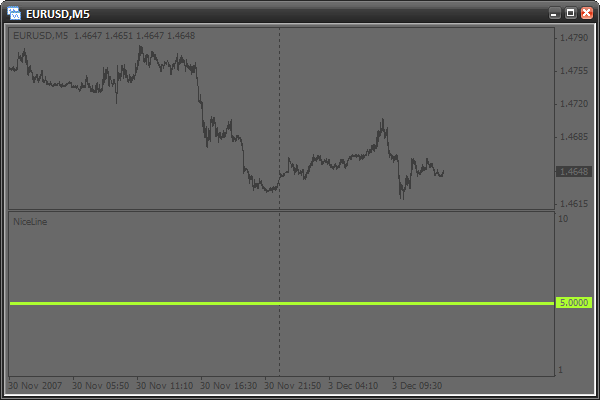
Now it is here. What happened? Actually, the subwindow number cannot be found in the function init(), when it is started for the first time. Perhaps, the reason is that the subwindow is not yet crated by the terminal during initialization. There is a way to avoid it - everything should be done in the function start(),when the window is already created, like this:
//+------------------------------------------------------------------+
//|                                   creatingObjectsInSubWindow.mq4 |
//|                                                     Antonuk Oleg |
//|                                            antonukoleg@gmail.com |
//+------------------------------------------------------------------+
#property copyright "Antonuk Oleg"
#property link      "antonukoleg@gmail.com"

#property indicator_separate_window
#property indicator_minimum 1
#property indicator_maximum 10

bool initFinished=false;
// adding a variable that will remember the initialization state.
// false - there was no initialization
// true - there was initialization

//+------------------------------------------------------------------+
//| Custom indicator initialization function                         |
//+------------------------------------------------------------------+
int init()
{
   return(0);
}
//+------------------------------------------------------------------+
//| Custom indicator deinitialization function                       |
//+------------------------------------------------------------------+
int deinit()
{
   ObjectsDeleteAll();
   // deleting all objects

   return(0);
}
//+------------------------------------------------------------------+
//| Custom indicator iteration function                              |
//+------------------------------------------------------------------+
int start()
{
   if(initFinished==false)
   {
      IndicatorShortName("NiceLine");

      int windowIndex=WindowFind("NiceLine");

      if(windowIndex<0)
      {
         // if the subwindow number is -1, there is an error
         Print("Can\'t find window");
         return(0);
      }

      ObjectCreate("line",OBJ_HLINE,windowIndex,0,5.0);
      // drawing a line in the indicator subwindow

      ObjectSet("line",OBJPROP_COLOR,GreenYellow);
      ObjectSet("line",OBJPROP_WIDTH,3);

      WindowRedraw();
      // redraw the window to see the line

      initFinished=true;
      // drawing is finished
   }

   return(0);
}
Now everything will be drawn from the first time. What you should remember here, is that the subwindow number is found out in the function start(), and not init().
Have Some Practice
Using the Help, try to study some new types of graphical objects. After that write a script that will draw them and set up parameters. Study this properly, have some practice and only after that continue reading the article.
Writing a Signal Indicator. What Is It?
Imagine the situation. A trader uses several indicators for making decisions about entering the market: Moving Average, Parabolic SAR and Williams’ Percent Range. These are built-in indicators, which look like this:
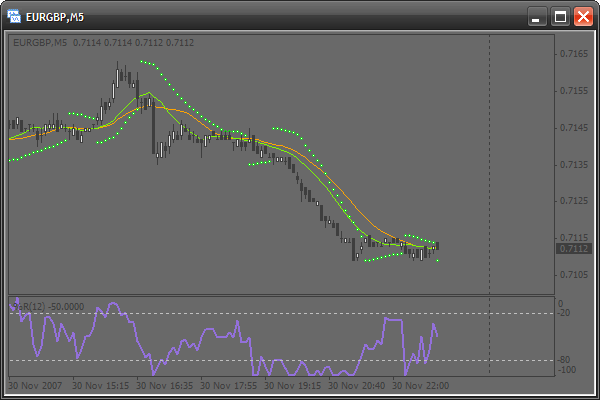
A trader constantly estimates a situation in the market the following way: the market should be entered when signals come from each of the three indicators:
- If the quick moving average is above the slow one, this is a signal to buy. If vice versa - to sell.
- If price is lower than Parabolic SAR, this is a signal to sell. If vice versa - to buy.
- If WPR is larger than -20, this is a signal to buy. If WPR is lower than -80, this is a signal to sell.
The trader constantly has to check all the conditions, trying also to track the situation on several periods. It is a hard job. So, a signal indicator doing all checks could help him:
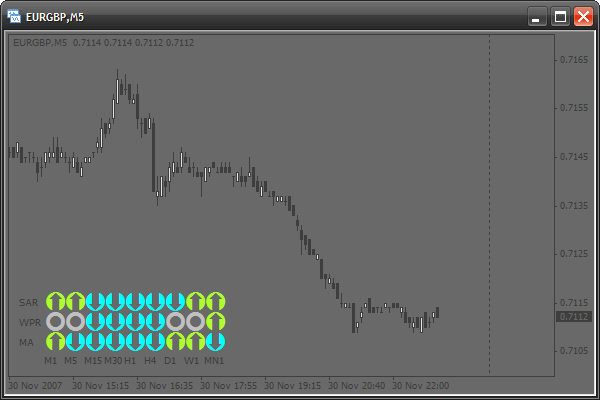
Today we will learn to solve this problem. We will write a signal indicator that will be easily set up. Besides, you will easily create your own modification with your favorite indicators based on this one.
Basics
We will face some problems of drawing when creating this indicator. All graphical objects are drawn using price and time coordinates. Because of this, what is drawn is constantly shifted. To make objects stay in one place, we would need to change constantly their coordinates. But if you want to see what was earlier and shift the chart, the signal table will also be shifted. But each rule has exceptions. Among graphical objects there is the one called OBJ_LABEL. It is a text mark used for positioning not price and time, but coordinates about the window in pixels. It is easy:
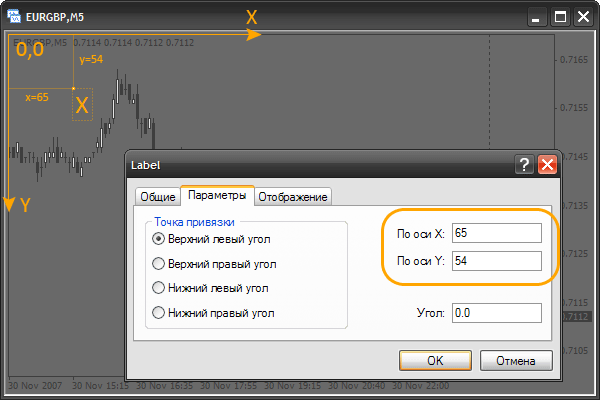
We see a common text sign "X". In its parameters you can see that its coordinates are specified in pixels. A pixel is the smallest point on the screen. Note that the coordinates of the upper left corner are: x=0, y=0 (0,0). If we increase x, the object will be shifted to the right, if we diminish it, it will be shifted to the left. The same is with the y-coordinate. It can be shifted upwards or downwards. It is important to understand and remember this principle. For practicing, you can create a mark and shift it to see how its coordinates are changed in the properties. Also you can view old quotes by shifting the chart. At that the mark is not shifted. Using such marks we can create a signal indicator without the disadvantages described above.
Options of a Text Mark
Our signal indicator will use only text marks. So let's dwell on their options. First, create a new indicator (do not use data buffers and parameters) and change the function init():
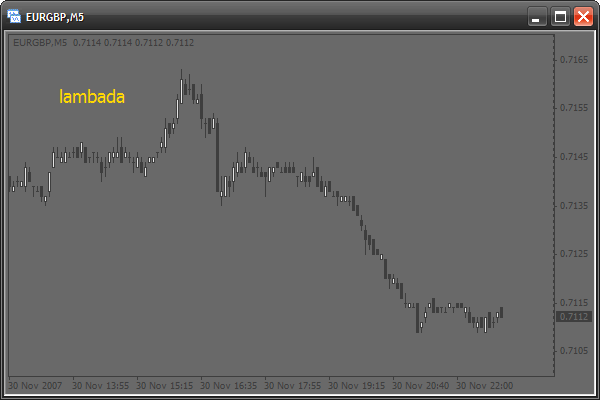
int init()
{
   // now we will crate a text mark.
   // for this use the function ObjectCreate.
   // do not indicate coordinates
   ObjectCreate("signal",OBJ_LABEL,0,0,0,0,0);

   // change the x-coordinate
   ObjectSet("signal",OBJPROP_XDISTANCE,50);

   // change the y-coordinate
   ObjectSet("signal",OBJPROP_YDISTANCE,50);

   // to indicate the mark text, use the following function
   ObjectSetText("signal","lambada",14,"Tahoma",Gold);
   // "signal" - object name
   // "lambada" - text
   // 14 - font size
   // Gold - color

   return(0);
}
You see, everything is easy. The ObjectCreate() function will be used only in initialization to create all necessary objects. Using ObjectSetText(), we will change the appearance of objects at each price change in the function start(). We also need to change the function deinit():
int deinit()
{
   // when deleting the indicator delete all objects
   ObjectsDeleteAll();

   return(0);
}
Now start the indicator and view the results:
We will use the following options of marks:
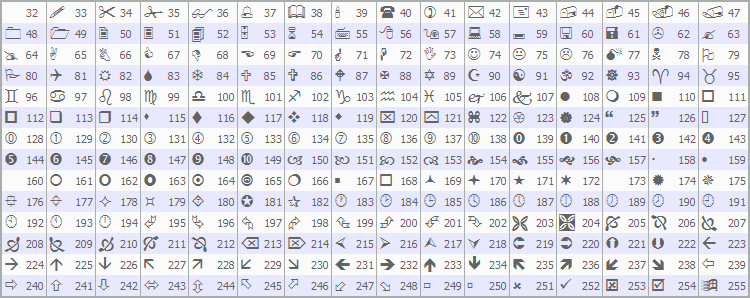
- change the font into Wingdings to make available special symbols (from squares and circles to smiles):
- we will change color and text of the mark
- we will change position and size of the mark
Using the Font Wingdings
Now let's create a mark using the Windings font. Change the init() function:
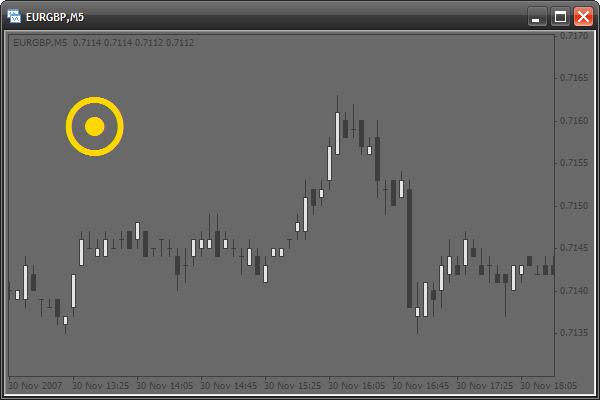
int init()
{

   ObjectCreate("signal",OBJ_LABEL,0,0,0,0,0);
   ObjectSet("signal",OBJPROP_XDISTANCE,50);
   ObjectSet("signal",OBJPROP_YDISTANCE,50);

   // use symbols from the Wingdings font
   ObjectSetText("signal",CharToStr(164),60,"Wingdings",Gold);
   // CharToStr() - this function returns a line with a single
   // symbol, the code of which is specified in the single argument.
   // Simply select a symbol from the table above and write
   // its number into this function
   // 60 - use large font
   // "Wingdings" - use font Wingdings

   return(0);
}
Here is the result:
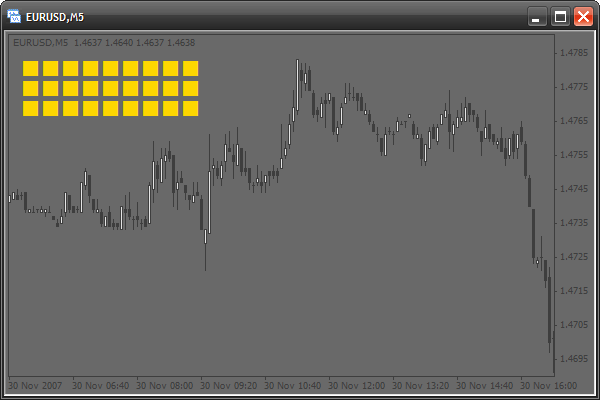
Drawing a Model of a Signal Table
Now let us draw a model of a table of signals. Actually this will be a number of squares:
int init()
{
   // use 2 cycles. The first cycle, with the counter "x" draws one by one
   // each column from left to wright. The second cycle draws symbols of each
   // column from top downward. At each iteration the cycle will create a mark.
   // These 2 cycles create 9 columns (9 periods) 3 marks each (3 signal types).
   for(intx=0;x<9;x++)
      for(inty=0;y<3;y++)
      {
         ObjectCreate("signal"+x+y,OBJ_LABEL,0,0,0,0,0);
         // create the next mark, Note that the mark name
         // is created "on the fly" and depends on "x" and "y" counters

         ObjectSet("signal"+x+y,OBJPROP_XDISTANCE,x*20);
         // change the X coordinate.
         // x*20 - each mark is created at the interval of 20 pixels
         // horizontally and directly depends on the "x" counter

         ObjectSet("signal"+x+y,OBJPROP_YDISTANCE,y*20);
         // change the Y coordinate.
         // y*20 - each mark is created at the interval of 20 pixels
         // vertically and directly depends on the "y" counter

         ObjectSetText("signal"+x+y,CharToStr(110),20,"Wingdings",Gold);
         // use the 110th symbol code (square)
      }

   return(0);
}
The pattern is ready. Let us add indents to the left and above it, so that the terminal text could be seen:
int init()
{
   for(int x=0;x<9;x++)
      for(int y=0;y<3;y++)
      {
         ObjectCreate("signal"+x+y,OBJ_LABEL,0,0,0,0,0);
         ObjectSet("signal"+x+y,OBJPROP_XDISTANCE,x*20+12);
         // adding a horizontal indent 12 pixels
         ObjectSet("signal"+x+y,OBJPROP_YDISTANCE,y*20+20);
         // adding a vertical indent 20 pixels
         ObjectSetText("signal"+x+y,CharToStr(110),20,"Wingdings",Gold);
      }

   return(0);
}
Activate the Pattern
Now let's make operate at least one of the squares. Suppose the upper left square will show a signal of moving averages on a minute timeframe (M1). If there is a signal to buy, the square will change its color into green. If there is a signal to sell - it becomes red. We need to change the function start():
int start()
{
   // if quick moving average (period - 13) is larger than the slow one,
   // this is a signal to buy. Check the last bar
   if(iMA(Symbol(),1,13,0,0,0,0)>iMA(Symbol(),1,24,0,0,0,0))
      ObjectSetText("signal00",CharToStr(110),20,"Wingdings",YellowGreen);
   // change the color of the mark named "signal00" (the upper left)
   // into green

   else
   // else, if the quick MA is smaller than the slow one, this is a signal to sell.
      ObjectSetText("signal00",CharToStr(110),20,"Wingdings",Tomato);
      // change the color into red

   return(0);
}
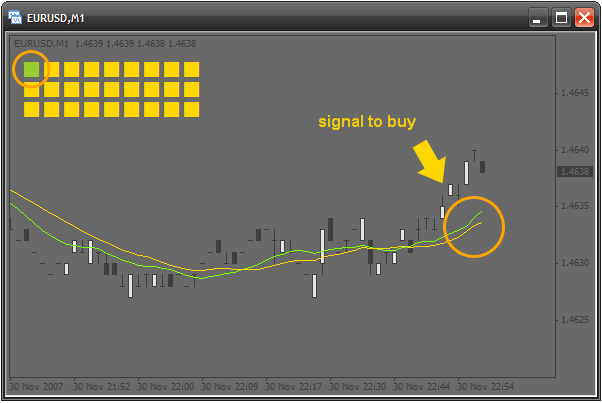
Activate the Upper Row
Let's continue the activation. The left square indicates the smallest timeframe - M1. Now let's make it so that each square indicates a timeframe larger than the previous one. So, the second square shows signals on M5, the third one - M15 and so on, up to MN1. Of course, all this will be done in a cycle. What is changed, is the name and the period. We have 0 squares, so we use one counter. But we face a problem with periods, because they are changed without any regularities. See:
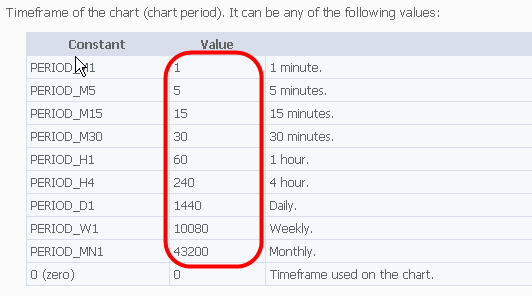
One would think that a cycle cannot be used here. It is not true. All we need is to declare a special array in the indicator code beginning:
//////////////////////////////////////////////////////////////////////
//
//                                                  signalTable.mq4
//                                                     Antonuk Oleg
//                                            antonukoleg@gmail.com
//
//////////////////////////////////////////////////////////////////////
#property copyright "Antonuk Oleg"
#property link      "antonukoleg@gmail.com"

#property indicator_chart_window

intperiod[]={1,5,15,30,60,240,1440,10080,43200};
All periods are written down in the array, now they can easily be used in a cycle:
int start()
{
   // use a cycle to activate all squares of the first line
   for(int x=0;x<9;x++)
   {
      if(iMA(Symbol(),period[x],13,0,0,0,0)>iMA(Symbol(),period[x],24,0,0,0,0))
         ObjectSetText("signal"+x+"0",CharToStr(110),20,"Wingdings",YellowGreen);
         // "signal"+x+"0" - create a mark name dynamically depending on
         // the counter "x"
      else
         ObjectSetText("signal"+x+"0",CharToStr(110),20,"Wingdings",Tomato);
   }

   return(0);
}
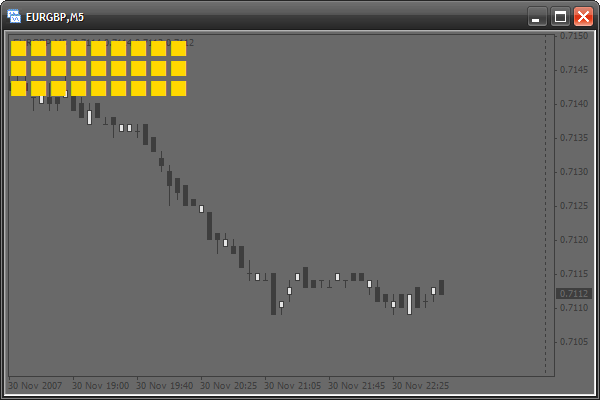
We use the array period[] as a table of correspondence of the "x" counter and the period. Imagine how much code would be needed if not for this small array! So, the first row of signal squares is ready:
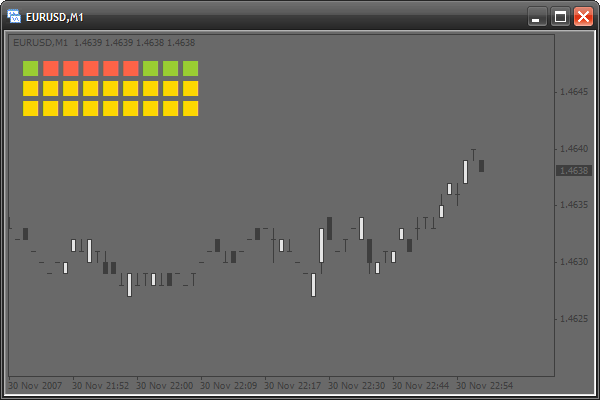
Adding Writings
It is all ok, but it is hard to understand what is the timeframe of the square, so let's create explanatory signatures. We will also use an array of correspondences that will store writings for each column:
#property indicator_chart_window

int period[]={1,5,15,30,60,240,1440,10080,43200};

stringperiodString[]={"M1","M5","M15","M30","H1","H4","D1","W1","MN1"};
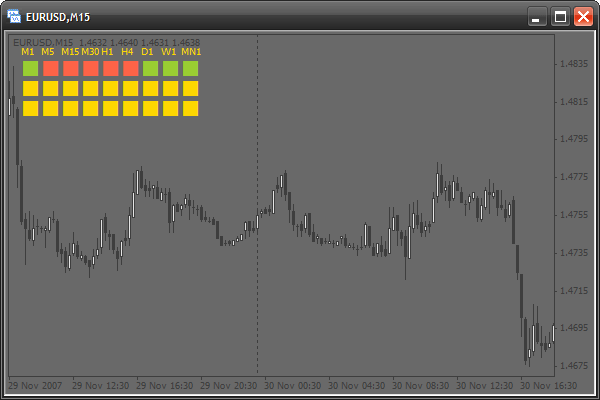
Writings will be created in init() with the help of the following cycle:
int init()
{
   for(int x=0;x<9;x++)
      for(int y=0;y<3;y++)
      {
         ObjectCreate("signal"+x+y,OBJ_LABEL,0,0,0,0,0);
         ObjectSet("signal"+x+y,OBJPROP_XDISTANCE,x*20+12);
         ObjectSet("signal"+x+y,OBJPROP_YDISTANCE,y*20+20);
         ObjectSetText("signal"+x+y,CharToStr(110),20,"Wingdings",Gold);
      }

   // create writings for periods from left to right
   for(x=0;x<9;x++)
   {
      // everything is as usual
      ObjectCreate("textPeriod"+x,OBJ_LABEL,0,0,0,0,0);
      ObjectSet("textPeriod"+x,OBJPROP_XDISTANCE,x*20+12);
      ObjectSet("textPeriod"+x,OBJPROP_YDISTANCE,10);
      ObjectSetText("textPeriod"+x,periodString[x],8,"Tahoma",Gold);
      // we use the array periodString[], to indicate writings
   }

   return(0);
}
Adding Some Parameters
Let's make the indicator more flexible, adding a couple of parameters so that a user could set up the external view of the indicator:
#property copyright "Antonuk Oleg"
#property link      "antonukoleg@gmail.com"

#property indicator_chart_window

extern int scaleX=20, // horizontal interval at which the squares are created
           scaleY=20, // vertical interval
           offsetX=35, // horizontal indent of all squares
           offsetY=20, // vertical indent
           fontSize=20; // font size

int period[]={1,5,15,30,60,240,1440,10080,43200};
string periodString[]={"M1","M5","M15","M30","H1","H4","D1","W1","MN1"};
Also let's change the code of functions init() and start():
int init()
{
   for(int x=0;x<9;x++)
      for(int y=0;y<3;y++)
      {
         ObjectCreate("signal"+x+y,OBJ_LABEL,0,0,0,0,0);
         ObjectSet("signal"+x+y,OBJPROP_XDISTANCE,x*scaleX+offsetX);
         ObjectSet("signal"+x+y,OBJPROP_YDISTANCE,y*scaleY+offsetY);
         ObjectSetText("signal"+x+y,CharToStr(110),fontSize,"Wingdings",Gold);
      }

   for(x=0;x<9;x++)
   {
      ObjectCreate("textPeriod"+x,OBJ_LABEL,0,0,0,0,0);
      ObjectSet("textPeriod"+x,OBJPROP_XDISTANCE,x*scaleX+offsetX);
      ObjectSet("textPeriod"+x,OBJPROP_YDISTANCE,offsetY-10);
      ObjectSetText("textPeriod"+x,periodString[x],8,"Tahoma",Gold);
   }

   return(0);
}

int start()
{
   for(int x=0;x<9;x++)
   {
      if(iMA(Symbol(),period[x],13,0,0,0,0)>iMA(Symbol(),period[x],24,0,0,0,0))
         ObjectSetText("signal"+x+"0",CharToStr(110),fontSize,"Wingdings",YellowGreen);
      else
         ObjectSetText("signal"+x+"0",CharToStr(110),fontSize,"Wingdings",Tomato);
   }

   return(0);
}
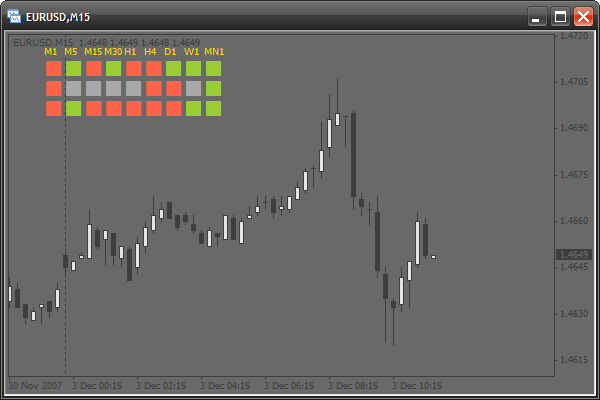
Activating Other Rows
The second row will indicate signals of Williams’ Percent Range, the third raw – of Parabolic SAR. Modifying the function start():
int start()
{
   for(int x=0;x<9;x++)
   {
      if(iMA(Symbol(),period[x],13,0,0,0,0)>iMA(Symbol(),period[x],24,0,0,0,0))
         ObjectSetText("signal"+x+"0",CharToStr(110),fontSize,"Wingdings",YellowGreen);
      else
         ObjectSetText("signal"+x+"0",CharToStr(110),fontSize,"Wingdings",Tomato);
   }

   // activate the second row
   for(x=0;x<9;x++)
   {
      // if the absolute value of WPR is lower than 20, this is a signal to buy
      if(MathAbs(iWPR(Symbol(),period[x],13,0))<20.0)
         ObjectSetText("signal"+x+"1",CharToStr(110),fontSize,"Wingdings",YellowGreen);
      // if the absolute value of WPR is larger than 80, this is a signal to sell
      else if(MathAbs(iWPR(Symbol(),period[x],13,0))>80.0)
         ObjectSetText("signal"+x+"1",CharToStr(110),fontSize,"Wingdings",Tomato);
      // else, if there are no signals, a square is painted gray
      else
         ObjectSetText("signal"+x+"1",CharToStr(110),fontSize,"Wingdings",DarkGray);
   }

   // activate the third row
   for(x=0;x<9;x++)
   {
      // if the current price is larger than the value of SAR, this is a signal to buy
      if(iSAR(Symbol(),period[x],0.02,0.2,0)<Close[0])
         ObjectSetText("signal"+x+"2",CharToStr(110),fontSize,"Wingdings",YellowGreen);
      // otherwise, it is a signal to sell
      else
         ObjectSetText("signal"+x+"2",CharToStr(110),fontSize,"Wingdings",Tomato);
   }

   return(0);
}
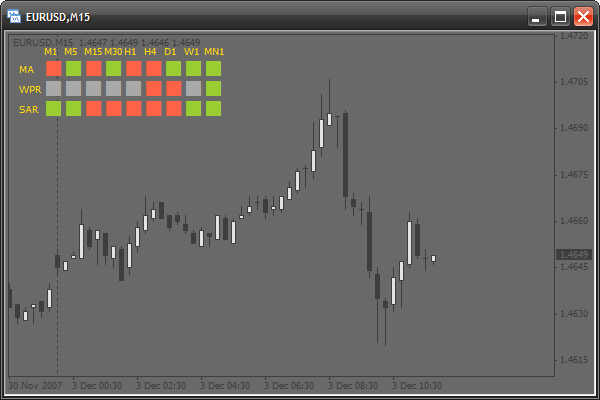
Adding the Names of Signals
Now let's put a name for each row. Let's create 3 writings on the left using an array as earlier:
int period[]={1,5,15,30,60,240,1440,10080,43200};
string periodString[]={"M1","M5","M15","M30","H1","H4","D1","W1","MN1"},
       // create one more array with indicator names
string signalNameString[]={"MA","WPR","SAR"};
Change the function init():
int init()
{
   for(int x=0;x<9;x++)
      for(int y=0;y<3;y++)
      {
         ObjectCreate("signal"+x+y,OBJ_LABEL,0,0,0,0,0);
         ObjectSet("signal"+x+y,OBJPROP_XDISTANCE,x*scaleX+offsetX);
         ObjectSet("signal"+x+y,OBJPROP_YDISTANCE,y*scaleY+offsetY);
         ObjectSetText("signal"+x+y,CharToStr(110),fontSize,"Wingdings",Gold);
      }

   for(x=0;x<9;x++)
   {
      ObjectCreate("textPeriod"+x,OBJ_LABEL,0,0,0,0,0);
      ObjectSet("textPeriod"+x,OBJPROP_XDISTANCE,x*scaleX+offsetX);
      ObjectSet("textPeriod"+x,OBJPROP_YDISTANCE,offsetY-10);
      ObjectSetText("textPeriod"+x,periodString[x],8,"Tahoma",Gold);
   }

   // draw signal names from top downwards
   for(y=0;y<3;y++)
   {
      ObjectCreate("textSignal"+y,OBJ_LABEL,0,0,0,0,0);
      ObjectSet("textSignal"+y,OBJPROP_XDISTANCE,offsetX-25);
      ObjectSet("textSignal"+y,OBJPROP_YDISTANCE,y*scaleY+offsetY+8);
      ObjectSetText("textSignal"+y,signalNameString[y],8,"Tahoma",Gold);
   }

   return(0);
}
Adding the Option of Changing the Binding Corner
Now we will add an option of choosing the position of the signal indicator. Now it is bound to the upper left corner. If we change the mark property OBJPROP_CORNER, the corner will be changed. This property can take the following values:
- 0 – the upper left corner
- 1 – the upper right corner
- 2 – the lower left corner
- 3 – the lower right corner
So, let's add a new parameter – corner:
#property indicator_chart_window

extern int scaleX=20,
           scaleY=20,
           offsetX=35,
           offsetY=20,
           fontSize=20,
           corner=0; // adding a parameter for choosing a corner
And we change the function init():
int init()
{
   // a table of signals
   for(int x=0;x<9;x++)
      for(int y=0;y<3;y++)
      {
         ObjectCreate("signal"+x+y,OBJ_LABEL,0,0,0,0,0);
         ObjectSet("signal"+x+y,OBJPROP_CORNER,corner);
         // change the corner
         ObjectSet("signal"+x+y,OBJPROP_XDISTANCE,x*scaleX+offsetX);
         ObjectSet("signal"+x+y,OBJPROP_YDISTANCE,y*scaleY+offsetY);
         ObjectSetText("signal"+x+y,CharToStr(110),fontSize,"Wingdings",Gold);
      }

   // name of timeframes
   for(x=0;x<9;x++)
   {
      ObjectCreate("textPeriod"+x,OBJ_LABEL,0,0,0,0,0);
      ObjectSet("textPeriod"+x,OBJPROP_CORNER,corner);
      // changing the corner
      ObjectSet("textPeriod"+x,OBJPROP_XDISTANCE,x*scaleX+offsetX);
      ObjectSet("textPeriod"+x,OBJPROP_YDISTANCE,offsetY-10);
      ObjectSetText("textPeriod"+x,periodString[x],8,"Tahoma",Gold);
   }

   // names of indicators
   for(y=0;y<3;y++)
   {
      ObjectCreate("textSignal"+y,OBJ_LABEL,0,0,0,0,0);
          ObjectSet("textSignal"+y,OBJPROP_CORNER,corner);      // change the corner
      ObjectSet("textSignal"+y,OBJPROP_XDISTANCE,offsetX-25);
      ObjectSet("textSignal"+y,OBJPROP_YDISTANCE,y*scaleY+offsetY+8);
      ObjectSetText("textSignal"+y,signalNameString[y],8,"Tahoma",Gold);
   }

   return(0);
}
Adding New Parameters
We can add some more parameters for a flexible setup of the indicator appearance. All parameters:
- all available colors
- all available symbol codes
First we need to declare all these parameters at the beginning of the code:
extern int scaleX=20,
           scaleY=20,
           offsetX=35,
           offsetY=20,
           fontSize=20,
           corner=0,
           symbolCodeBuy=110, // a symbol code for a buy signal
           symbolCodeSell=110, // sell signal
           symbolCodeNoSignal=110; // no signal

extern color signalBuyColor=YellowGreen, // color of the symbol of a buy signal
             signalSellColor=Tomato, // for a sell signal
             noSignalColor=DarkGray, // no signal
             textColor=Gold; // color of all writings
Let's change the function init():
int init()
{
   // table of signals
   for(int x=0;x<9;x++)
      for(int y=0;y<3;y++)
      {
         ObjectCreate("signal"+x+y,OBJ_LABEL,0,0,0,0,0);
         ObjectSet("signal"+x+y,OBJPROP_CORNER,corner);
         ObjectSet("signal"+x+y,OBJPROP_XDISTANCE,x*scaleX+offsetX);
         ObjectSet("signal"+x+y,OBJPROP_YDISTANCE,y*scaleY+offsetY);
         ObjectSetText("signal"+x+y,CharToStr(symbolCodeNoSignal),
                       fontSize,"Wingdings",noSignalColor);
      }

   // names of timeframes
   for(x=0;x<9;x++)
   {
      ObjectCreate("textPeriod"+x,OBJ_LABEL,0,0,0,0,0);
      ObjectSet("textPeriod"+x,OBJPROP_CORNER,corner);
      ObjectSet("textPeriod"+x,OBJPROP_XDISTANCE,x*scaleX+offsetX);
      ObjectSet("textPeriod"+x,OBJPROP_YDISTANCE,offsetY-10);
      ObjectSetText("textPeriod"+x,periodString[x],8,"Tahoma",textColor);
   }

   // names of indicators
   for(y=0;y<3;y++)
   {
      ObjectCreate("textSignal"+y,OBJ_LABEL,0,0,0,0,0);
      ObjectSet("textSignal"+y,OBJPROP_CORNER,corner);
      ObjectSet("textSignal"+y,OBJPROP_XDISTANCE,offsetX-25);
      ObjectSet("textSignal"+y,OBJPROP_YDISTANCE,y*scaleY+offsetY+8);
      ObjectSetText("textSignal"+y,signalNameString[y],8,"Tahoma",textColor);
   }

   return(0);
}
Changing the function start():
int start()
{
for(int x=0;x<9;x++)
{
if(iMA(Symbol(),period[x],13,0,0,0,0)>iMA(Symbol(),period[x],24,0,0,0,0))
ObjectSetText("signal"+x+"0",CharToStr(symbolCodeBuy),fontSize,
"Wingdings",signalBuyColor);
else
ObjectSetText("signal"+x+"0",CharToStr(symbolCodeSell),fontSize,
"Wingdings",signalSellColor);
}
for(x=0;x<9;x++)
{
if(MathAbs(iWPR(Symbol(),period[x],13,0))<20.0)
ObjectSetText("signal"+x+"1",CharToStr(symbolCodeBuy),fontSize,
"Wingdings",signalBuyColor);
else if(MathAbs(iWPR(Symbol(),period[x],13,0))>80.0)
ObjectSetText("signal"+x+"1",CharToStr(symbolCodeSell),fontSize,
"Wingdings",signalSellColor);
else
ObjectSetText("signal"+x+"1",CharToStr(symbolCodeNoSignal),fontSize,
"Wingdings",noSignalColor);
}
for(x=0;x<9;x++)
{
if(iSAR(Symbol(),period[x],0.02,0.2,0)<Close[0])
ObjectSetText("signal"+x+"2",CharToStr(symbolCodeBuy),fontSize,
"Wingdings",signalBuyColor);
else
ObjectSetText("signal"+x+"2",CharToStr(symbolCodeSell),fontSize,
"Wingdings",signalSellColor);
}
return(0);
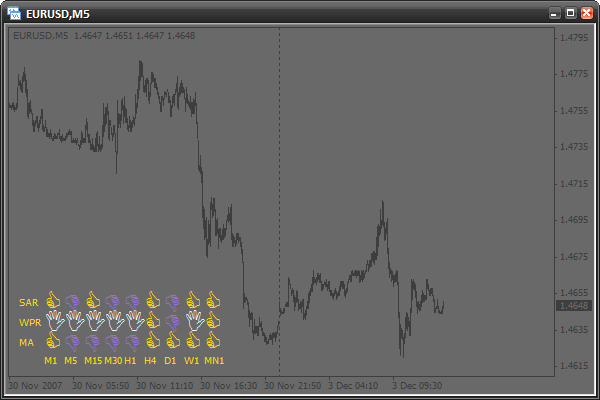
}Changing the External View
The indicator is ready. By changing the input parameters we can fully change the external view:
extern int scaleX=20,
           scaleY=20,
           offsetX=35,
           offsetY=20,
           fontSize=20,
           corner=2,
           symbolCodeBuy=67,
           symbolCodeSell=68,
           symbolCodeNoSignal=73;

extern color signalBuyColor=Gold,
             signalSellColor=MediumPurple,
             noSignalColor=WhiteSmoke,
             textColor=Gold;
Home Task
Try to create your own signal conditions and add one more row. Create several new parameters. For example, a parameter that will detect the font size of writings (timeframes and signal names). Set up the external view of the indicator according to your own preferencies.
Conclusion
Today we learned to use graphical objects in scripts and indicators. We learned to create objects, modify their parameters, check for errors. You have received enough knowledge for study new types of graphical objects by yourself. You have also created step-by-step a complex indicator that can be easily and flexibly set up.
The previous articles from "MQL4 Language for Newbies" series:
- MQL4 Language for Newbies. Introduction
- MQL4 Language for Newbies. Difficult Questions in Simple Phrases
- MQL4 Language for Newbies. Technical Indicators and Built-In Functions
- MQL4 Language for Newbies. Custom Indicators (Part 1)
Warning: All rights to these materials are reserved by MetaQuotes Ltd. Copying or reprinting of these materials in whole or in part is prohibited.
This article was written by a user of the site and reflects their personal views. MetaQuotes Ltd is not responsible for the accuracy of the information presented, nor for any consequences resulting from the use of the solutions, strategies or recommendations described.
 Betting Modeling as Means of Developing "Market Intuition"
 Displaying a News Calendar
 Equivolume Charting Revisited
 Indicator Taichi - a Simple Idea of Formalizing the Values of Ichimoku Kinko Hyo
- Free trading apps
- Over 8,000 signals for copying
- Economic news for exploring financial markets
You agree to website policy and terms of use
usefull skills,thanks!
Hi Antoniuk,
Could you please rewrite singalTable.mq4 to mq5 ?
Thank you.
great job !!
thanks
Hi,
Good work and helpful to beginners!!
Antony
This is a great tutorial, learnt a lot, thanks :)
I've modified my own version but have come unstuck with one indicator I'm trying to incorporate, if anyone has any suggestions I've posted the topic here: http://forum.mql4.com/63450