
MQL4 Language for Newbies. Technical Indicators and Built-In Functions
Introduction
This is the third article from the series "MQL4 Language for Newbies". In the first two articles we learned the fundamentals of MQL4, the basis of further development. Now we will learn to use built-in functions and functions for working with technical indicators. The latter ones will be essential in the future development of your Expert Advisors and indicators. Besides we will see on a simple example, how we can trace trading signals for entering the market, for you to understand, how to use indicators correctly. And at the end of the article you will learn something new and interesting about the language itself.
Mathematical Functions
Let us start with the most simple, but still used and helpful mathematic functions.
MathAbs
Function Prototype:
double MathAbs(double value)
It is a very simple function, which returns the absolute value (number module). It means, if you, for example, use it for a negative number, as a result you will get a positive number.
Example of its usage:
int a=-10;
double b=-20.0;
double c=7.0;

a=MathAbs(a); // now a is equal to 10
b=MathAbs(b); // now b is equal to 20.0
c=MathAbs(c); // the value of c will not change, for it was positive
MathCeil, MathFloor and MathRound
Functions' prototypes:
double MathCeil(double x)
double MathFloor(double x)
double MathRound(double value)
These three functions are very much alike: all they round off a number to the whole number. But each of them has its own peculiarity:
MathCeil rounds up in such a way, that even if we have one thousandth of a whole number (for example, 1.001), it is considered a whole number. I.e. a number is rounded up to a higher value. For example:
double a;
a=MathCeil(1.001);  // a=2.0, even one thousandth is rounded off to a whole number
a=MathCeil(1.999);  // a=2.0
a=MathCeil(-1.001); // a=-1.0, it is correct, because -1.0 is more than -1.001
a=MathCeil(-1.999); // a=-1.0, it is correct, -1.0 is more than -1.999
MathFloor makes the same, as MathCeil, but quite opposite. I.e. if we need to round down a positive number, it will simply lose a fractional part:
double a;
a=MathFloor(1.999); // a=1.0, no matter how large the fractional part is, it will be taken away
a=MathFloor(1.001); // a=1.0
a=MathFloor(-1.001); // a=-2.0, correct, because -2.0 is less than -1.001
a=MathFloor(-1.999); // a=-2.0, correct, -2.0 is less than -1.999
MathRound rounds off numbers in a familiar to us way. I.e. if a fractional part is large (0.5 and more), it will be rounded off to 1. If the fractional part is small (less than 0.5), it will be rounded off to 0, i.e. it will be simply omitted. Examples:
double a;
a=MathRound(1.1);   // a=1.0, the fractional part is too small (0.1)
a=MathRound(1.57);  // a=2.0, the fractional part is enough to be rounded off to 1
a=MathRound(-3.1);  // a=-3.0 not enough
a=MathRound(-6.99); // a=-7.0 enough
MathMax
MathMin
Functions' prototypes:
double MathMax(double value1, double value2)
double MathMin(double value1, double value2)
These two functions are very much alike. They accept 2 arguments and return accordingly the largest and the smallest one. Examples:
double a;
a=MathMax(50.0,1.0);  // a=50.0
a=MathMin(10.0,12.0); // a=10.0
MathPow
Function prototype:
double MathPow(double base, double exponent)
This function allows raising a number base to the power exponent. Examples:
double a;
a=MathPow(5.0,2.0);  // a=25.0, 5 to the power 2
a=MathPow(2.0,8.0);  // a=256.0, 2 to the power 8
a=MathPow(25.0,0.5); // a=5.0, you know, a number to the power 0.5 is its square root
MathSqrt
Function prototype:
double MathSqrt(double x)
Take the square root using this function. But do not try to take the square root of a negative number. In this case a zero will be returned. Examples:
double a;
a=MathSqrt(9.0);    // a=3.0
a=MathSqrt(25.0);   // a=5.0
a=MathSqrt(-256.0); // a=0.0, I explained
MathLog
Function prototype:
double MathLog(double x)
Does anyone remember, what a logarithm is? Logarithm of a to the base b is equal to the power, to which you need to raise b, to get a. Widely used are logarithms to the bases e (Euler number) - natural logarithms (lna) and to the base 10 - common (Brigg's) logarithm (lg a). The more information about logarithms can be found at:
https://en.wikipedia.org/wiki/Logarithm
So, the function MathLog is intended for taking natural logarithm of the number x. Do not try to take natural logarithm of negative numbers or zero. In this case you will get -1. Examples of using the function:
double a;
a=MathLog(10.0);  // a=2.30258509
a=MathLog(0.0);   // a=-1.0, incorrect
a=MathLog(-10.0); // a=-1.0, incorrect
MathExp
Function prototype:
double MathExp(double d)
This function returns number e, raised to the power d. Many of you must have forgotten this number.
e is a mathematical constant, base of natural logarithm, irrational and transcendental number. e = 2,718281828459045… Sometimes e is called Eulerian number or Napierian number. Plays an important role in the differential and integral calculus. More information about Eulerian number is at:
http://en.wikipedia.org/wiki/Eulerian_number
If you indicate a very large degree, overflow will take place, zero will be returned. How large should be the degree for a mistake? Let us find it, let us conduct a small experiment:
double exponent=1.0; // here the degree value will be stored
double result=1.0;   // result, returned by the function
int i=0;             // number of cycle iterations

while(result!=0.0)   // while the result is not equal to zero (while there is no overflowing)
{
   result=MathExp(exponent); // remember the result
   exponent*=10.0;           // increase the degree
   i++;                      // the next iteration is over
}
MessageBox("i="+i); // result of the experiment
The following happens: each time we try to call the function MathExp and with each iteration the degree is increased 10 times until finally we get the overflow and zero is returned. I got the following result: i=310. It means you can use as a degree numbers 1*10 to the power 309 (just imagine a number at a length of 309 digits!!). So I think you should not be afraid of the overflow.
MathMod
Function prototype:
double MathMod(double value,double value2)
This function allows finding a residue of division. For example, dividing 5 by 2 we get 2 and residue 1. The first argument value - dividend, value2 - divisor. The residue is returned. Examples:
double a;

a=MathExp(5,2); // a=1.0
a=MathExp(10,3); // a=1.0, correct
a=MathExp(50,10); // a=0.0, divided without residue
MathRand and MathSrand
Functions' prototypes:
int MathRand()
void MathSrand(int seed)
MathRand returns one by one pseudorandom integers in the range from 0 till 32767. Here you may have some questions: what does "pseudo" mean? What a strange range, and what if I need from 5 to 10? Why exactly 32767? Here are the answers:
"Pseudo" means that the numbers are not entirely random and depend on something. Suppose, you have written a script, which returns 5 pseudorandom numbers. For example:
int a=0;

while(a<5)
{
   MessageBox(“random=”+MathRand());
   a++;
}
Well, the numbers are really random, but if you start the script once again, the sequence will be always the same. It is so, because there is a number, from which the function MathRand repulses. Let us call this number the beginning number. In order to change it, use another function - MathSrand. This function accepts a single argument - the beginning number, on which all pseudorandom numbers will depend. Imagine that the beginning number is a fruit, from which a tree (random numbers) will grow. On default the beginning number is 1. So, in order to get a really random sequence, we first need to assign a unique value to the beginning number. How can we do this? There is one more function - TimeLocal, which does not have arguments and returns the number of seconds, passed after 00:00 the 1st of January, 1970. This function suits ideally, because in most cases we will receive a unique number. Didn't you get tangled yet? It looks like this:
int a=0;
MathSrand(TimeLocal()); // assign a unique value to the beginning number

while(a<5)
{
   MessageBox(“random=”+MathRand());
   a++;
}
Now each time we will get a new sequence. Let us go on.
From 0 to 32767. Why 32767? Look: the maximal value that int can accept is 2 to power 16 (because the value of int variable occupies 16 bits in the computer memory, not considering the sign), it is equal to 32768, but as we count from zero, we need to subtract 1. So we get 32767.
In order to get any necessary range, use the operator % - residue in division. For example, if we need to get random numbers in the range from 0 to 5:
int a=0;
MathSrand(TimeLocal());
while(a<5)
{
   MessageBox(“random=”+MathRand()%6);
   a++;
}
Please note, that we wrote MathRand()%6, not MathRand()%5 - while our range starts from zero, we need to add 1. Now suppose we need random numbers in the range from 5 to 10:
MessageBox(“random=”+MathRand()%6+5); // just add the necessary shift
The same is when we need to get a range with negative numbers, for example from -5 to 5:
MessageBox(“random=”+MathRand()%11-5);
If you need only negative numbers, multiply the result by -1. For example we need the range from -10 to -20:
MessageBox(“random=”+(MathRand()%11+10)*(-1));
If you need to get a non-integral, for example in the range from 0.0 to 1.0 accurate to thousandth, use the following code:
MessageBox(“random=”+MathRand()%1001/1000.0);
First we create a random number in the range from 0 to 1000 and then divide it by 1000.0. Note, that we must divide exactly by 1000.0 (with a floating point), not by 1000 (integer). Otherwise we get zero, because it will be rounded off.
Trigonometric and arc-trigonometric functions
Trigonometric functions are mathematic functions from an angle. They are important in the analysis of periodical processes. Very close to them are arc-trigonometric functions. More information is here:
https://en.wikipedia.org/wiki/Trigonometric_function
https://en.wikipedia.org/wiki/ArcSin
In MQL4 all these functions accept arguments in radians, not degrees. I.e. if you need to find sine of 20 degree, you must first turn 20 degrees into radians. For example:
MathSin(20.0*3.14159/180.0);
I.e. 1 grade = pi/ 180. It is convenient to declare and use the constant at the beginning of a program, if you often use trigonometric functions:
#define PI 3.1415926535897
MathSin, MathCos, MathTan, MathArcsin, MathArccos and MathArctan
Functions' prototypes:
double MathSin(double value)
double MathCos(double value)
double MathTan(double x)
double MathArcsin(double x)
double MathArccos(double x)
double MathArctan(double x)
Let us dwell on the peculiarities of some functions. MathTan accepts values in the range from -263 to 263, if you exceed the limits, the number will be indefinite. MathArcsin and MathArccos accept values in the range from -1 to 1, otherwise you will get zero and the appropriate message in EA journal. MathArctan returns 0, if it accepts 0.
New Functions for Displaying Messages
By now you know only one function for displaying information - MessageBox. Now you will learn three more functions that are very much alike, but have their own peculiarities.
Alert
Function prototype:
void Alert(...)
Displays a dialogue window containing your signals (information). At calling the function, you will hear a special signal, which can be changed or disabled in the terminal settings: Service -> Settings -> tab Events. The window will look like this:
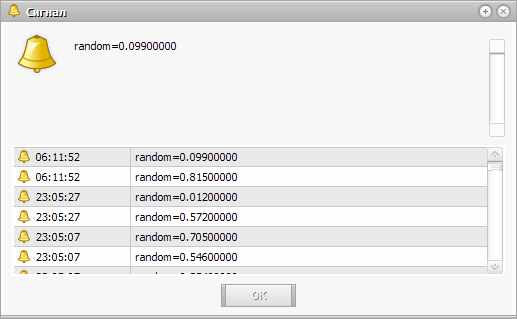
You can change the size of the window for an easy viewing of a large amount of information. Besides, you can always view the last callings of the function, because they are not deleted. You can also perform several callings successively, you will get a window with an active last signal, and you do not need to click "OK" each time. You can use the function similar to MessageBox:
Alert(“signal type:”+signalType);
Alert(“random=”+MathRand()%1001);
Though the intention was different. You are supposed simply to enumerate parameters for entering, comma separated. I.e. it is like in the example above, but using "," instead of "+". I recommend using the second variant:
Alert(“signal type:”,signalType);
Alert(“random=”,MathRand()%1001);
Comment
Function prototype:
void Comment(...)
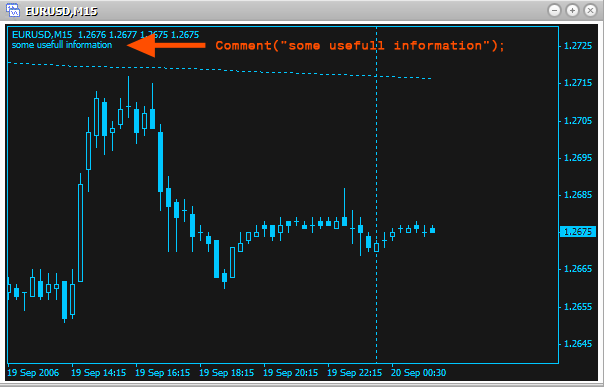
Similar function, identical in usage, displaying a message in the upper left corner of a chart. Here you do not have to click anything to have the code performed. Use this function, for example, for showing the current state. Example:
Comment(“some usefull information”);
Function Prototype:
void Print( ...)
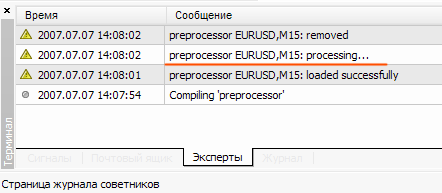
One more analogous function, displaying messages in Expert Advisors' journal:
Print(“processing...”);
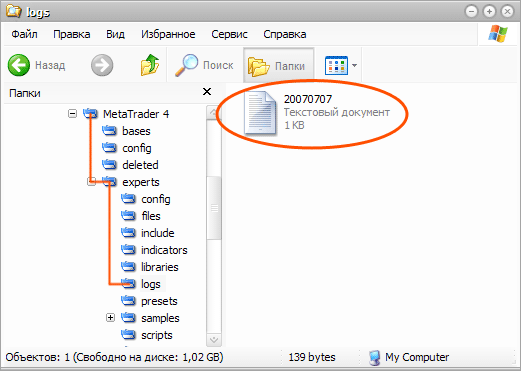
Besides, the journal saves all messages in a correspondent file (the name of the file corresponds to the date) on your computer in the folder MetaTrader 4\experts\logs:
Also some notes about the three functions should be made. You cannot display arrays, simply indicating them, like a parameter. They should be displayed element-by-element, for example like this:
for(int a=0;a<100;a++)
Alert("Close[",a,"]=",Close[a]);
You can display maximum 64 parameters in each function. Each calling of the function Alert is also written in an Expert Advisor journal. The type double will be displayed accurate to 4 numbers after a point.
Technical Indicators
Almost all Expert Advisors use technical indicators. If you look at a simple EA included into the installation file (MACD Sample), you will see that it uses technical indicators. Now you will learn how to get values of all available technical indicators. There is a correspondent function to each technical indicator, which can count the value on any available security and timeframe. And you do not have to bother, if this indicator is now open on a chart or not. It does not matter.
Now let us view in details the parameters of technical indicators' functions. Actually the majority of them are repeated.
For example, all function we are going to dwell on, have similar 2 first arguments and 1 last for counting the values of technical indicators:
- symbol – the first argument defining which financial security (currency pair) should be used for counting the technical indicator values. I.e. to what chart the technical indicator should be used. To use an indicator on the current chart, use the constant NULL (or 0). The current chart here means the chart, on which you will start your script (Expert Advisor, indicator). If you need another security, you can use its name as a string ("EURUSD","GBPUSD" etc.).
- timeframe – the second argument, which defines on what timeframe the indicator should be used. If you need a timeframe, used on the current chart, use 0 (zero). If you need another timeframe, use one of the predefined constants:
- PERIOD_M1 - 1 minute
- PERIOD_M5 - 5 minutes
- PERIOD_M15 - 15 minutes
- PERIOD_M30 - 30 minutes
- PERIOD_H1 - 1 hour
- PERIOD_H4 - 4 hours
- PERIOD_D1 - 1 day
- PERIOD_W1 - 1 week
- PERIOD_MN1 - 1 month
- shift – the last argument defining on what bar the indicator should be used. Remember the first article: to find the close price of the last bar we used indexes, starting from zero. I.e. Close [0] - close price of the last bar, Close[1] - the last but one etc. Well, this argument works the same way as an index in arrays. To find the value of the indicator on the last bar, shift must be equal to 0, on the last but one - 1 and so on.
Technical indicators very often use for counting mean values on several bars. I.e. they take different prices (opening, closing, etc.) on several bars and find the mean value using a definite method. Also very often shifting is used. So among the parameters you can find the following:
- applied_price – defines what type of prices should be used for getting the mean value. There are the following predefined constants for choosing the used price:
- PRICE_CLOSE - close price
- PRICE_OPEN - open price
- PRICE_HIGH - maximal price
- PRICE_LOW - minimal price
- PRICE_MEDIAN - average price, (high+low)/2
- PRICE_TYPICAL - typical price, (high+low+close)/3
- PRICE_WEIGHTED - weighted close price, (high+low+close+close)/4
- ma_method – defines a method, used for receiving mean values. There are the following predefined constants for choosing a method:
- MODE_SMA - simple moving average
- MODE_EMA - exponential moving average
- MODE_SMMA - smoothed moving average
- MODE_LWMA - linearly weighted moving average
- period – defines how many bars will be used for getting the mean value.
- ma_shift – shift of midline in bars. If the shift is positive, the line is shifted to the right. And on the contrary, if the shift is negative, the line is shifted to the left.
The above described parameters will occur very often. So, when you see such parameters, you should understand that this function uses mean values for the calculation of its values. To learn, how exactly the values are calculated, and what part mean values take in it, use the link that is after a short description of each function.
One more important moment: all these indicators (functions) can be divided into two categories:
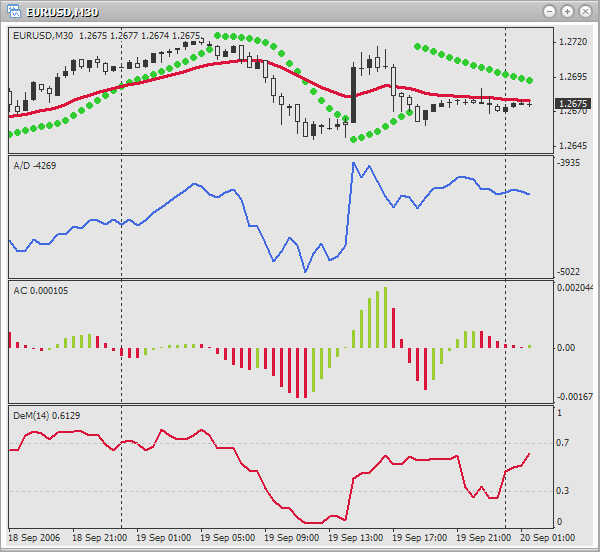
- simple – when an indicator has only one value. For example: Acceleration/Deceleration (AC), Accumulation/Distribution (A/D), DeMarker (DeM) etc. I.e. the indicator has only one line/histogram, the value of which is returned at calling the appropriate function. Here is an example of several simple indicators used on one chart:
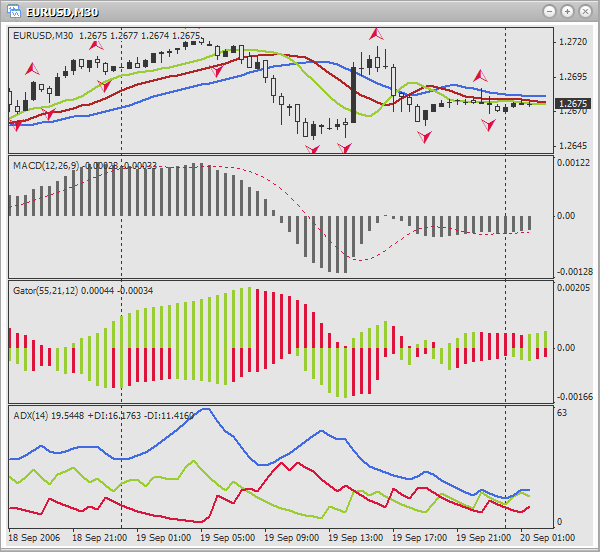
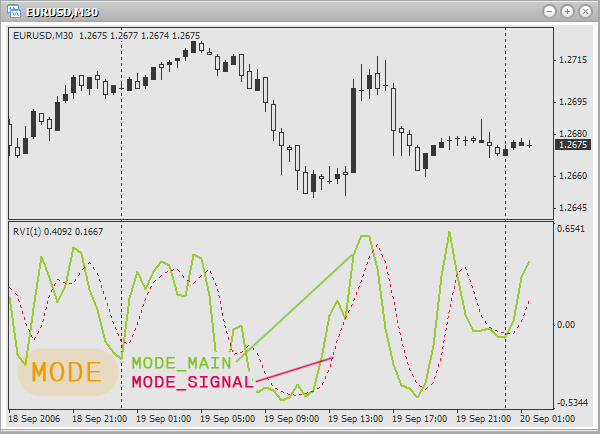
- complex – when an indicator has several values (lines). For example: Alligator, Average Directional Movement Index (ADX), Bollinger Bands (BB), Average Convergence/Divergence (MACD) etc. In such a case you should indicate, what value (line) the indicator should return. For this purpose in all functions of complex indicators the parameter mode is used. Using certain constants you indicate, what should be returned. Here is an example of several complex indicators used on one chart:
Each function description will be supported by a descriptive picture, examples of usage (different colors are used for better visualization of what is in charge of what) and a link with the indicator description (how to use it in trading, the meaning of the indicator). You are supposed to be acquainted with indicators and to use it in practice. I recommend reading the description of functions in this article in order to understand how to use them, and view the examples. But for remembering the assignment of each argument in future, use Help in MetaEditor. Open the window ToolBox using hot keys Ctrl+T and go to the tab Help. There you will find the description of each parameter, as well as a convenient list of all functions, so you will easily find what you need. The language of Help can be changed using menu View->Languages. After that restart MetaEditor.
Acceleration/Deceleration (AC)
The indicator Acceleration/Deceleration (AC) is used for changing the speed of price changes (acceleration, deceleration). https://www.metatrader5.com/en/terminal/help/indicators/bw_indicators/ao
Function prototype:
double iAC(string symbol, int timeframe, int shift)
Parameters:
- symbol – defines, which financial security (currency pair) should be used for the calculation of a technical indicator values. Use NULL (or 0), if you need the current (active) security (chart).
- timeframe – defines, on which timeframe (period) the indicator should be used. Use 0 for the current period or one of constants (PERIOD_M1, PERIOD_M5, PERIOD_M15, PERIOD_M30, PERIOD_H1, PERIOD_H4, PERIOD_D1, PERIOD_W1, PERIOD_MN1).
- shift – defines, to what bar the indicator should be used.
Examples of usage:
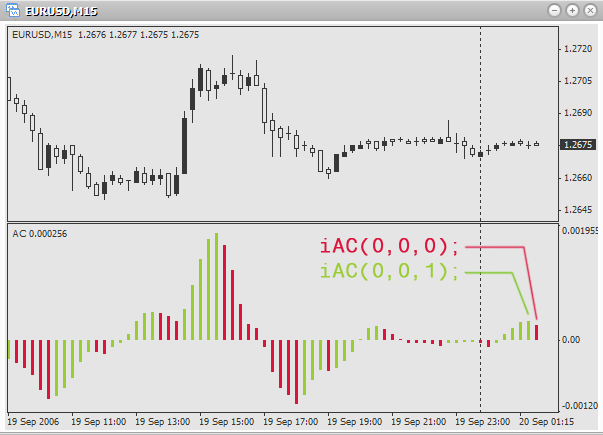
double ac;

ac=iAC(0,0,0);
// acceleration of the last bar on the active chart and timeframe

ac=iAC(0,0,1);
// acceleration of the last but one bar on the active chart and timeframe

ac=iAC("GBPUSD",PERIOD_M30,0);
// acceleration of the last bar on the chart GBPUSD, timeframe - 30 minutes
Accumulation/Distribution (A/D)
The indicator Accumulation/Distribution (A/D) is used for confirming price changes through volume calculation.
https://www.metatrader5.com/en/terminal/help/indicators/volume_indicators/ad
Function prototype:
double iAD(string symbol, int timeframe, int shift)
Parameters:
- symbol – defines, which financial security (currency pair) should be used for the calculation of a technical indicator values. Use NULL (or 0), if you need the current (active) security (chart).
- timeframe – defines, on which timeframe (period) the indicator should be used. Use 0 for the current period or one of constants (PERIOD_M1, PERIOD_M5, PERIOD_M15, PERIOD_M30, PERIOD_H1, PERIOD_H4, PERIOD_D1, PERIOD_W1, PERIOD_MN1).
- shift – defines, to what bar the indicator should be used.
Examples of usage:
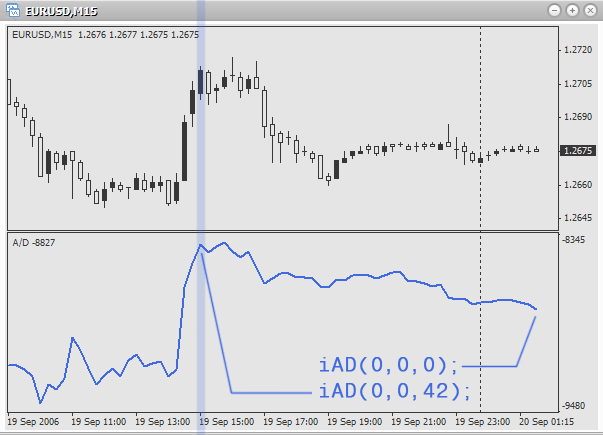
double ad;

ad=iAD(0,0,0);
// accumulation on the last bar on the current chart and period

ad=iAD(0,0,Bars-1);
// accumulation on the first available bar, active chart and period

ad=iAD("GBPUSD",PERIOD_M5,5);
// accumulation on the 6th last bar on GBPUSD, period - 5 minutes
Alligator
The indicator Alligator is the combination of 3 moving averages, using fractal geometry and nonlinear dynamics.
https://www.metatrader5.com/en/terminal/help/indicators/bw_indicators/alligator
Function prototype:
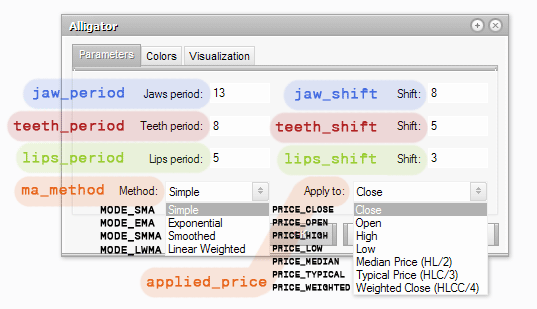
double iAlligator( string symbol, int timeframe, int jaw_period, int jaw_shift, int teeth_period,
                   int teeth_shift, int lips_period, int lips_shift, int ma_method, int applied_price,
                   int mode, int shift)
Parameters:
- symbol – defines, which financial security (currency pair) should be used for the calculation of a technical indicator values. Use NULL (or 0), if you need the current (active) security (chart).
- timeframe – defines, on which timeframe (period) the indicator should be used. Use 0 for the current period or one of constants (PERIOD_M1, PERIOD_M5, PERIOD_M15, PERIOD_M30, PERIOD_H1, PERIOD_H4, PERIOD_D1, PERIOD_W1, PERIOD_MN1).
- jaw_period - the period of averaging of the alligator's jaw (blue line)
- jaw_shift - shift of the alligator's jaw
- teeth_period - the period of averaging of the alligator's teeth (red line)
- teeth_shift - shift of the alligator's teeth
- lips_period - the period of averaging of the alligator's lips (green line)
- lips_shift - shift of the alligator's lips
- ma_method – defines a method, used for receiving mean values. There are the following predefined constants for choosing a method:
- MODE_SMA - simple moving average
- MODE_EMA - exponential moving average
- MODE_SMMA - smoothed moving average
- MODE_LWMA - linearly weighted moving average
- applied_price – define the price to be used (what will be averaged). There are the following predefined constants for choosing the used price:
- PRICE_CLOSE - close price
- PRICE_OPEN - open price
- PRICE_HIGH - maximal price
- PRICE_LOW - minimal price
- PRICE_MEDIAN - average price, (high+low)/2
- PRICE_TYPICAL - typical price, (high+low+close)/3
- PRICE_WEIGHTED - weighted close price, (high+low+close+close)/4
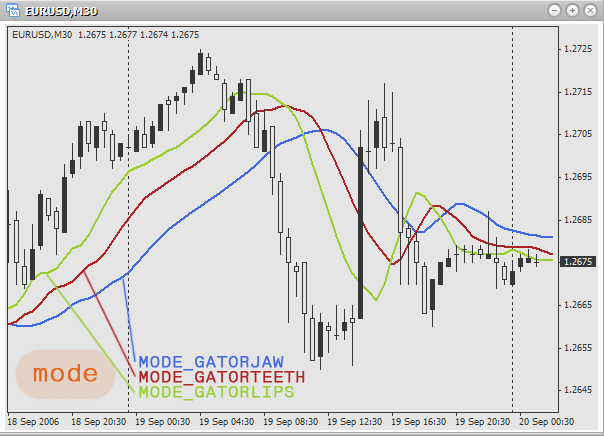
- mode – defines, the value of what you want to find (jaws, teeth or lips). For choosing use one of the constants:
- MODE_GATORJAW - line of the alligator's jaw (blue)
- MODE_GATORTEETH - line of the alligator's teeth (red)
- MODE_GATORLIPS - line of the alligator's lips (green)
- shift – defines, to what bar the indicator should be used.
Look, what the function arguments are responsible for, when using Alligator on a chart. Such analogy will help you:
Using the parameter mode, define what should be returned:
Examples of usage:
double jaw;
double teeth;
double lips;

jaw=iAlligator(0,0,13,8,8,5,5,3,MODE_SMA,PRICE_MEDIAN,MODE_GATORJAW,0);
// find the values of "jaws" (blue line) on the current chart and period.
// Here simple moving average is used, price – average. Periods
// of averaging for jaws, teeth and lips – 13, 8 and 8 accordingly. Shift:
// 5, 5 and 3 accordingly. The value is taken for the last bar.

teeth=iAlligator(“EURUSD”,PERIOD_H1,128,96,64,0,0,0,MODE_EMA,PRICE_TYPICAL,MODE_GATORTEETH,1);
// find the values of "teeth" (red line) on an hour chart EURUSD.
// Exponential moving average and typical price are used.
// Periods of averaging: 128, 96 and 64. Shift is not used. The value
// is taken for the last but one bar.

lips=iAlligator(“GBPUSD”,PERIOD_D1,21,18,13,5,3,0,MODE_SMMA,PRICE_WEIGHTED,MODE_GATORLIPS,5);
// find the values of "lips" (green line) on a daily chart GBPUSD.
// Uses smoothed moving average and weighted close price.
// Periods of averaging: 21, 18 and 13. Shift: 5, 3 and 0. The value
// is taken for the 5th last bar.
Average Directional Movement Index (ADX)
The indicator Average Directional Movement Index (ADX) is used to determine the presence of a price trend.
https://www.metatrader5.com/en/terminal/help/indicators/trend_indicators/admi
Function prototype:
double iADX(string symbol,int timeframe,int period,int applied_price,int mode,int shift)
Parameters:
- symbol – defines, which financial security (currency pair) should be used for the calculation of a technical indicator values. Use NULL (or 0), if you need the current (active) security (chart).
- timeframe – defines, on which timeframe (period) the indicator should be used. Use 0 for the current period or one of constants (PERIOD_M1, PERIOD_M5, PERIOD_M15, PERIOD_M30, PERIOD_H1, PERIOD_H4, PERIOD_D1, PERIOD_W1, PERIOD_MN1).
- period – the number of bars, used to find the mean value.
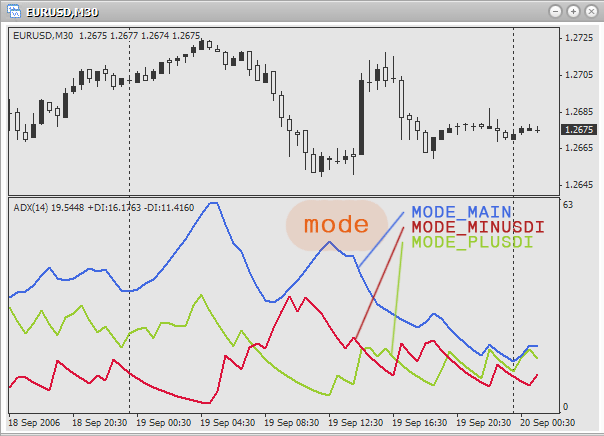
- mode – choose a line, the value of which will be received. Use the following predetermined constants:
- MODE_MAIN - the main line
- MODE_PLUSDI - line +DI
- MODE_MINUSDI - line –DI
- shift – defines, to what bar the indicator should be used.
Using the parameter mode define, what should be returned:
Examples of usage:
double main;    // main line
double plusDi;  // line +DI
double minusDi; // line -DI

main=iADX(0,0,3,PRICE_CLOSE,MODE_MAIN,0);
// find the value of the main line on the active chart and period on the last bar.
// Uses averaging on 3 bars, uses close price.

plusDi=iADX(“USDCAD”,PERIOD_M1,6,PRICE_OPEN,MODE_PLUSDI,1);
// find the value of line +DI on the minute chart USDCAD on the second last bar.
// Uses averaging on 6 bars, uses open price.

minusDi=iADX(“AUDUSD”,PERIOD_H1,10,PRICE_HIGH,MODE_MINUSDI,5);
// find the value of line -DI on the hour chart AUDUSD on the 6th last bar.
// Uses averaging on 10 bars, uses maximal price.
Average True Range (ATR)
The indicator Average True Range (ATR) is used to determine the market volatility.
https://www.metatrader5.com/en/terminal/help/indicators/oscillators/atr
Function prototype:
double iATR(string symbol,int timeframe,int period,int shift)
Parameters:
- symbol – defines, which financial security (currency pair) should be used for the calculation of a technical indicator values. Use NULL (or 0), if you need the current (active) security (chart).
- timeframe – defines, on which timeframe (period) the indicator should be used. Use 0 for the current period or one of constants (PERIOD_M1, PERIOD_M5, PERIOD_M15, PERIOD_M30, PERIOD_H1, PERIOD_H4, PERIOD_D1, PERIOD_W1, PERIOD_MN1).
- period – the number of bars, used to find the mean value.
- shift – defines, to what bar the indicator should be used.
Examples of usage:
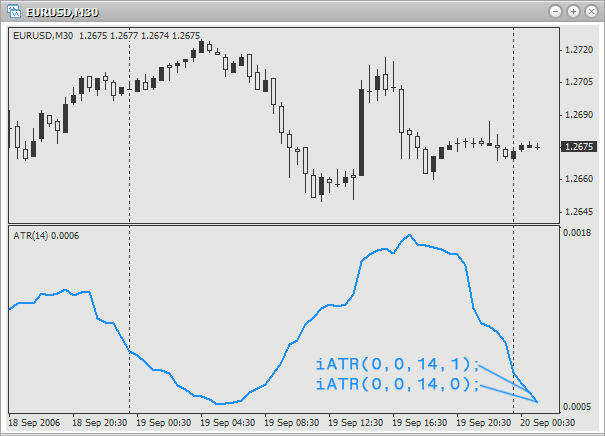
double atr;

atr=iATR(0,0,15,0);
// volatility of the last bar on the active chart and period.
// Uses 15 bars to get the mean value.

atr=iATR(“EURUSD”,PERIOD_M15,5,1);
// volatility of the last but one bar on a 15 minute chart EURUSD.
// Uses 5 bars to get the mean value.

atr=iATR(“USDCAD”,PERIOD_H1,32,0);
// volatility of the last bar on an hour chart USDCAD.
// Uses 32 bars to get the mean value.
Awesome Oscillator (AO) by Bill Williams
The indicator Awesome Oscillator (AO)by Bill Williams is used to determine market moving forces.
https://www.metatrader5.com/en/terminal/help/indicators/bw_indicators/awesome
Function prototype:
double iAO( string symbol, int timeframe, int shift)
Parameters:
- symbol – defines, which financial security (currency pair) should be used for the calculation of a technical indicator values. Use NULL (or 0), if you need the current (active) security (chart).
- timeframe – defines, on which timeframe (period) the indicator should be used. Use 0 for the current period or one of constants (PERIOD_M1, PERIOD_M5, PERIOD_M15, PERIOD_M30, PERIOD_H1, PERIOD_H4, PERIOD_D1, PERIOD_W1, PERIOD_MN1).
- shift – defines, to what bar the indicator should be used.
Examples of usage:
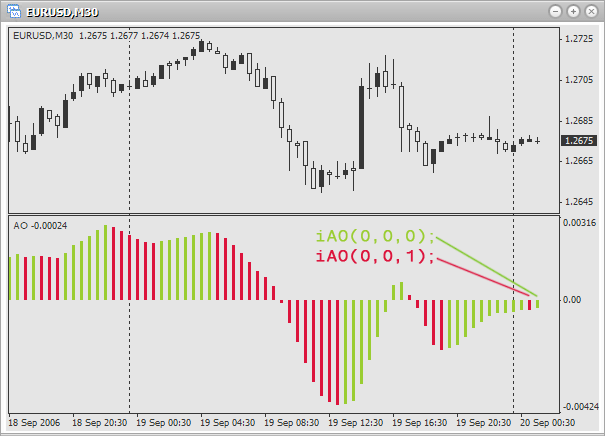
double ao;

ao=iAO(0,0,0);
// moving force of the last bar on the active chart and period

ao=iAO(“EURUSD”,PERIOD_M5,0);
// moving force of the last bar on 5-minute chart EURUSD

ao=iAO(“EURAUD”,PERIOD_W1,1);
// moving force of the last but one bar on a weekly chart EURAUD
Bears Power
The indicator Bears Power is used for estimating the balance of "bears'" power.
http://www.fibo-forex.ru/pages.php?page=1799
Function prototype:
double iBearsPower(string symbol,int timeframe,int period,int applied_price,int shift)
Parameters:
- symbol – defines, which financial security (currency pair) should be used for the calculation of a technical indicator values. Use NULL (or 0), if you need the current (active) security (chart).
- timeframe – defines, on which timeframe (period) the indicator should be used. Use 0 for the current period or one of constants (PERIOD_M1, PERIOD_M5, PERIOD_M15, PERIOD_M30, PERIOD_H1, PERIOD_H4, PERIOD_D1, PERIOD_W1, PERIOD_MN1).
- period - the number of bars, used to find the mean value.
- applied_price – define the price to be used (what will be averaged). There are the following predefined constants for choosing the used price:
- PRICE_CLOSE - close price
- PRICE_OPEN - open price
- PRICE_HIGH - maximal price
- PRICE_LOW - minimal price
- PRICE_MEDIAN - average price, (high+low)/2
- PRICE_TYPICAL - typical price, (high+low+close)/3
- PRICE_WEIGHTED - weighted close price, (high+low+close+close)/4
- shift – defines, to what bar the indicator should be used.
Examples of usage:
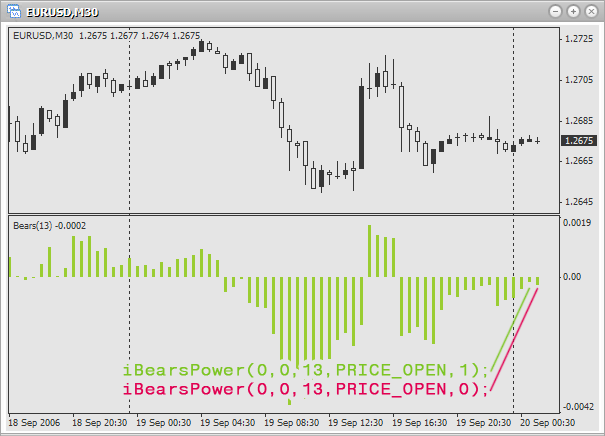
double bp;

bp=iBearsPower(0,0,5,PRICE_OPEN,0);
// balance of the last bar on the active chart and period. Use 5 bars for averaging and opening prpice.

bp=iBearsPower("EURUSD",PERIOD_M5,32,PRICE_CLOSE,1);
// balance of the last but one bar on 5-minute chart EURUSD. Use 32 bars for averaging and close price.

bp=iBearsPower("EURGBP",PERIOD_D1,51,PRICE_MEDIAN,0);
// balance of the last bar on a daily chart EURGBP. Use 51 bars for averaging and average price.
Bollinger Bands (BB)
The indicator Bollinger Bands (BB) is used to determine upper and lower limits of the normal range of price fluctuations.
https://www.metatrader5.com/en/terminal/help/indicators/trend_indicators/bb
Function prototype:
double iBands( string symbol, int timeframe, int period, int deviation, int bands_shift,
               int applied_price, int mode, int shift)
Parameters:
- symbol – defines, which financial security (currency pair) should be used for the calculation of a technical indicator values. Use NULL (or 0), if you need the current (active) security (chart).
- timeframe – defines, on which timeframe (period) the indicator should be used. Use 0 for the current period or one of constants (PERIOD_M1, PERIOD_M5, PERIOD_M15, PERIOD_M30, PERIOD_H1, PERIOD_H4, PERIOD_D1, PERIOD_W1, PERIOD_MN1).
- period - the number of bars, used to find the mean value.
- deviation – deviation from the main line.
- bands_shift - shift about prices.
- applied_price – define the price to be used (what will be averaged). There are the following predefined constants for choosing the used price:
- PRICE_CLOSE - close price
- PRICE_OPEN - open price
- PRICE_HIGH - maximal price
- PRICE_LOW - minimal price
- PRICE_MEDIAN - average price, (high+low)/2
- PRICE_TYPICAL - typical price, (high+low+close)/3
- PRICE_WEIGHTED - weighted close price, (high+low+close+close)/4
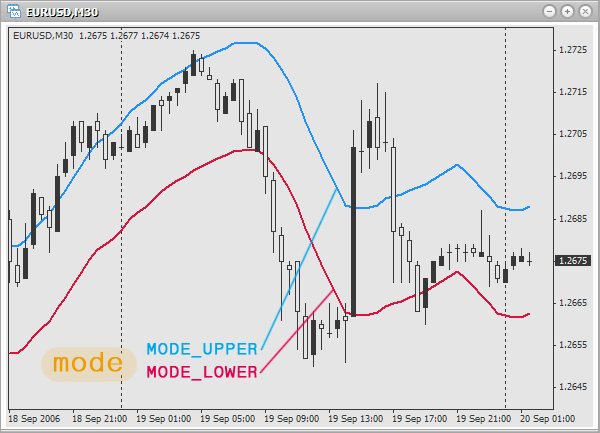
- mode – choose a line, the value of which will be found. Use the following predetermined constants:
- MODE_UPPER - upper line
- MODE_LOWER - lower line
- MODE_UPPER - upper line
- shift – defines, to what bar the indicator should be used.
Using the parameter mode define, what should be returned:
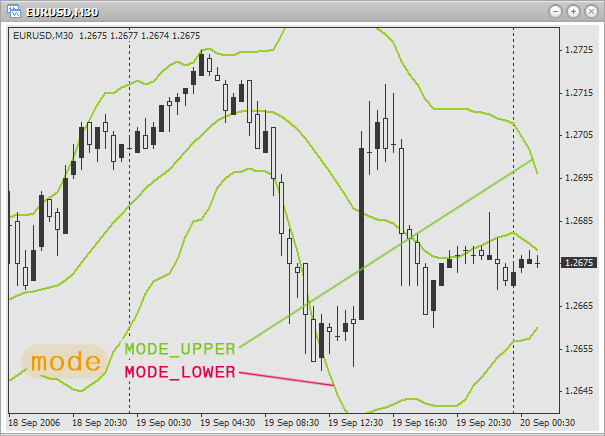
Examples of usage:
double bb;

bb=iBands
(0,0,20,2,0,PRICE_LOW,MODE_LOWER,0);
// lower limit of the last bar on the active chart and period.
// Use 20 bars for averaging, and the minimal price.
// Deviation from the main line is 2, shift is not used.

bb=iBands("EURUSD",PERIOD_H1,13,2,3,PRICE_HIGH,MODE_UPPER,1);
// upper limit of the last but one bar on an hour chart EURUSD.
// Use 13 bars for averaging, and the maximal price.
// Deviation from the main line is 2, shift is 3 bars.

bb=iBands("EURGBP",PERIOD_D1,21,3,4,PRICE_HIGH,MODE_UPPER,0);
// upper limit of the last bar on a daily chart EURGBP.
// Use 21 bars for averaging, and the maximal price.
// Deviation from the main line is 2, shift is 4 bars.
Bulls Power
The indicator Bulls Power is used for estimating the balance of "bulls'" power.
http://www.forexdealer.net/help/bul_hlp.htm
Function prototype:
double iBullsPower(string symbol, int timeframe, int period, int applied_price, int shift)
Parameters:
- symbol – defines, which financial security (currency pair) should be used for the calculation of a technical indicator values. Use NULL (or 0), if you need the current (active) security (chart).
- timeframe – defines, on which timeframe (period) the indicator should be used. Use 0 for the current period or one of constants (PERIOD_M1, PERIOD_M5, PERIOD_M15, PERIOD_M30, PERIOD_H1, PERIOD_H4, PERIOD_D1, PERIOD_W1, PERIOD_MN1).
- period - the number of bars, used to find the mean value.
- applied_price – define the price to be used (what will be averaged). There are the following predefined constants for choosing the used price:
- PRICE_CLOSE - close price
- PRICE_OPEN - open price
- PRICE_HIGH - maximal price
- PRICE_LOW - minimal price
- PRICE_MEDIAN - average price, (high+low)/2
- PRICE_TYPICAL - typical price, (high+low+close)/3
- PRICE_WEIGHTED - weighted close price, (high+low+close+close)/4
- shift – defines, to what bar the indicator should be used.
Examples of usage:
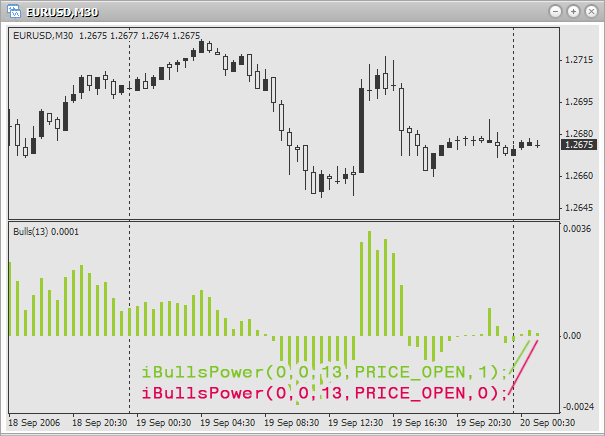
double bp;

bp=iBullsPower(0,0,10,PRICE_CLOSE,1);
// balance of the last but one bar on the active chart and period. Use 10 bars for averaging
// and close price.

bp=iBullsPower("EURGBP",PERIOD_M1,21,PRICE_HIGH,1);
// balance of the last bar on a minute chart EURGBP. Use 21 bars for averaging and the maximal price.

bp=iBullsPower("EURUSD",PERIOD_H1,33,PRICE_MEDIAN,0);
// balance of the last bar on an hour chart EURUSD. Use 33 bars for averaging and the average price.
Commodity Channel Index (CCI)
The indicator Commodity Channel Index (CCI) is used for measuring the deviation of the price from its average statistical price.
https://www.metatrader5.com/en/terminal/help/indicators/oscillators/cci
Function prototype:
double iCCI( string symbol, int timeframe, int period, int applied_price, int shift)
Parameters:
- symbol – defines, which financial security (currency pair) should be used for the calculation of a technical indicator values. Use NULL (or 0), if you need the current (active) security (chart).
- timeframe – defines, on which timeframe (period) the indicator should be used. Use 0 for the current period or one of constants (PERIOD_M1, PERIOD_M5, PERIOD_M15, PERIOD_M30, PERIOD_H1, PERIOD_H4, PERIOD_D1, PERIOD_W1, PERIOD_MN1).
- period - the number of bars, used to find the mean value.
- applied_price – define the price to be used (what will be averaged). There are the following predefined constants for choosing the used price:
- PRICE_CLOSE - close price
- PRICE_OPEN - open price
- PRICE_HIGH - maximal price
- PRICE_LOW - minimal price
- PRICE_MEDIAN - average price, (high+low)/2
- PRICE_TYPICAL - typical price, (high+low+close)/3
- PRICE_WEIGHTED - weighted close price, (high+low+close+close)/4
- shift – defines, to what bar the indicator should be used.
Examples of usage:
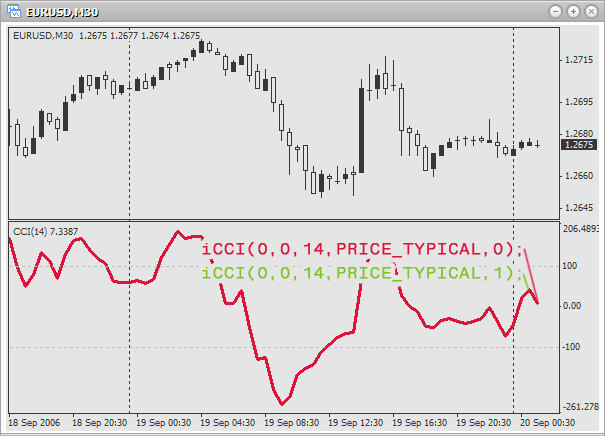
double cci;

cci=iCCI(0,0,14,PRICE_TYPICAL,0);
// index of the last bar on the active chart and period.
// Use 14 bars for finding the mean value and
// typical price.

cci=("EURUSD",PERIOD_M1,21,PRICE_HIGH,1);
// index of the last but one bar on a minute chart EURUSD.
// Use 21 bars for finding the mean value and
// maximal price.

cci=iCCI("EURGBP",PERIOD_D1,7,PRICE_CLOSE,0);
// index of the last bar on a daily chart EURGBP.
// Use 7 bars for finding the mean value and
// close price.
DeMarker (DeM)
The indicator DeMarker (DeM) is used to forecast price turn on the basis of the price difference of past bars.
https://www.metatrader5.com/en/terminal/help/indicators/oscillators/demarker
Function prototype:
double iDeMarker( string symbol, int timeframe, int period, int shift)
Parameters:
- symbol – defines, which financial security (currency pair) should be used for the calculation of a technical indicator values. Use NULL (or 0), if you need the current (active) security (chart).
- timeframe – defines, on which timeframe (period) the indicator should be used. Use 0 for the current period or one of constants (PERIOD_M1, PERIOD_M5, PERIOD_M15, PERIOD_M30, PERIOD_H1, PERIOD_H4, PERIOD_D1, PERIOD_W1, PERIOD_MN1).
- period - the number of bars, used to find the mean value.
- shift – defines, to what bar the indicator should be used.
Examples of useage:
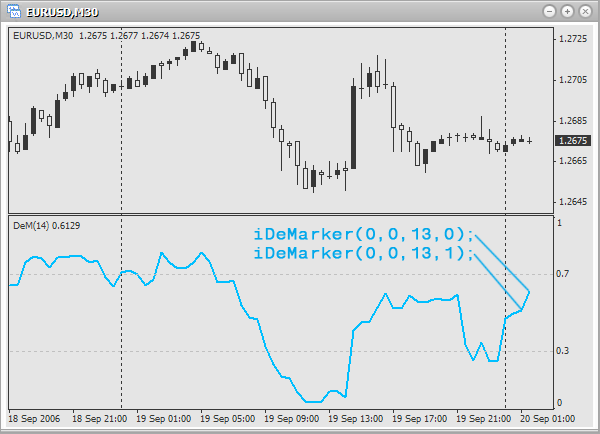
double dm;

dm=iDeMarker(0,0,13,0);
// DeMarker value of the last bar on the current chart and period.
// Use 13 bars to find the mean value.

dm=iDeMarker("EURJPY",PERIOD_H4,51,1);
// DeMarker value of the last but one bar on 4-hour chart EURJPY.
// Use 51 bars to find the mean value.

dm=iDeMarker("USDCAD",PERIOD_M30,21,0);
// DeMarker value of the last bar on 30-minutes chart USDCAD.
// Use 21 bars to find the mean value.
Envelopes
The indicator Envelopes is used to determine the limits of the price fluctuations on the basis of two moving averages.
https://www.metatrader5.com/en/terminal/help/indicators/trend_indicators/envelopes
Function prototype:
double iEnvelopes( string symbol, int timeframe, int ma_period, int ma_method, int ma_shift,
                   int applied_price, double deviation, int mode, int shift)
Parameters:
- symbol – defines, which financial security (currency pair) should be used for the calculation of a technical indicator values. Use NULL (or 0), if you need the current (active) security (chart).
- timeframe – defines, on which timeframe (period) the indicator should be used. Use 0 for the current period or one of constants (PERIOD_M1, PERIOD_M5, PERIOD_M15, PERIOD_M30, PERIOD_H1, PERIOD_H4, PERIOD_D1, PERIOD_W1, PERIOD_MN1).
- ma_period - the number of bars, used to find the main line.
- ma_method – defines the method, used to find mean values. There are the following predetermined constants for choosing a method:
- MODE_SMA - simple moving average
- MODE_EMA - exponential moving average
- MODE_SMMA - smoothed moving average
- MODE_LWMA - linearly-weighted moving average
- MODE_SMA - simple moving average
- ma_shift – shift of the indicator lines in bars. If the shift is positive, the indicator lines are shifted to the right. And on the contrary, if the shift is negative, lines are shifted to the left.
- applied_price – define the price to be used (what will be averaged). There are the following predefined constants for choosing the used price:
- PRICE_CLOSE - close price
- PRICE_OPEN - open price
- PRICE_HIGH - maximal price
- PRICE_LOW - minimal price
- PRICE_MEDIAN - average price, (high+low)/2
- PRICE_TYPICAL - typical price, (high+low+close)/3
- PRICE_WEIGHTED - weighted close price, (high+low+close+close)/4
- deviation – deviation from the main line in percentage. For example, if you write 0.1, this will mean 10%, 0.25 – 25% etc.
- mode - choose a line, the value of which will be found. Use the following predetermined constants:
- MODE_UPPER - upper line
- MODE_LOWER - lower line
- MODE_UPPER - upper line
- shift – defines, to what bar the indicator should be used.
Using the parameter mode define, what should be returned:
Examples of usage:
double e;

e=iEnvelopes(0,0,21,MODE_SMA,0,PRICE_CLOSE,0.05,MODE_LOWER,0);
// lower limit of the last bar on the active chart and period.
// Use 21 bars and close price for finding the value of simple moving
// average. Shift is not used. Deviation from the main
// line: 5%.

e=iEnvelopes("EURUSD",PERIOD_H1,13,MODE_SMMA,3,PRICE_MEDIAN,0.15,MODE_UPPER,1);
// upper limit of the last but one bar on an hour chart EURUSD.
// Use 13 bars and average price for finding the value of smoothed moving
// average. Shift: 3 bars. Deviation from the main line: 15%.

e=iEnvelopes("EURAUD",PERIOD_D1,7,MODE_EMA,2,PRICE_CLOSE,0.20,MODE_LOWER,0);
// lower limit of the last bar on a daily chart EURAUD.
// Use 7 bars and close price for finding the value of exponential
// moving average. Shift: 2 bars. Deviation from the main
// line: 20%.
Force Index (FRC)
The indicator Force Index (FRC) is used for measuring the power of "bulls" at each rise and the power of "bears" at each fall.
https://www.metatrader5.com/en/terminal/help/indicators/oscillators/fi
Function prototype:
double iForce( string symbol, int timeframe, int period, int ma_method,
               int applied_price, int shift)
Parameters:
- symbol – defines, which financial security (currency pair) should be used for the calculation of a technical indicator values. Use NULL (or 0), if you need the current (active) security (chart).
- timeframe – defines, on which timeframe (period) the indicator should be used. Use 0 for the current period or one of constants (PERIOD_M1, PERIOD_M5, PERIOD_M15, PERIOD_M30, PERIOD_H1, PERIOD_H4, PERIOD_D1, PERIOD_W1, PERIOD_MN1).
- period - the number of bars, used to find the mean value.
- ma_period - the number of bars, used to find the main line.
- ma_method – defines a method, used to find mean values.There are the following predetermined constants for choosing a method:
- MODE_SMA - simple moving average
- MODE_EMA - exponential moving average
- MODE_SMMA - smoothed moving average
- MODE_LWMA - linearly-weighted moving average
- MODE_SMA - simple moving average
- applied_price – define the price to be used (what will be averaged). There are the following predefined constants for choosing the used price:
- PRICE_CLOSE - close price
- PRICE_OPEN - open price
- PRICE_HIGH - maximal price
- PRICE_LOW - minimal price
- PRICE_MEDIAN - average price, (high+low)/2
- PRICE_TYPICAL - typical price, (high+low+close)/3
- PRICE_WEIGHTED - weighted close price, (high+low+close+close)/4
- shift – defines, to what bar the indicator should be used.
Examples of usage:
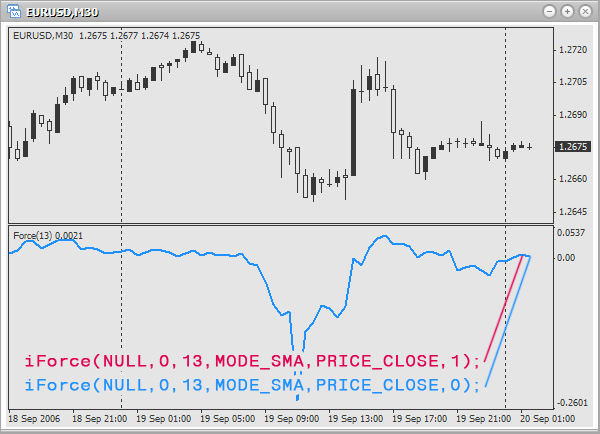
double f;

f=iForce(0,0,13,MODE_SMA,PRICE_CLOSE,0);
// force index of the last bar on the active chart and period. Period
// of averaging: 13 bars. Method of averaging: simple moving average.
// Use close price.

f=iForce("EURGBP",PERIOD_M5,21,MODE_LWMA,PRICE_HIGH,1);
// force index of the last but one bar on 5-minute chart EURGBP. Period
// of averaging: 21 bars. Method of averaging: linearly-weighted moving average.
// Use maximal price.

f=iForce("EURUSD",PERIOD_M1,32,MODE_SMMA,PRICE_MEDIAN,0);
// force index of the last bar on a minute chart EURUSD. Period
// of averaging: 32 bars. Method of averaging: smoothed moving average.
// Use average price.
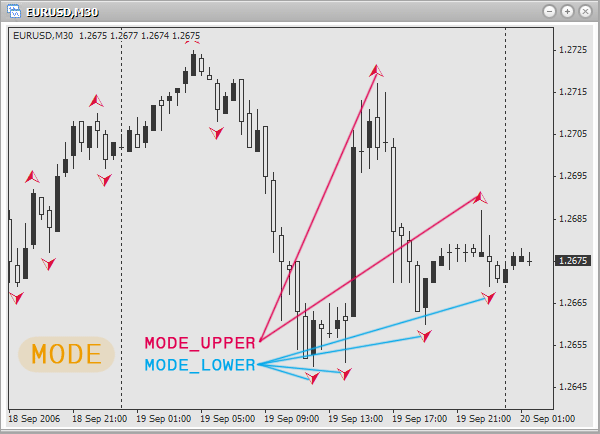
Fractals
Fractals are one of five indicators of the trading system of Bill Williams, used to detect bottoms and tops of a price chart. Fractals appear not on all bars. So, if a fractal did not appear on a bar, the function returns zero.
https://www.metatrader5.com/en/terminal/help/indicators/bw_indicators/fractals
Function prototype:
double iFractals( string symbol, int timeframe, int mode, int shift)
Parameters:
- symbol – defines, which financial security (currency pair) should be used for the calculation of a technical indicator values. Use NULL (or 0), if you need the current (active) security (chart).
- timeframe – defines, on which timeframe (period) the indicator should be used. Use 0 for the current period or one of constants (PERIOD_M1, PERIOD_M5, PERIOD_M15, PERIOD_M30, PERIOD_H1, PERIOD_H4, PERIOD_D1, PERIOD_W1, PERIOD_MN1).
- mode - choose a line, the value of which will be received. The following predetermined constants are used:
- MODE_UPPER - upper fractals
- MODE_LOWER - lower fractals
- MODE_UPPER - upper fractals
- shift – defines, to what bar the indicator should be used.
Using the parameter mode define, what should be returned:
Example of usage:
double f;

f=iFractals(0,0,MODE_UPPER,0);
// upper fractal of the last bar on the active chart and
// period.

f=iFractals("USDCAD",PERIOD_M5,MODE_LOWER,1);
// lower fractal of the last but one bar on 5-minute chart
// USDCAD.

f=iFractals("USDJPY",PERIOD_D1,MODE_UPPER,0);
// upper fractal of the last bar on a daily chart USDJPY.
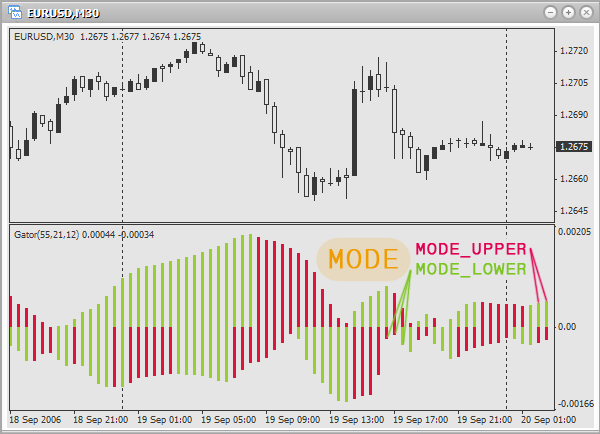
Gator Oscillator
Gator Oscillator is built on tha basis of the indicator Alligator and is used for measuring the degree of convergence or divergence of the balance lines.
https://www.metatrader5.com/en/terminal/help/indicators/bw_indicators/go
Function prototype:
double iGator( string symbol, int timeframe, int jaw_period, int jaw_shift, int teeth_period,
               int teeth_shift, int lips_period, int lips_shift, int ma_method,
               int applied_price, int mode, int shift)
Parameters:
- symbol – defines, which financial security (currency pair) should be used for the calculation of a technical indicator values. Use NULL (or 0), if you need the current (active) security (chart).
- timeframe – defines, on which timeframe (period) the indicator should be used. Use 0 for the current period or one of constants (PERIOD_M1, PERIOD_M5, PERIOD_M15, PERIOD_M30, PERIOD_H1, PERIOD_H4, PERIOD_D1, PERIOD_W1, PERIOD_MN1).
- jaw_period - the period of averaging of the alligator's jaw (blue line)
- jaw_shift - shift of the alligator's jaw
- teeth_period - the period of averaging of the alligator's teeth (red line)
- teeth_shift - shift of the alligator's teeth
- lips_period - the period of averaging of the alligator's lips (green line)
- lips_shift - shift of the alligator's lips
- ma_method – defines a method, used to find mean values.There are the following predetermined constants for choosing a method:
- MODE_SMA - simple moving average
- MODE_EMA - exponential moving average
- MODE_SMMA - smoothed moving average
- MODE_LWMA - Linearly-weighted moving average
- MODE_SMA - simple moving average
- applied_price – defines the price to be used (what will be averaged). There are the following predefined constants for choosing the used price:
- PRICE_CLOSE - close price
- PRICE_OPEN - open price
- PRICE_HIGH - maximal price
- PRICE_LOW - minimal price
- PRICE_MEDIAN - average price, (high+low)/2
- PRICE_TYPICAL - typical price, (high+low+close)/3
- PRICE_WEIGHTED - weighted close price, (high+low+close+close)/4
- mode – defines, the value of what you want to find (jaws, teeth or lips). For choosing use one of the constants:
- MODE_UPPER - upper histogram
- MODE_LOWER - lower histogram
- MODE_UPPER - upper histogram
- shift – defines, to what bar the indicator should be used.
Using the parameter mode define, what should be returned:
Examples of usage:
double g;

g=iGator(0,0,13,8,8,0,0,0,MODE_SMA,PRICE_CLOSE,MODE_UPPER,0);
// upper histogram of the last bar on the active chart and period. Periods of
// averaging for jaw, teeth and lips accordingly: 13,8,8. Shift is not used.
// For averaging use close price and the method of a simple moving average.

g=iGator("EURGBP",PERIOD_M1,21,13,9,4,3,2,MODE_SMMA,PRICE_OPEN,MODE_LOWER,1);
// lower histogram of the last but one bar on a minute chart EURGBP. Periods of
// averaging for jaw, teeth and lips accordingly: 21,13,9. Shifts accordingly:
// 4,3 and 2. For averaging use open price and the method of smoothed
// moving average.

g=iGator("USDCAD",PERIOD_D1,51,21,13,8,5,4,MODE_EMA,PRICE_MEDIAN,MODE_UPPER,0);
// upper histogram of the last bar on a daily chart USDCAD. Periods of
// averaging for jaw, teeth and lips accordingly: 51,21,13. Shifts accordingly: 8,5 and 4.
// For averaging use average price and the method of exponential moving average.
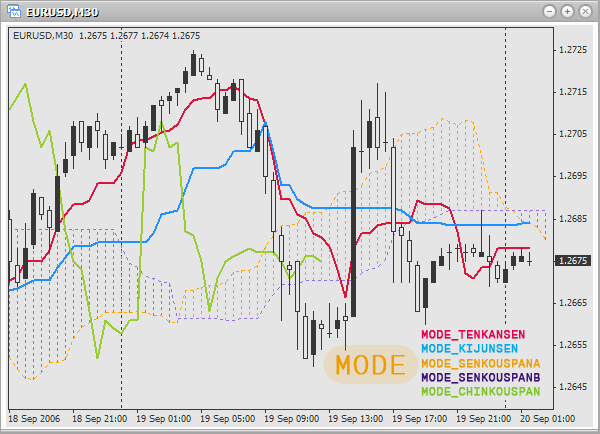
Ichimoku Kinko Hyo
The indicator Ichimoku Kinko Hyo is used to define a trend, support and resistance levels, as well as signals to buy and to sell.
https://www.metatrader5.com/en/terminal/help/indicators/trend_indicators/ikh
Function prototype:
double iIchimoku( string symbol, int timeframe, int tenkan_sen, int kijun_sen,
                  int senkou_span_b, int mode, int shift)
Parameters:
- symbol – defines, which financial security (currency pair) should be used for the calculation of a technical indicator values. Use NULL (or 0), if you need the current (active) security (chart).
- timeframe – defines, on which timeframe (period) the indicator should be used. Use 0 for the current period or one of constants (PERIOD_M1, PERIOD_M5, PERIOD_M15, PERIOD_M30, PERIOD_H1, PERIOD_H4, PERIOD_D1, PERIOD_W1, PERIOD_MN1).
- tenkan_sen - period of averaging Tenkan Sen.
- kijun_sen - period of averaging Kijun Sen.
- senkou_span_b - period of averaging Senkou Span B.
- mode - defines, the value of what you want to find. For choosing use one of the constants:
- MODE_TENKANSEN - Tenkan-sen
- MODE_KIJUNSEN - Kijun-sen
- MODE_SENKOUSPANA - Senkou Span A
- MODE_SENKOUSPANB - Senkou Span B
- MODE_CHINKOUSPAN - Chinkou Span
- MODE_TENKANSEN - Tenkan-sen
- shift – defines, to what bar the indicator should be used.
Using the parameter mode define, what should be returned:
Examples of usage:
double i;

i=iIchimoku(0,0,13,21,53,MODE_KIJUNSEN,0);
// the value of the line Kijun-sen on the last bar on the current security and period.
// Periods for finding mean values for Tenkan Sen, Kijun Sen and Senkou Span B
// accordingly: 13,21 and 53.

i=iIchimoku("EURUSD",PERIOD_M5,21,53,96,MODE_TENKANSEN,1);
// the value of the line Tenkan-sen on the last but one bar on 5-minute chart EURUSD.
// Periods for finding mean values for Tenkan Sen, Kijun Sen and Senkou Span B
// accordingly: 21,53 and 96.

i=iIchimoku("USDCAD",PERIOD_D1,3,5,9,MODE_CHINKOUSPAN,0);
// the value of the line Chinkou Span on the last bar on a daily chart USDCAD.
// Periods for finding mean values for Tenkan Sen, Kijun Sen and Senkou Span B
// accordingly: 3,5 and 9.
Market Facilitation Index (BW MFI)
The indicator Market Facilitation Index (BW MFI) is used for measuring a price for one tick.
https://www.metatrader5.com/en/terminal/help/indicators/bw_indicators/market_facilitation
Function prototype:
double iBWMFI( string symbol, int timeframe, int shift)
Parameters:
- symbol – defines, which financial security (currency pair) should be used for the calculation of a technical indicator values. Use NULL (or 0), if you need the current (active) security (chart).
- timeframe – defines, on which timeframe (period) the indicator should be used. Use 0 for the current period or one of constants (PERIOD_M1, PERIOD_M5, PERIOD_M15, PERIOD_M30, PERIOD_H1, PERIOD_H4, PERIOD_D1, PERIOD_W1, PERIOD_MN1).
- shift – defines, to what bar the indicator should be used.
Examples of usage:
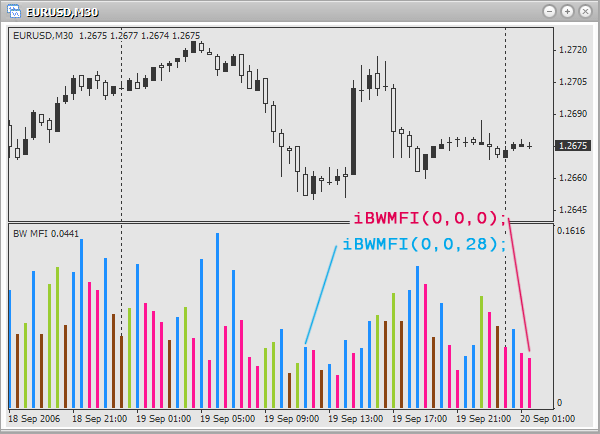
double mfi;

mfi=iBWMFI(0,0,0);
// index of market facilitation of the last bar on the active chart and period.

mfi=iBWMFI("EURUSD",PERIOD_H1,1);
// index of market facilitation of the last but one bar on an hour chart EURUSD.

mfi=iBWMFI("EURGBP",PERIOD_D1,0);
// index of market facilitation of the last bar on a daily chart EURGBP.
Momentum
The indicator Momentum is used for measuring the amount of a price change over a period of time.
https://www.metatrader5.com/en/terminal/help/indicators/oscillators/momentum
Function prototype:
double iMomentum( string symbol, int timeframe, int period, int applied_price, int shift)
Parameters:
- symbol – defines, which financial security (currency pair) should be used for the calculation of a technical indicator values. Use NULL (or 0), if you need the current (active) security (chart).
- timeframe – defines, on which timeframe (period) the indicator should be used. Use 0 for the current period or one of constants (PERIOD_M1, PERIOD_M5, PERIOD_M15, PERIOD_M30, PERIOD_H1, PERIOD_H4, PERIOD_D1, PERIOD_W1, PERIOD_MN1).
- period - the number of bars, used to find the mean value.
- applied_price – define the price to be used (what will be averaged). There are the following predefined constants for choosing the used price:
- PRICE_CLOSE - open price
- PRICE_OPEN - close price
- PRICE_HIGH - maximal price
- PRICE_LOW - minimal price
- PRICE_MEDIAN - average price, (high+low)/2
- PRICE_TYPICAL - typical price, (high+low+close)/3
- PRICE_WEIGHTED - weighted close price, (high+low+close+close)/4
- shift – defines, to what bar the indicator should be used.
Examples of usage:
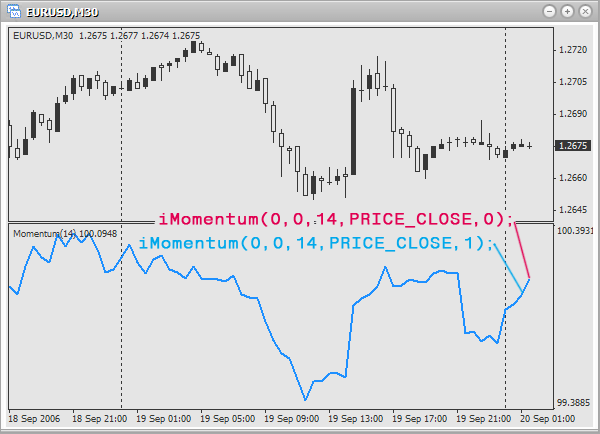
double m;

m=iMomentum(0,0,12,PRICE_CLOSE,1);
// momentum of the last but one bar on the active chart and period. Use
// 12 bars and close price for finding a mean value.

m=iMomentum("EURUSD",PERIOD_D1,21,PRICE_OPEN,0);
// momentum of the last bar on a daily chart EURUSD. Use
// 21 bars and open price for finding a mean value.

m=iMomentum("USDCAD",PERIOD_H1,7,PRICE_MEDIAN,1);
// momentum of the last but one bar on an hour chart USDCAD. Use
// 7 bars and average price for finding a mean value.
Money Flow Index (MFI)
The indicator Money Flow Index (MFI) is used for measuring the intensity of investments.
https://www.metatrader5.com/en/terminal/help/indicators/volume_indicators/mfi
Function prototype:
double iMFI( string symbol, int timeframe, int period, int shift)
Parameters:
- symbol – defines, which financial security (currency pair) should be used for the calculation of a technical indicator values. Use NULL (or 0), if you need the current (active) security (chart).
- timeframe – defines, on which timeframe (period) the indicator should be used. Use 0 for the current period or one of constants (PERIOD_M1, PERIOD_M5, PERIOD_M15, PERIOD_M30, PERIOD_H1, PERIOD_H4, PERIOD_D1, PERIOD_W1, PERIOD_MN1).
- period - the number of bars, used to find the mean value.
- shift – defines, to what bar the indicator should be used.
Examples of usage:
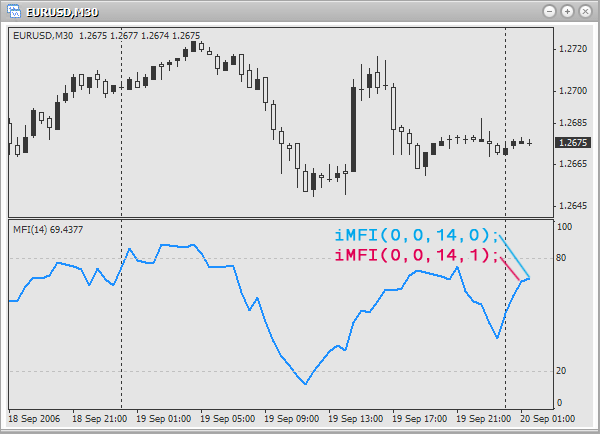
double mfi;

iMFI(0,0,14,1);
// intensity of investments of the last but one bar on the current chart and period.
// Use 14 bars to find the mean value.

iMFI("EURGBP",PERIOD_H4,32,0);
// intensity of investments of the last bar on 4-hour chart EURGBP.
// Use 32 bars to find the mean value.

iMFI("EURUSD",PERIOD_W1,9,1);
// intensity of investments of the last but one bar on a weekly chart EURUSD.
// Use 9 bars to find the mean value.
Moving Average (MA)
The indicator Moving Average (MA) shows the average price for a certain period of time.
https://www.metatrader5.com/en/terminal/help/indicators/trend_indicators/ma
Function prototype:
double iMA( string symbol, int timeframe, int period, int ma_shift,
            int ma_method, int applied_price, int shift)
Parameters:
- symbol – defines, which financial security (currency pair) should be used for the calculation of a technical indicator values. Use NULL (or 0), if you need the current (active) security (chart).
- timeframe – defines, on which timeframe (period) the indicator should be used. Use 0 for the current period or one of constants (PERIOD_M1, PERIOD_M5, PERIOD_M15, PERIOD_M30, PERIOD_H1, PERIOD_H4, PERIOD_D1, PERIOD_W1, PERIOD_MN1).
- period - the number of bars, used to find the mean value.
- ma_shift – shift of the line in bars. If the shift is positive, the line is shifted to the right. And on the contrary, if the shift is negative, the line is shifted to the left.
- ma_method – defines a method, used to find mean values.There are the following predetermined constants for choosing a method:
- MODE_SMA - simple moving average
- MODE_EMA - exponential moving average
- MODE_SMMA - smoothed moving average
- MODE_LWMA - linearly-weighted moving average
- MODE_SMA - simple moving average
- applied_price – define the price to be used (what will be averaged). There are the following predefined constants for choosing the used price:
- PRICE_CLOSE - close price
- PRICE_OPEN - open price
- PRICE_HIGH - maximal price
- PRICE_LOW - minimal price
- PRICE_MEDIAN - average price, (high+low)/2
- PRICE_TYPICAL - typical price, (high+low+close)/3
- PRICE_WEIGHTED - weighted close price, (high+low+close+close)/4
- shift – defines, to what bar the indicator should be used.
Examples of usage:
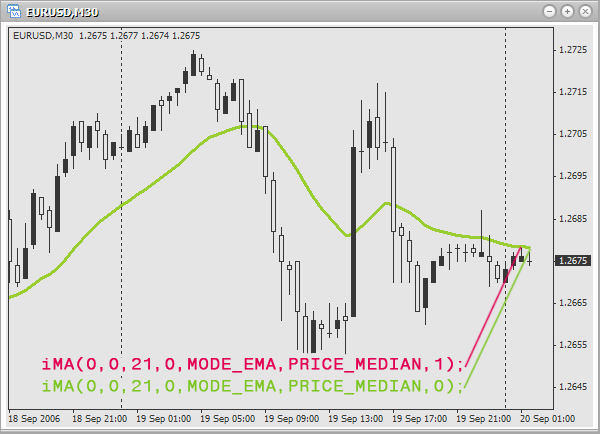
double ma;

ma=iMA(
0,0,13,0,MODE_SMA,PRICE_CLOSE,0);
// moving average of the last bar on the active chart and period.
// Use 13 bars and close price for finding simple moving average.
// Shift is not used.

ma=iMA("GOLD",PERIOD_M15,21,6,MODE_LWMA,PRICE_LOW,1);
// moving average of the last but one bar on 15-minute chart GOLD.
// Use 21 bars and minimal price for finding linearly-weighted moving average.
// Shift: 6 bars.

ma=iMA("EURCHF",PERIOD_D1,18,4,MODE_SMMA,PRICE_TYPICAL,0);
// moving average of the last bar on a daily chart EURCHF.
// Use 18 bars and typical price for finding smoothed moving average.
// Shift: 4 bars.
Average Convergence/Divergence (MACD)
The indicator Average Convergence/Divergence (MACD) is used for tracing trends based on the correlation of two moving averages.
https://www.metatrader5.com/en/terminal/help/indicators/oscillators/macd
Function prototype:
double iMACD( string symbol, int timeframe, int fast_ema_period,
              int slow_ema_period, int signal_period, int applied_price,
              int mode, int shift)
Parameters:
- symbol – defines, which financial security (currency pair) should be used for the calculation of a technical indicator values. Use NULL (or 0), if you need the current (active) security (chart).
- timeframe – defines, on which timeframe (period) the indicator should be used. Use 0 for the current period or one of constants (PERIOD_M1, PERIOD_M5, PERIOD_M15, PERIOD_M30, PERIOD_H1, PERIOD_H4, PERIOD_D1, PERIOD_W1, PERIOD_MN1).
- fast_ema_period - the number of bars, used for the calculation of a fast moving average.
- slow_ema_period - the number of bars, used for the calculation of a slow moving average.
- signal_period - the number of bars, used for the calculation of a signal line.
- applied_price – define the price to be used (what will be averaged). There are the following predefined constants for choosing the used price:
- PRICE_CLOSE - close price
- PRICE_OPEN - open price
- PRICE_HIGH - maximal price
- PRICE_LOW - minimal price
- PRICE_MEDIAN - average price, (high+low)/2
- PRICE_TYPICAL - typical price, (high+low+close)/3
- PRICE_WEIGHTED - weighted close price, (high+low+close+close)/4
- mode - defines the value of what you want to find. To choose, use one of the constants:
- MODE_MAIN - main line
- MODE_SIGNAL - signal line
- MODE_MAIN - main line
- shift – defines, to what bar the indicator should be used.
Using the parameter mode define, what should be returned:
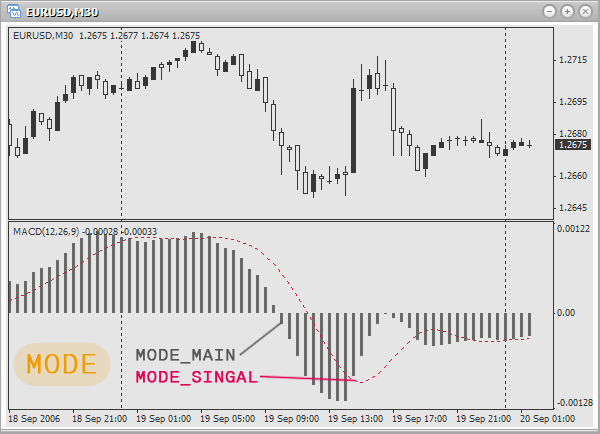
Examples of usage:
double ma;

ma=iMACD(0,0,9,21,9,PRICE_CLOSE,MODE_MAIN,0);
// value of the main line for the last bar on the active chart and period.
// Bars, used to find mean values of a fast, slow and signal
// moving average accordingly: 9,21 and 9. Use close price.

ma=iMACD("EURUSD",PERIOD_H1,21,52,18,PRICE_HIGH,MODE_SIGNAL,1);
// value of the signal line for the last but one bar on an hour chart EURUSD.
// Bars, used to find mean values of a fast, slow and signal
// moving average accordingly: 21,52 and 18. Use maximal price.

ma=iMACD("USDCAD",PERIOD_D1,7,13,7,PRICE_MEDIAN,MODE_MAIN,1);
// value of the main line for the last but one bar on a daily chart USDCAD.
// Bars, used to find mean values of a fast, slow and signal
// moving average accordingly: 7,13 and 7. Use average price.
Moving Average of Oscillator (OsMA)
The indicator Moving Average of Oscillator (OsMA) is used for measuring the difference between the main and the signal line of the indicator Average Convergence/Divergence (MACD).
https://www.metatrader5.com/en/terminal/help/indicators/oscillators/macd
Function prototype:
double iOsMA( string symbol, int timeframe, int fast_ema_period, int slow_ema_period,
              int signal_period, int applied_price, int shift)
Parameters:
- symbol – defines, which financial security (currency pair) should be used for the calculation of a technical indicator values. Use NULL (or 0), if you need the current (active) security (chart).
- timeframe – defines, on which timeframe (period) the indicator should be used. Use 0 for the current period or one of constants (PERIOD_M1, PERIOD_M5, PERIOD_M15, PERIOD_M30, PERIOD_H1, PERIOD_H4, PERIOD_D1, PERIOD_W1, PERIOD_MN1).
- fast_ema_period - the number of bars, used for the calculation of a fast moving average.
- slow_ema_period - the number of bars, used for the calculation of a slow moving average.
- signal_period - the number of bars, used for the calculation of a signal line.
- applied_price – define the price to be used (what will be averaged). There are the following predefined constants for choosing the used price:
- PRICE_CLOSE - close price
- PRICE_OPEN - open price
- PRICE_HIGH - maximal price
- PRICE_LOW - minimal price
- PRICE_MEDIAN - average price, (high+low)/2
- PRICE_TYPICAL - typical price, (high+low+close)/3
- PRICE_WEIGHTED - weighted close price, (high+low+close+close)/4
- shift – defines, to what bar the indicator should be used.
Examples of usage:
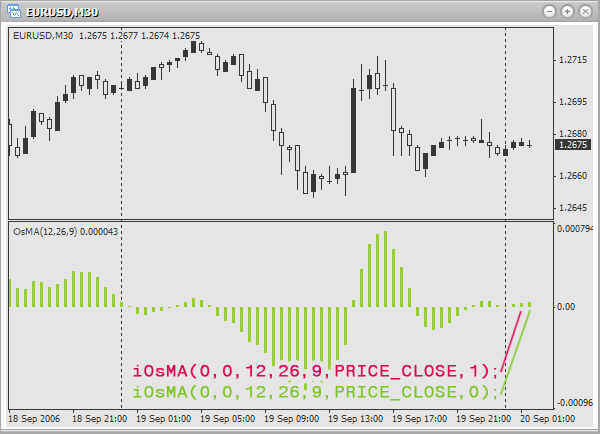
double osma;

osma=iOsMA(0,0,12,26,9,PRICE_CLOSE,0);
// difference of the last bar on the active chart and period. Bars, used
// to find mean values for the fast, slow and signal
// moving average accordingly: 12,26 and 9. Use close price.

osma=iOsMA("EURUSD",PERIOD_M1,7,13,6,PRICE_OPEN,1);
// difference of the last but one bar on a minute chart EURUSD. Bars, used
// to find mean values for the fast, slow and signal
// moving average accordingly: 7,13 and 6. Use open price.

osma=iOsMA("EURAUD",PERIOD_H1,21,48,18,PRICE_TYPICAL,0);
// difference of the last bar on an hour chart EURAUD. Bars, used
// to find mean values for the fast, slow and signal
// moving average accordingly: 21,48 and 18. Use typical price.
On Balance Volume (OBV)
The indicator On Balance Volume (OBV) relates volume to price change, accompanying this volume.
https://www.metatrader5.com/en/terminal/help/indicators/volume_indicators/obv
Function prototype:
double iOBV( string symbol, int timeframe, int applied_price, int shift)
Parameters:
- symbol – defines, which financial security (currency pair) should be used for the calculation of a technical indicator values. Use NULL (or 0), if you need the current (active) security (chart).
- timeframe – defines, on which timeframe (period) the indicator should be used. Use 0 for the current period or one of constants (PERIOD_M1, PERIOD_M5, PERIOD_M15, PERIOD_M30, PERIOD_H1, PERIOD_H4, PERIOD_D1, PERIOD_W1, PERIOD_MN1).
- applied_price – define the price to be used (what will be averaged). There are the following predefined constants for choosing the used price:
- PRICE_CLOSE - close price
- PRICE_OPEN - open price
- PRICE_HIGH - maximal price
- PRICE_LOW - minimal price
- PRICE_MEDIAN - average price, (high+low)/2
- PRICE_TYPICAL - typical prie, (high+low+close)/3
- PRICE_WEIGHTED - weighted close price, (high+low+close+close)/4
- shift – defines, to what bar the indicator should be used.
Examples of usage:
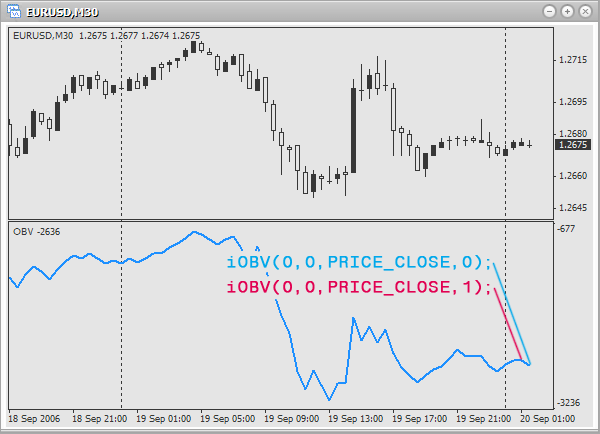
double obv;

obv=iOBV(0,0,PRICE_OPEN,0);
// Balance volume of the last bar on the current chart and period. Use open price

obv=iOBV("GBPCHF",PERIOD_M30,PRICE_CLOSE,1);
// Balance volume of the last but one bar on 30-minutes chart GBPCHF. Use close price.

obv=iOBV("GBPJPY",PERIOD_H4,PRICE_MEDIAN,0);
// Balance volume of the last bar on 4-hour chart GBPJPY. Use average price.
Parabolic Stop and Reverse system (Parabolic SAR)
The indicator Parabolic Stop and Reverse system (Parabolic SAR) is used for analyzing trend markets and defining exit points.
https://www.metatrader5.com/en/terminal/help/indicators/trend_indicators/psar
Function prototype:
double iSAR( string symbol, int timeframe, double step, double maximum, int shift)
Parameters:
- symbol – defines, which financial security (currency pair) should be used for the calculation of a technical indicator values. Use NULL (or 0), if you need the current (active) security (chart).
- timeframe – defines, on which timeframe (period) the indicator should be used. Use 0 for the current period or one of constants (PERIOD_M1, PERIOD_M5, PERIOD_M15, PERIOD_M30, PERIOD_H1, PERIOD_H4, PERIOD_D1, PERIOD_W1, PERIOD_MN1).
- step - increment of the stop level, usually 0.02.
- maximum - maximal stop level, usually 0.2.
- shift – defines, to what bar the indicator should be used.
Examples of usage:
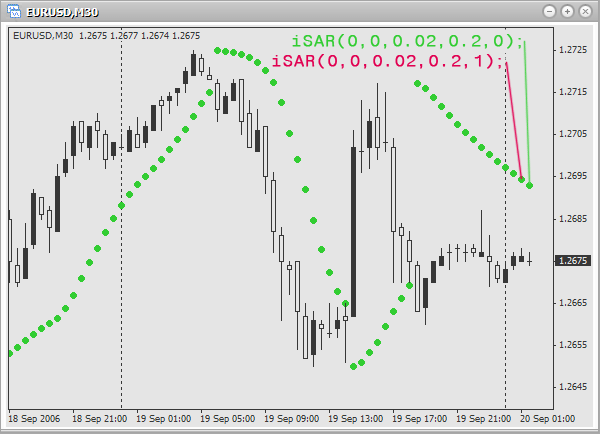
double sar;

sar=iSAR(0,0,0.02,0.2,0);
// indicator value for the last bar on the current chart and period.
// Step of stop level increment: 0.02. Maximal stop level: 0.2.

sar=iSAR("EURUSD",PERIOD_M1,0.03,0.18,1);
// indicator value for the last but one bar on a minute chart EURUSD.
// Step of stop level increment: 0.03. Maximal stop level: 0.18.

sar=iSAR("EURCHF",PERIOD_H1,0.01,0.15,0);
// indicator value for the last bar on an hour chart EURCHF.
// Step of stop level increment: 0.01. Maximal stop level: 0.15.
Relative Strength Index (RSI)
The indicator Relative Strength Index (RSI) is used for forecasting a price turn.
https://www.metatrader5.com/en/terminal/help/indicators/oscillators/rsi
Function prototype:
double iRSI( string symbol, int timeframe, int period, int applied_price, int shift)
Parameters:
- symbol – defines, which financial security (currency pair) should be used for the calculation of a technical indicator values. Use NULL (or 0), if you need the current (active) security (chart).
- timeframe – defines, on which timeframe (period) the indicator should be used. Use 0 for the current period or one of constants (PERIOD_M1, PERIOD_M5, PERIOD_M15, PERIOD_M30, PERIOD_H1, PERIOD_H4, PERIOD_D1, PERIOD_W1, PERIOD_MN1).
- period - the number of bars, used to find the mean value.
- applied_price – define the price to be used (what will be averaged). There are the following predefined constants for choosing the used price:
- PRICE_CLOSE - close price
- PRICE_OPEN - open price
- PRICE_HIGH - maximal price
- PRICE_LOW - minimal price
- PRICE_MEDIAN - average price, (high+low)/2
- PRICE_TYPICAL - typical price, (high+low+close)/3
- PRICE_WEIGHTED - weighted close price, (high+low+close+close)/4
- shift – defines, to what bar the indicator should be used.
Examples of usage:
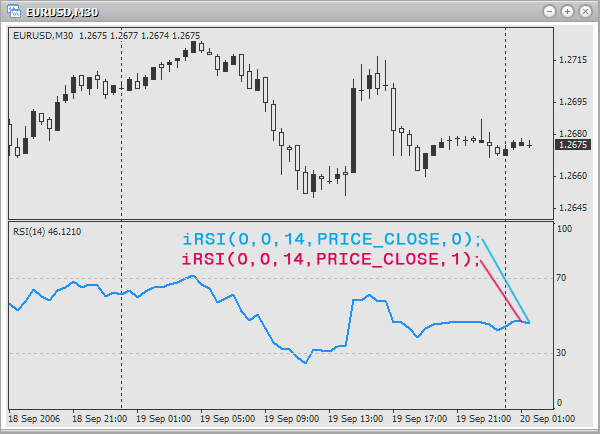
double rsi;

rsi=iRSI(0,0,14,PRICE_CLOSE,0);
// indicator value for the last bar on the active chart and period.
// Use 14 bars and close price to find the mean value.

rsi=iRSI("USDCAD",PERIOD_M1,9,PRICE_OPEN,1);
// indicator value for the last but one bar on a minute chart USDCAD.
// Use 9 bars and close price to find the mean value.

rsi=iRSI("EURAUD",PERIOD_H1,25,PRICE_TYPICAL,0);
// indicator value for the last bar on an hour chart EURAUD.
// Use 25 bars and typical price to find the mean value.
Relative Vigor Index (RVI)
The indicator Relative Vigor Index (RVI) is used to define the signals to buy and to sell. It is recommended to use this indicator with the previous one to eliminate ambiguity.
https://www.metatrader5.com/en/terminal/help/indicators/oscillators/rvi
Function prototype:
double iRVI( string symbol, int timeframe, int period, int mode, int shift)
Parameters:
- symbol – defines, which financial security (currency pair) should be used for the calculation of a technical indicator values. Use NULL (or 0), if you need the current (active) security (chart).
- timeframe – defines, on which timeframe (period) the indicator should be used. Use 0 for the current period or one of constants (PERIOD_M1, PERIOD_M5, PERIOD_M15, PERIOD_M30, PERIOD_H1, PERIOD_H4, PERIOD_D1, PERIOD_W1, PERIOD_MN1).
- period - the number of bars, used to find the mean value.
- mode - defines, the value of what you want to find. For choosing use one of the constants:
- MODE_MAIN - main line
- MODE_SIGNAL - signal line
- MODE_MAIN - main line
- shift – defines, to what bar the indicator should be used.
Using the parameter mode define, what should be returned:
Examples of usage:
double rvi;

rvi=iRVI(0,0,12,MODE_MAIN,1);
// value of the main line of the last but one bar on the active chart and period.
// Use 12 bars to find the mean value.

rvi=iRVI("EURUSD",PERIOD_D1,21,MODE_SIGNAL,0);
// value of the signal line on the last bar on a daily chart EURUSD.
// Use 21 bars to find the mean value.

rvi=iRVI("GBPJPY",PERIOD_H1,19,MODE_MAIN,1);
// value of the main line on the last but one bar on an hour chart GBPJPY.
// Use 19 bars to find the mean value.
Standard Deviation
The indicator Standard Deviation is used to measure market volatility.
https://ta.mql4.com/indicators/trends/standard_deviation
Function prototype:
double iStdDev( string symbol, int timeframe, int ma_period, int ma_shift,
                int ma_method, int applied_price, int shift)
Parameters:
- symbol – defines, which financial security (currency pair) should be used for the calculation of a technical indicator values. Use NULL (or 0), if you need the current (active) security (chart).
- timeframe – defines, on which timeframe (period) the indicator should be used. Use 0 for the current period or one of constants (PERIOD_M1, PERIOD_M5, PERIOD_M15, PERIOD_M30, PERIOD_H1, PERIOD_H4, PERIOD_D1, PERIOD_W1, PERIOD_MN1).
- ma_period - amount of bars, used to get the indicator lines.
- ma_shift – shift of the indicator lines in bars. If the shift is positive, the line is shifted to the right. And on the contrary, if the shift is negative, the line is shifted to the left.
- ma_method – defines a method, used to find mean values.There are the following predetermined constants for choosing a method:
- MODE_SMA - simple moving average
- MODE_EMA - exponential moving average
- MODE_SMMA - smoothed moving average
- MODE_LWMA - linearly-weighted moving average
- MODE_SMA - simple moving average
- applied_price – define the price to be used (what will be averaged). There are the following predefined constants for choosing the used price:
- PRICE_CLOSE - close price
- PRICE_OPEN - open price
- PRICE_HIGH - maximal price
- PRICE_LOW - minimal price
- PRICE_MEDIAN - average price, (high+low)/2
- PRICE_TYPICAL - typical price, (high+low+close)/3
- PRICE_WEIGHTED - weighted close price, (high+low+close+close)/4
- shift – defines, to what bar the indicator should be used.
Examples of usage:
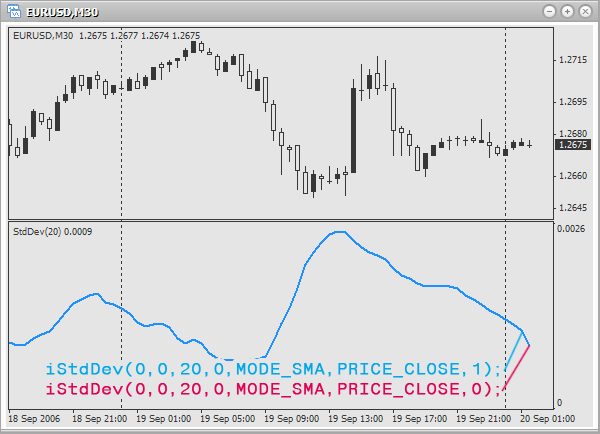
double sd;

sd=iStdDev(0,0,10,0,MODE_SMA,PRICE_CLOSE,1);
// deviation of the last but one bar on the active chart and period.
// Use 10 bars and close price to find simple
// moving average. Shift is not used.

sd=iStdDev("EURUSD",PERIOD_D1,21,3,MODE_SMMA,PRICE_MEDIAN,0);
// deviation of the last bar on a daily chart EURUSD.
// Use 21 bars and average price to find smoothed
// moving average. Shift: 3 bars.

sd=iStdDev("USDCAD",PERIOD_H4,17,2,MODE_EMA,PRICE_OPEN,1);
// deviation of the last but one bar on 4-hour chart USDCAD.
// Use 17 bars and open price to find exponential
// moving average. Shift: 2 bars.
Stochastic Oscillator
The indicator Stochastic Oscillator is used to define signals to buy and to sell.
https://www.metatrader5.com/en/terminal/help/indicators/oscillators/so
Function prototype:
double iStochastic( string symbol, int timeframe, int %Kperiod,
                    int %Dperiod, int slowing, int method,
                    int price_field, int mode, int shift)
Parameters:
- symbol – defines, which financial security (currency pair) should be used for the calculation of a technical indicator values. Use NULL (or 0), if you need the current (active) security (chart).
- timeframe – defines, on which timeframe (period) the indicator should be used. Use 0 for the current period or one of constants (PERIOD_M1, PERIOD_M5, PERIOD_M15, PERIOD_M30, PERIOD_H1, PERIOD_H4, PERIOD_D1, PERIOD_W1, PERIOD_MN1).
- %K period - amount of bars, used to generate the line %K.
- %D period - amount of bars, used to generate the line %D.
- slowing - value of slowing.
- method - defines a method, used to find mean values.There are the following predetermined constants for choosing a method:
- MODE_SMA - simple moving average
- MODE_EMA - exponential moving average
- MODE_SMMA - smoothed moving average
- MODE_LWMA - linearly-weighted moving average
- MODE_SMA - simple moving average
- price_field – defines what prices should be used for calculation. There are the following predetermined values for price choosing:
- 0 - Low/High
- 1 - Close/Close
- mode - defines the value of what you want to find. To choose, use one of the constants:
- MODE_MAIN - main line
- MODE_SIGNAL - signal line
- MODE_MAIN - main line
- shift – defines, to what bar the indicator should be used.
Using the parameter mode define, what should be returned:
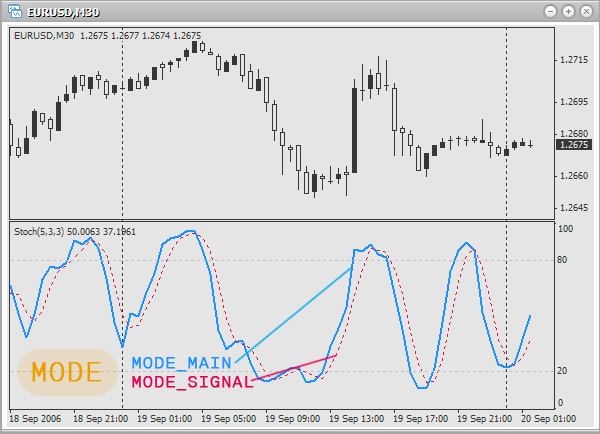
Examples of usage:
double s;

s=iStochastic(0,0,10,6,6,MODE_SMA,0,MODE_MAIN,0);
// value of the main line for the last bar on the current chart and period.
// Bars used to calculate lines %K, %D and slowing
// accordingly: 10, 6 and 6. Method of averaging: simple moving average.
// Use prices: Low/High.

s=iStochastic("EURUSD",PERIOD_M1,6,3,3,MODE_SMMA,1,MODE_SIGNAL,1);
// value of the signal line for the last but one bar on a minute chart EURUSD.
// Bars used to calculate lines %K, %D and slowing
// accordingly: 6, 3 and 3. Method of averaging: smoothed moving average.
// Use prices: Close/Close.

s=iStochastic("EURGBP",PERIOD_M5,9,7,7,MODE_EMA,0,MODE_MAIN,0);
// value of the main line for the last bar on 5-minute chart EURGBP.
// Bars used to calculate lines %K, %D and slowing
// accordingly: 9, 7 and 7. Method of averaging: exponential moving average.
// Use prices: Low/High.
Williams’ Percent Range (%R)
The indicator Williams’ Percent Range (%R) is used to determine whether the market is overbought/oversold.
https://www.metatrader5.com/en/terminal/help/indicators/oscillators/wpr
Function prototype:
double iWPR( string symbol, int timeframe, int period, int shift)
Parameters:
- symbol – defines, which financial security (currency pair) should be used for the calculation of a technical indicator values. Use NULL (or 0), if you need the current (active) security (chart).
- timeframe – defines, on which timeframe (period) the indicator should be used. Use 0 for the current period or one of constants (PERIOD_M1, PERIOD_M5, PERIOD_M15, PERIOD_M30, PERIOD_H1, PERIOD_H4, PERIOD_D1, PERIOD_W1, PERIOD_MN1).
- period - the number of bars, used to find the mean value.
- shift – defines, to what bar the indicator should be used.
Examples of usage:
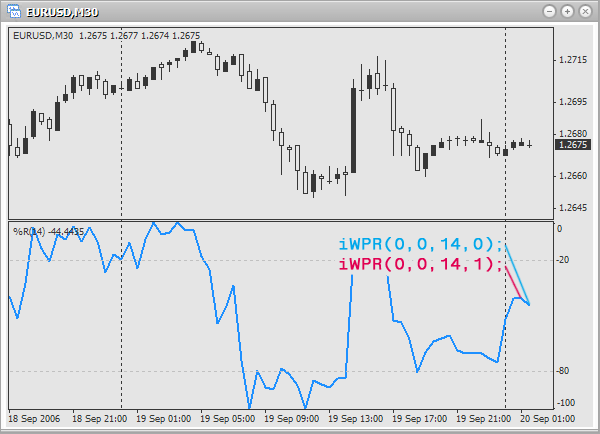
double wpr;

wpr=iWPR(0,0,14,1);
// overbought: the last but one bar on the active chart and period.
// Use 14 bars to get the mean value.

wpr=iWPR("USDCHF",PERIOD_D1,9,0);
// overbought: The last bar on a daily chart USDCHF.
// Use 9 bars to get the mean value.

wpr=iWPR("GBPJPY",PERIOD_H1,23,1);
// overbought: the last but one bar on an hour chart GBPJPY.
// Use 23 bars to get the mean value.
The Correct Usage of Technical Indicators Functions
For the correct usage of these functions you must know exactly, how an indicator is arranged and how to use it (trading signals). Of course they should be used in your own Expert Advisors or indicators. Still, as a home task try to write a script, which will inform about the entering points, based on the signals of any indicator (choose yourself).
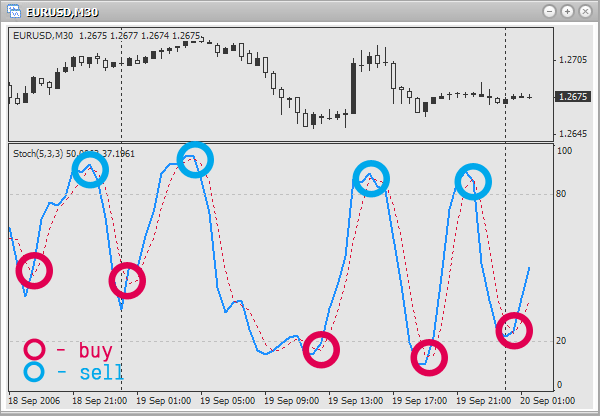
As an example let us write one of such home tasks, which will show entering points based on the trading signals of Stochastic Oscillator. We will use the following rules for entering the market:
Buy if the main line rises higher than the signal line. Sell if the main line falls lower than the signal line.
At the picture entering points are encircled:
First let us declare several variables, in which we will store the values of the signal and the main line on the current and previous bar:
double mainLine;
double prevMainLine;
double signalLine;
double prevSignalLine;
Now let us find the values for these variables:
mainLine=iStochastic(0,0,5,3,3,MODE_SMA,0,MODE_MAIN,0);
prevMainLine=iStochastic(0,0,5,3,3,MODE_SMA,0,MODE_MAIN,1);
signalLine=iStochastic(0,0,5,3,3,MODE_SMA,0,MODE_SIGNAL,0);
prevSignalLine=iStochastic(0,0,5,3,3,MODE_SMA,0,MODE_SIGNAL,1);
You see, we restricted ourselves to the last and last but one bars. Now let us check, if there are signals to buy and sell:
if(prevMainLine<prevSignalLine && mainLine>signalLine)
   Alert("Signal to buy");
// if the main line was under the signal one and rised over it,
// this is a signal to buy

if(prevMainLine>prevSignalLine && mainLine<signalLine)
   Alert("Signal to sell");
// if the main line was over the signal one and fell bellow it,
// this is a signal to sell
We used operators of comparison and logical &&. Try to understand it properly.
Now let us put it into a cycle to check a hundred of last bars:
for(int a=0;a<100;a++)
{
   mainLine=iStochastic(0,0,5,3,3,MODE_SMA,0,MODE_MAIN,a);
   prevMainLine=iStochastic(0,0,5,3,3,MODE_SMA,0,MODE_MAIN,a+1);
   signalLine=iStochastic(0,0,5,3,3,MODE_SMA,0,MODE_SIGNAL,a);
   prevSignalLine=iStochastic(0,0,5,3,3,MODE_SMA,0,MODE_SIGNAL,a+1);

   if(prevMainLine<prevSignalLine && mainLine>signalLine)
      Alert("Signal to buy");

   if(prevMainLine>prevSignalLine && mainLine<signalLine)
      Alert("Signal to sell");
}
See it? We have simply added a counter from a cycle and can check the bars. And now for convenience instead of a hundred let us declare a constant BARS_TO_ANALYSE, which will define, how many last bars will be analyzed. Here is the final version of the script:
//+------------------------------------------------------------------+
//|                                        showStochasticSignals.mq4 |
//|                                    Antonuk Oleg Copyright © 2007 |
//|                                                   banderass@i.ua |
//+------------------------------------------------------------------+
#property copyright "Antonuk Oleg Copyright © 2007"
#property link      "banderass@i.ua"

#define BARS_TO_ANALYSE 100

//+------------------------------------------------------------------+
//| script program start function                                    |
//+------------------------------------------------------------------+
int start()
{
   double mainLine;
   double prevMainLine;
   double signalLine;
   double prevSignalLine;

   for(int a=0;a<BARS_TO_ANALYSE;a++)
   {
      mainLine=iStochastic(0,0,5,3,3,MODE_SMA,0,MODE_MAIN,a);
      prevMainLine=iStochastic(0,0,5,3,3,MODE_SMA,0,MODE_MAIN,a+1);
      signalLine=iStochastic(0,0,5,3,3,MODE_SMA,0,MODE_SIGNAL,a);
      prevSignalLine=iStochastic(0,0,5,3,3,MODE_SMA,0,MODE_SIGNAL,a+1);

      if(prevMainLine<prevSignalLine && mainLine>signalLine)
         Alert("Signal to buy. Time: ",TimeToStr(Time[a]));

      if(prevMainLine>prevSignalLine && mainLine<signalLine)
         Alert("Signal to sell. Time: ",TimeToStr(Time[a]));
   }
   return(0);
}
In this script the following small code fragment must seem strange for you (if it does, you must be a successful student):
TimeToStr(Time[a])
This function accepts the amount of seconds that passed from the 1st of January 1970 and returns a string with this date. The predetermined array Time[] returns the same number of seconds as applied to a chosen bar. Here is an ideal pair.
As a subtask try to add a heavy moving average (with the period 200-500) and filter out unnecessary signals in such a way: if a price is above the mid line, do not sell. If a price is under the mid line, do not buy.
Well, did you manage to do this? No? Then, some more information for you.
Something New about Variables Declaration
Usually we declare variables so:
double maxPrice;
double minPrice;
double lastPrices[100];

int maxIndex;
int minIndex;
int levels[10];
Do not do so any more. Do it this way:
double maxPrice,
       minPrice,
       lastPrices[100];

int maxIndex,
    minIndex,
    levels[10];
I.e. first indicate the type, and then comma separated the names of variables (arrays). There is no difference, though we avoid unnecessary actions. The same is with initialization:
int value1=10,
    value2=12,
    matrix[2][2]={1,2,
                  3,4};
Functions that Return Several Values
Are there such functions?? Of course, you can write it yourself. Let us see what you can.
The simplest function returning one value:
int func()
{
   return(100);
}
And what if we need several values of different types to be returned simultaneously? Look here:
void SuperFunc(int& valueForReturn1,double& valueForReturn2,string& valueForReturn3)
{
   valueForReturn1=100;
   valueForReturn2=300.0;
   valueForReturn3="it works!!";
}
Now let us try to call this "amazing" function:
int value1=0;
double value2=0.0;
string value3="";

SuperFunc(value1,value2,value3);
MessageBox("value1="+value1+" value2="+value2+" value3="+value3);
The result is the following:
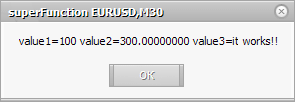
This function has one common difference from simple functions: when we declare it, after the argument we put the ampersand character (&). If you do this with an argument, you can change its value inside the function, and after calling it the result will remain. Such operation with arguments is called parameter passing by reference. Thus you can return as many variables of different types as you wish. Try to omit the ampersand characters in the above code and see the result:
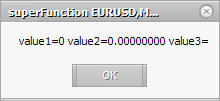
New Type of Comments
You know how to comment one line:
// it is a one string comment
But sometimes it is more useful to comment a certain code block, in order to disable it temporarily. The above method is not convenient for commenting 20-30 strings. Here we can use multi-line comments:
/*
   it is a multi-line comment.
   Very convenient, try it.
*/
Conclusion
Today you have learned a lot of new material. We have analyzed mathematic and trigonometric functions and functions for operation with technical indicators. You saw on a simple example how to trace trading signals correctly. And though it is not convenient to use them in scripts, and they were created not for that purpose, soon at following lessons you will see how to use them in your own indicators and Expert Advisors. And then you will see how useful they actually are.
Warning: All rights to these materials are reserved by MetaQuotes Ltd. Copying or reprinting of these materials in whole or in part is prohibited.
This article was written by a user of the site and reflects their personal views. MetaQuotes Ltd is not responsible for the accuracy of the information presented, nor for any consequences resulting from the use of the solutions, strategies or recommendations described.
 Construction of Fractal Lines
 Creation of an Automated Trading System
 What is Martingale and Is It Reasonable to Use It?
 How to Cut an EA Code for an Easier Life and Fewer Errors
- Free trading apps
- Over 8,000 signals for copying
- Economic news for exploring financial markets
You agree to website policy and terms of use
Very good post .
Thank you !
Hi, m new I want to invert Brooky USD Strength indicator. i.e I wish to do its up down and down up simply. But how plz tell me ?