OBV Divergence MT4
- Göstergeler
- Sürüm: 1.0
- Etkinleştirmeler: 10

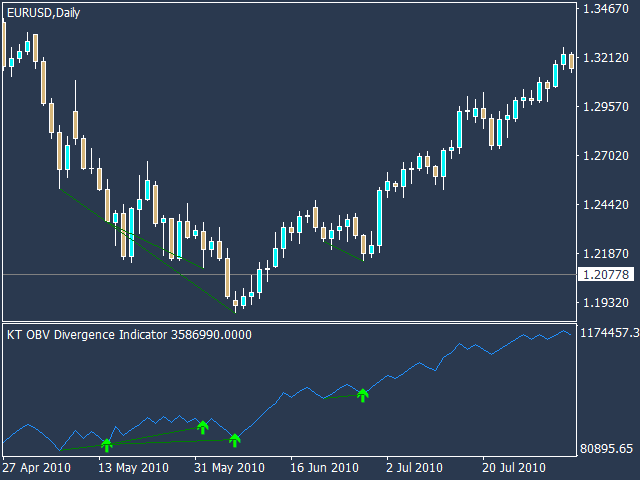
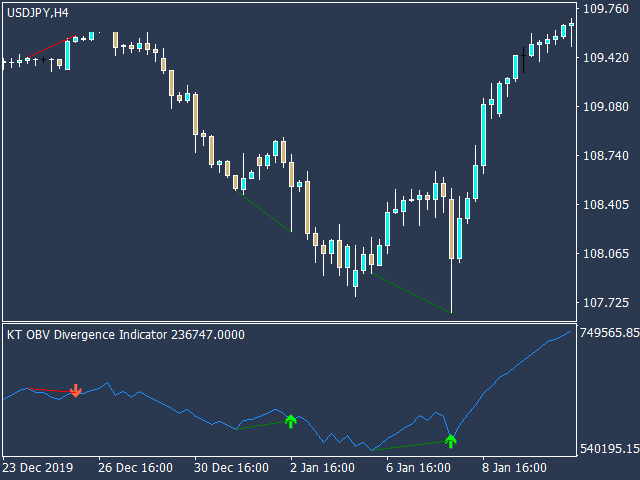
KT OBV Divergence, fiyat ile OBV (On Balance Volume) osilatörü arasında oluşan düzenli ve gizli uyumsuzlukları (divergence) gösterir.
Özellikler
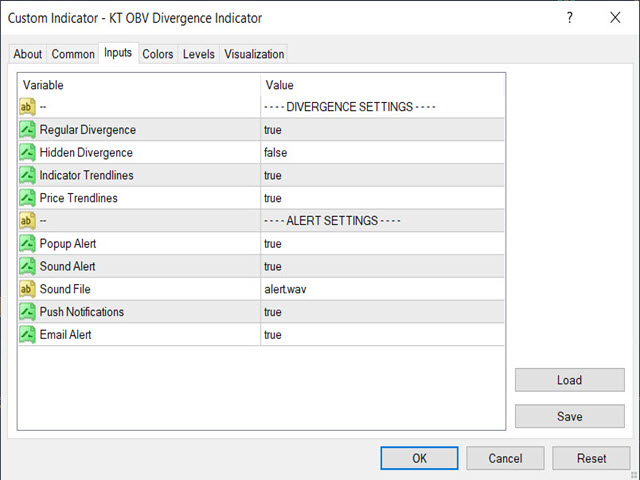
- Daha yüksek doğruluk ve daha sade grafik görünümü için simetrik olmayan uyumsuzluklar filtrelenir.
- Trend dönüşü ve trend devamı stratejilerini destekler.
- Expert Advisor’a tamamen entegre edilebilir şekilde uyumludur.
- Hem giriş hem çıkış sinyalleri için kullanılabilir.
- Tüm MetaTrader uyarı sistemleriyle uyumludur.
Divergence (uyumsuzluk) tam olarak nedir?
Teknik analiz bağlamında, eğer fiyat daha yüksek zirveler yapıyorsa, osilatörün de aynı şekilde daha yüksek zirveler yapması beklenir. Fiyat daha düşük dipler yapıyorsa, osilatörün de bunu takip etmesi gerekir. Bu normal yapı bozulduğunda, fiyat ile osilatör arasında uyumsuzluk (divergence) meydana gelir.
İki ana divergence türü vardır:
Normal Boğa Uyumsuzluğu: Fiyat daha düşük dipler yaparken osilatör daha yüksek dipler yapar.
Normal Ayı Uyumsuzluğu: Fiyat daha yüksek zirveler yaparken osilatör daha düşük zirveler yapar.
Gizli Boğa Uyumsuzluğu: Fiyat daha yüksek dipler yaparken osilatör daha düşük dipler yapar.
Gizli Ayı Uyumsuzluğu: Fiyat daha düşük zirveler yaparken osilatör daha yüksek zirveler yapar.
"Normal divergence trend dönüşlerini, gizli divergence ise trend devamını belirlemek için kullanılır."