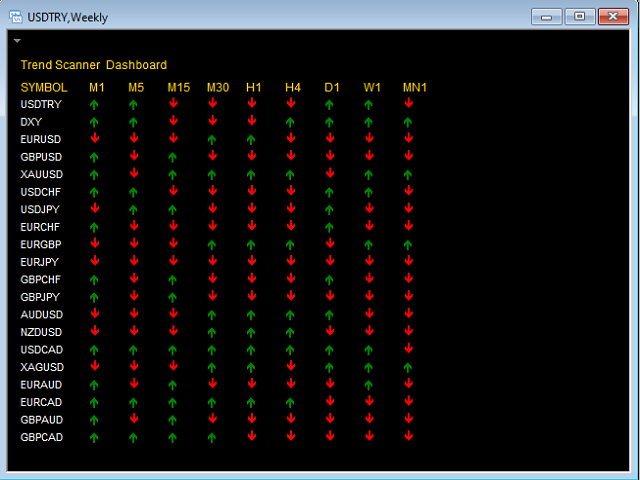
MACD Dashboard Scanner MT4
- Göstergeler
- Sürüm: 1.0
- Etkinleştirmeler: 15

The indicator monitors the Dinapoli MACD trend in multiple timeframes for the all markets filtered and shows the results on Dashboard.
Key Features
- Indicator can be used for all markets
- Monitors every timeframe, from 1 Min to Monthly
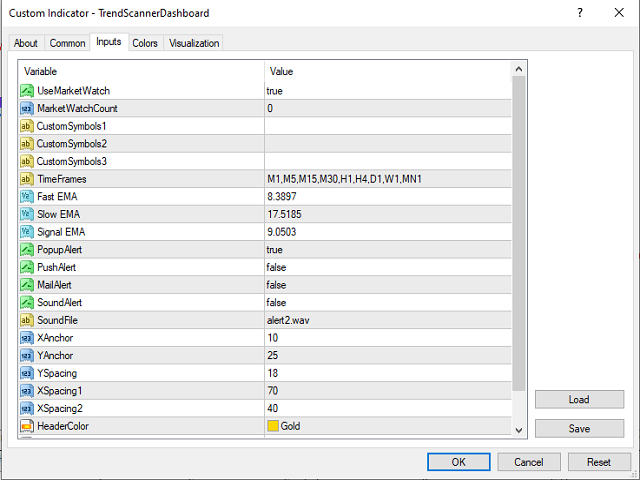
Parameters
- UseMarketWatch: Set true to copy all symbols available in market watch
- MarketWatchCount : Set the number of symbols that you want to copy from the market watch list.
- CustomSymbols: Enter the custom symbols that you want to be available in dashboard.
- Timeframes: Set the timeframes for dashboard.
- FastEMA: Fast EMA (Default Dinapoli)
- SlowEMA: Slow EMA (Default Dinapoli)
- SignalEMA: Signal EMA (Default Dinapoli)
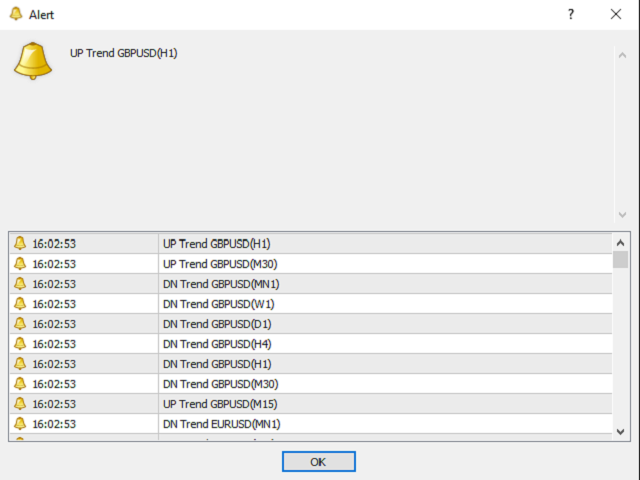
- Popup Alert: Set True to enable window popup and sound alert on the terminal when a fresh signal is generated. Set False to disable
- Email Alert: Set True to receive email notifications when a fresh signal is generated. Set False to disable.
- Push Alert: Set True to receive push notifications on your Apple or Android devices when a fresh signal is generated. Set False to disable
For MT5 Version; please visit ► https://www.mql5.com/en/market/product/52813
For My Other Products; please visit ► https://www.mql5.com/en/users/samil34
Kullanıcı değerlendirmeye herhangi bir yorum bırakmadı