OHLC External Candle

Open High Low Close Внешняя Свеча

Индикатор внешних свечей наложенных на график с выбранными вами тайм фреймом.
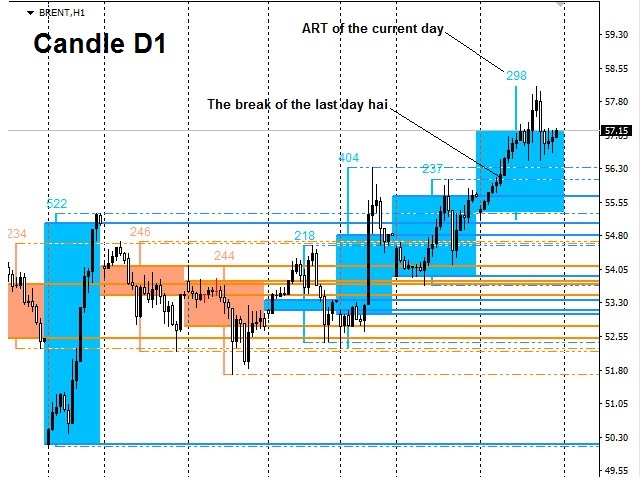
Наглядно отображаете уровни OHLC и пройденное значение ATR текущей свечи и свечей в истории.

OHLC — аббревиатура, дословно расшифровывается как:
O — open (цена открытия интервала (бара или японской свечи)).
H — high (максимум цены интервала).
L — low (минимум цены интервала).
C — close (цена закрытия интервала).

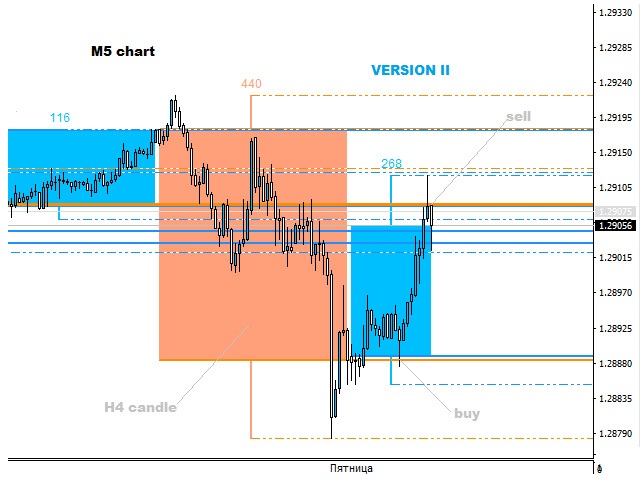
Данный индикатор наглядно покажет трейдеру, уровень открытия, закрытия, а также уровни
минимумов и максимумов предыдущих внешних свечей (старших периодов) наложенных прямо на текущий график. 

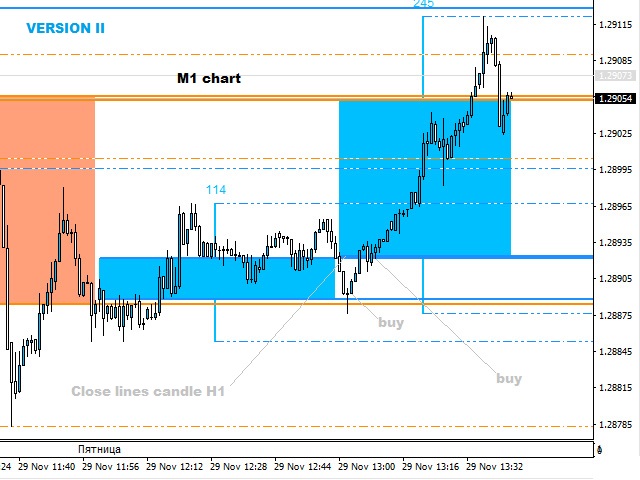
Преимущество работы с данным индикатором в том, что Трейдер добавив индикатор на график валютной пары
с включенным младшим тайм фреймом всегда будет в курсе где начался и закрылся прошлый час, тридцать минут,
пятнадцать, пять минут, день, неделя, месяц. И на какой цене были зафиксированы экстремумы данных периодов.


О понятии времени и таймфрейм

Всем известно что Тайм фрейм - это промежуток времени, рассматриваемый в техническом анализе свободных финансовых рынков,
в течение которого происходит изменение цен и иных рыночных данных, в период построения ценовых графиков.

В MetaTrader 4 торговом терминале есть стандартная возможность переключения периодов графика переключить который
можно простым нажатием кнопок: М1, М5, М15, М30, Н1, Н4,
D1, W1, MN (тайм фрейм периодом месяц).

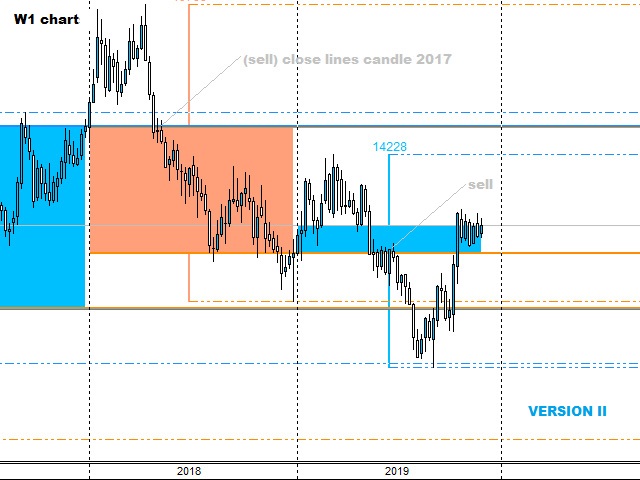
Данный индикатор рисует свечи старше текущего выбранного периода графика и рисует их прямо поверх самого графика.
А также рисует уровни
OHLC отображаемых индикатором свечей (баров) и значения ATR свечи(бара) формирующейся и уже сформированных.

На всех отображаемых уровнях в настройках индикатора можно включить ценовые метки. Чтобы знать точную цену уровней и работать с ней.


Параметры индикатора

Periods of external indicator candles - Период внешней свечи индикатора, по умолчанию: Н1.
The number of outer candles on the chart - Количество отображаемых индикатором свечей в истории графика, по умолчанию: 100.
The color of bullish candles - Цвет восходящей, "бычьей" свечи,
по умолчанию: DeepSkyBlue.
Color of bearish candles
-
Цвет нисходящей, "медвежьей" свечи, по умолчанию: LightSalmon.

Fill or not fill the color of the candle body
-
Заполнять или не заполнять цветом тело свечи, по умолчанию: true.
The thickness of the contour lines of the outer candles -
Толщина контурных линий внешних свечей, по умолчанию: 2.

As far as bars or candles ago to draw the line OHLC -
Насколько баров или свечей назад,  нарисовать линии OHLC, по умолчанию: 4.

On / off Open Close lines
- Отображать или не отображать уровни открытия и закрытия свечей, по умолчанию: true.

 
Color of the Open and Close lines at the ascending candle - Цвет линий открытия и закрытия на восходящей свече, оп умолчанию: DodgerBlue .
Color of the Open and Close lines at the descending candle
- Цвет линий открытия и закрытия на нисходящей свече, оп умолчанию: DarkOrange.

Width Open Close lines
- Толщина линий открытия закрытия свечи или бара, по умолчанию: 2.
Style lines Open Close at a width of 1 - Стиль линий открытия и закрытия свечи, при толщине 1, по умолчанию: Solid.

Lengths line Open Close High Low - Длина линии Open Close High Low, по умолчанию: ray (луч).
Alignment lines for the candle to close - Выравнивание линий цены закрытия свечи, по умолчанию: LeftPart.

How many periods forward to draw the cut length - Насколько периодов вперёд рисовать линию если выбрана длинна Cut (отрезок), по умолчанию: 3.

On / Off price labels of all lines - Вкл / выкл ценовые метки всех линий.
On / Off value of ATR of external candles - Вкл / выкл значение ATR  внешних свечей.

On / Off High and Low lines - Вкл / выкл линии high и low.
Цвет линий, стиль при толщине 1, и толщину линий High и Low, также можно менять по своему усмотрению.


Примечание: Период свечей индикатора должен быть больше выбранного периода графика терминала.
Индикатор пригодится трейдерам для торговли внутри дня. На тайм фреймах: от М1 и выше.

Если на младшем тайм фрейме внешняя свеча не отобразилась, обнови график или загрузи котировки
младших тайм фреймов с сервера брокера.


Önerilen ürünler
Power Renko is an indicator which plots Renko bricks underneath the chart using a histogram. You can select the brick size and the timeframe of the Renko bricks as well as whether or not to use the close price or the high/low price of the candles. Renko bricks are based on price alone, not time, therefor the Renko bricks will not be aligned with the chart's time. They are extremely useful for trend trading and many different strategies can be formed from them. Buffers are provided allowing you t
Delta Fusion Pro
Francesco Secchi
5 (2)
Delta Fusion Pro – Gün İçi İşlem için Gelişmiş Emir Akışı Analizi Delta Fusion Pro, MetaTrader 4 için profesyonel bir göstergedir. Agresif emir akışını ortaya çıkarır ve kurumsal baskının yoğunluğunu ve yönünü gerçek zamanlı olarak gösterir. Geleneksel hacim göstergelerinden farklı olarak, Ask ve Bid hacimleri arasındaki delta farkını analiz eder; dönüşleri önceden tahmin eder, trendleri doğrular ve profesyonel ilgi alanlarını belirler. Ana Özellikler Akıllı Otomatik Ayar Sistemi Tüm parametr
Chinetti pip collector XL is a complete turnkey trading system. If a trader does not yet have his own trading system, he can apply Chinetti pip collector XL to trading. Trading with this indicator is very easy. Even a beginner in Forex can handle it. Trading rules: wait for the indicator to start drawing a blue line. This means that the price trend is starting now. Now we are waiting for the indicator to analyze the market and draw an up arrow on the chart. At this point, we open a buy order.
"Auto FIBO Pro" Crypto_Forex göstergesi - ticarette harika bir yardımcı araçtır! - Gösterge, Fibo seviyelerini ve yerel trend çizgilerini (kırmızı renk) otomatik olarak hesaplar ve grafikte yerleştirir. - Fibonacci seviyeleri, fiyatın tersine dönebileceği önemli alanları gösterir. - En önemli seviyeler %23,6, %38,2, %50 ve %61,8'dir. - Ters scalping veya bölge ızgara ticareti için kullanabilirsiniz. - Auto FIBO Pro göstergesini kullanarak mevcut sisteminizi geliştirmek için birçok fırsat vardı
FX Flow
Eva Stella Conti
FX Flow   indicator can be used as an anticipator of the next trend, preferably confirmed by Price Action or another oscillator (RSi, Stochastic ..). It takes the money flows of the major currencies USD EUR GBP AUD NZD CAD CHF JPY into account, and processes them. Excellent tool for indices, but also for correlations between currencies. Works on each timeframes.  Blue line: Bull market Yellow line: Bear market Note : if the indicator opens the window, but does not draw lines, load the historie
Before
Nadiya Mirosh
The Before indicator predicts the most likely short-term price movement based on complex mathematical calculations. Most of the standard indicators commonly used in trading strategies are based on fairly simple calculations. This does not mean that there were no outstanding mathematicians in the world at the time of their creation. It is just that computers did not yet exist in those days, or their power was not enough for the sequential implementation of complex mathematical operations. Nowad
Crypto_Forex Göstergesi HTF Ichimoku MT4 için. - Ichimoku göstergesi en güçlü trend göstergelerinden biridir. HTF - Daha Yüksek Zaman Çerçevesi anlamına gelir. - Bu gösterge Trend Yatırımcıları için mükemmeldir ve Fiyat Hareketi girişleriyle birleştirilebilir. - HTF Ichimoku Göstergesi, daha yüksek zaman çerçevesinden Ichimoku'yu mevcut grafiğinize eklemenizi sağlar. - Yukarı trend - mavi olanın üzerindeki kırmızı çizgi (ve her iki çizgi de bulutun üzerindedir) / Aşağı trend - mavi olanın altı
Price Magnet — Price Density and Attraction Levels Indicator Price Magnet is a professional analytical tool designed to identify key support and resistance levels based on statistical Price Density. The indicator analyzes a specified historical period and detects price levels where the market spent the most time. These zones act as “magnets,” attracting price action or forming a structural base for potential reversals. Unlike traditional Volume Profile tools, Price Magnet focuses on price-time d
PW Oscillator
Svyatoslav Kucher
5 (1)
PW Oscillator   - индикатор предназначенный для поиска локальных экстремумов, определения текущей тенденции. В расчетах индикатора используется авторская методика. С помощью индикатора можно определять места возможного разворота цены желательно в направлении тенденции, но также с достаточной точностью и против нее. Также с помощью индикатора можно определять текущую тенденцию. Индикатор подходит для любых валютных пар, но для адекватного отображения показания необходимо, чтобы было достаточно ис
Introduction It is common practice for professional trades to hide their stop loss / take profit from their brokers. Either from keeping their strategy to the themselves or from the fear that their broker works against them. Using this indicator, the stop loss / take profit points will be drawn on the product chart using the bid price. So, you can see exactly when the price is hit and close it manually.  Usage Once attached to the chart, the indicator scans the open orders to attach lines for t
Vizzion
Joel Protusada
Vizzion is a fully automated scalping Expert Advisor that can be run successfully using GBPJPY currency pair at H1 timeframe. Very Important This Expert Advisor can not run with any EAs in the same account. As part of the money management plan, it calculates and monitors the Margin Level % and assumes that all open trades are created by it. If you want an Expert Advisor that trades in a daily basis, this EA is not for you because using this requires a patience to wait for a few days or weeks on
"Ayarlanabilir Fraktallar" - fraktal göstergesinin gelişmiş bir versiyonudur, çok kullanışlı bir ticaret aracıdır! - Bildiğimiz gibi Standart fraktallar mt4 göstergesinin hiç ayarı yoktur - bu, yatırımcılar için çok elverişsizdir. - Ayarlanabilir Fraktallar bu sorunu çözmüştür - gerekli tüm ayarlara sahiptir: - Göstergenin ayarlanabilir periyodu (önerilen değerler - 7'nin üzerinde). - Fiyatın Yüksek/Düşük noktalarına ayarlanabilir mesafe. - Fraktal oklarının ayarlanabilir tasarımı. - Gösterged
StarSwing
Gabriele Tedeschi
StarSwing è un indicatore NO REPAINT che unisce in un unico strumento oscillatori e indicatori di forza.  I parametri esterni permettono di bilanciare il peso delle componenti e di regolare a proprio piacimento l'indicatore stesso. StarSwing, graficamente, è composto da segmenti di 2 colori: uno rappresentante il rialzo e uno il ribasso. Il colore non dipende dalla pura direzione del segmento ma dal trend di fondo calcolato dall'indicatore stesso. Sul grafico, si può far disegnare una media mobi
Min Max spread study
Dimitri Nepomniachtchi
Do you know the spreads on which your trades are / will be opened. How well do you know about the spreads on which your trades are / will be opened. The main task of the indicator. Help the user / trader to study the spreads in the trading terminal. Get information about the minimum and maximum spread on each candle, from M1 and above. This information will help in the following cases: - Maximum trading spread EA    --- If your broker has smaller spreads or average statistically higher and th
The indicator detects and displays М. Gartley's Butterfly pattern. The pattern is plotted by the extreme values of the ZigZag indicator (included in the resources, no need to install). After detecting the pattern, the indicator notifies of that by the pop-up window, a mobile notification and an email. The pattern and wave parameters are displayed on the screenshots. The default parameters are used for demonstration purposes only in order to increase the amount of detected patterns. Parameters z
PZ Harmonacci Patterns
PZ TRADING SLU
3.17 (6)
Trade smarter, not harder: Empower your trading with Harmonacci Patterns This is arguably the most complete harmonic price formation auto-recognition indicator you can find for the MetaTrader Platform. It detects 19 different patterns, takes fibonacci projections as seriously as you do, displays the Potential Reversal Zone (PRZ) and finds suitable stop-loss and take-profit levels. [ Installation Guide | Update Guide | Troubleshooting | FAQ | All Products ] It detects 19 different harmonic pric
Happy Scalping Indicator
Leandro Bernardez Camero
Bu gösterge, agresif scalping ve ikili opsiyonlarda hızlı girişler yapmak için tasarlanmıştır , her mumda sinyaller üreterek her an neler olduğunu tam olarak bilmenizi sağlar. Happy Scalping kanalına katılın: MQL5 Yeniden çizim yapmaz : Mevcut mumun sinyali gerçek ZAMAN da üretilir, bu da mum hala şekillenirken, fiyatın bir önceki mumun kapanışına göre yukarı ya da aşağı gitmesine bağlı olarak değişebileceği anlamına gelir. Ancak bir kez mum kapanınca , sinyalin rengi tamamen sabit kalır . Değ
StarTrend
Gabriele Tedeschi
StarTrend è un indicatore a freccia che identifica, con alta probabilità, l'inizio di un nuovo trend.  La sua versatilità, però, permette di utilizzarlo anche in strategia in cui cerchiamo operazioni a favore di trend. StarTrend può essere la base del proprio sistema di trading oppure può integrare, per dare conferme o suggerimenti di astensione, il tuo sistema già collaudato. StarTrend invia segnali di preallarme quando c'è un probabile rallentamento della forza del trend e poi disegna una stel
Trend PA
Mikhail Nazarenko
5 (3)
The Trend PA indicator uses   Price Action   and its own filtering algorithm to determine the trend. This approach helps to accurately determine entry points and the current trend on any timeframe. The indicator uses its own algorithm for analyzing price changes and Price Action. Which gives you the advantage of recognizing, without delay, a new nascent trend with fewer false positives. Trend filtering conditions can be selected in the settings individually for your trading style. The indicator
DayTradingArrow v1
Nedyalka Zhelyazkova
5 (3)
Step into Confident Trading with DayTradingArrow v1 In trading, confidence comes from clarity, structure, and reliable signals . DayTradingArrow v1 is designed to give you exactly that – a tool that highlights opportunities, filters out noise, and supports smart, disciplined decisions. Every signal is confirmed and actionable , allowing you to trade with confidence rather than guesswork. Key Benefits Clear buy and sell signals for fast, confident decision-making Perfect for beginners and exper
Trend Osilatörü - gelişmiş bir özel Crypto_Forex göstergesi, etkili bir ticaret aracıdır! - Gelişmiş yeni hesaplama yöntemi kullanılır - "Hesaplama için fiyat" parametresi için 20 seçenek. - Şimdiye kadar geliştirilen en akıcı osilatör. - Yükselen trendler için yeşil renk, düşen trendler için kırmızı renk. - Aşırı satım değerleri: 5'in altında, Aşırı alım değerleri: 95'in üzerinde. - Bu göstergeyle standart stratejileri bile yükseltmek için birçok fırsat vardır. - PC ve Mobil uyarılarla. Yüks
Alpha Trend sign has been a very popular trading tool in our company for a long time. It can verify our trading system and clearly indicate trading signals, and the signals will not drift. Main functions: Based on the market display of active areas, indicators can be used to intuitively determine whether the current market trend belongs to a trend market or a volatile market. And enter the market according to the indicator arrows, with green arrows indicating buy and red arrows indicating se
Meraz Trend V4 – High Accuracy 1-Minute Binary Options Signal Indicator Meraz Trend V4 is specially designed for binary options traders who trade on the 1-minute timeframe. It Best Work On Any OTC Pair Any Broker The indicator provides clear Buy and Sell arrow signals directly on the chart. When an arrow appears on a candle, you must enter the trade at the opening of the next candle. Expiry time is strictly 1 minute (1 candle). Entry Rules: If a Buy Arrow appears → Open a BUY (CALL)
The objective of the Crypto-Box Indicator is to determine the most efficient entry in trends. . It works for all purposes, standing out in the main cryptocurrencies: BitCoin, LiteCoin, Ethereum and Emercoin. And in Currencies: EURUSD, USDJPY и GBPUSD. The indicator is designed to find the best conditions for financial instruments. Detects acceleration patterns in prices in areas of supports and resistances. The development team is constantly improving the functionality of the Indicator and we th
The indicator detects and displays 3 Drives harmonic pattern (see the screenshot). The pattern is plotted by the extreme values of the ZigZag indicator (included in the resources, no need to install). After detecting the pattern, the indicator notifies of that by a pop-up window, a mobile notification and an email. The indicator highlights the process of the pattern formation and not just the complete pattern. In the former case, it is displayed in the contour triangles. After the pattern is com
The   Trendlines Oscillator   helps traders identify trends and momentum based on the normalized distances between the current price and the most recently detected bullish and bearish trend lines. The indicator features bullish and bearish momentum, a signal line with crossings, and multiple smoothing options. USAGE The   Trendlines Oscillator   works by systematically: Identifying pivot highs and lows. Connecting pivots to form bullish (support) and bearish (resistance) trendlines. Measuring
SMT (Smart Money Technique) Divergence refers to the price divergence between correlated assets or their relationship to inversely correlated assets.  By analyzing SMT Divergence, traders can gain insights into the market's institutional structure and identify whether smart money is accumulating or distributing assets.  Every price fluctuation should be confirmed by market symmetry, and any price asymmetry indicates an SMT Divergence, suggesting a potential trend reversal. MT5 Version -  https:/
Binary Options Support Resistance Indicator This indicator is designed for binary options trading and effectively shows retracements from support and resistance levels. Signals appear on the current candle. A red arrow pointing downwards indicates a potential selling opportunity, while a blue arrow pointing upwards suggests buying opportunities. All that needs adjustment is the color of the signal arrows. It is recommended to use it on the M1-M5 timeframes as signals are frequent on these timef
Royal Dutch Skunk
Sayan Vandenhout
ROYAL DUTCH SKUNK USES THE TREND WAVE INDICATOR AND IT CAN IDENTIFY THE BEGINNING AND THE END OF A NEW WAVE TREND MOVEMENT. AS AN OSCILLATOR, THE INDICATOR IDENTIFIES THE OVERBOUGHT AND OVERSOLD ZONES. IT WORKS GREAT TO CATCH THE SHORT TERM PRICE REVERSALS AND USES A MARTINGALE STRATEGY TO CLOSE ALL TRADES IN PROFIT. USE DEFAULT SETTINGS ON H1 OR HIGHER TIME FRAME ON ANY PAIR FOR MORE ACCURATE TRADES WHY THIS EA : Smart entries calculated by 6 great strategies The EA can be run on even a $20000
The indicator detects and displays Shark harmonic pattern (see the screenshot). The pattern is plotted by the extreme values of the ZigZag indicator (included in the resources, no need to install). After detecting the pattern, the indicator notifies of that by a pop-up window, a mobile notification and an email. The indicator highlights the process of the pattern formation and not just the complete pattern. In the former case, it is displayed in the contour triangles. After the pattern is comple
Bu ürünün alıcıları ayrıca şunları da satın alıyor
Scalper Inside PRO
Alexey Minkov
4.74 (69)
An exclusive indicator that utilizes an innovative algorithm to swiftly and accurately determine the market trend. The indicator automatically calculates opening, closing, and profit levels, providing detailed trading statistics. With these features, you can choose the most appropriate trading instrument for the current market conditions. Additionally, you can easily integrate your own arrow indicators into Scalper Inside Pro to quickly evaluate their statistics and profitability. Scalper Inside
Atomic Analyst
Issam Kassas
5 (4)
Öncelikle belirtmek gerekir ki bu Ticaret Göstergesi Yeniden Çizim Yapmaz, Gecikmez ve Gecikme Göstermez, bu da hem manuel hem de robot ticareti için ideal hale getirir. Kullanıcı kılavuzu: ayarlar, girişler ve strateji. Atom Analisti, Piyasada Daha İyi Bir Avantaj Bulmak İçin Fiyatın Gücünü ve Momentumunu Kullanan PA Fiyat Hareketi Göstergesidir. Gürültüleri ve Yanlış Sinyalleri Kaldırmaya ve Ticaret Potansiyelini Artırmaya Yardımcı Olan Gelişmiş Filtrelerle Donatılmıştır. Birden fazla katman
Trend Lines PRO
Roman Podpora
5 (1)
TREND ÇİZGİLERİ PRO     Piyasanın gerçek yön değişimini anlamaya yardımcı olur. Gösterge, gerçek trend dönüşlerini ve büyük oyuncuların piyasaya yeniden girdiği noktaları gösterir. Anlıyorsun     BOS hatları  Daha yüksek zaman dilimlerindeki trend değişiklikleri ve önemli seviyeler, karmaşık ayarlar veya gereksiz gürültü olmadan gösterilir. Sinyaller yeniden çizilmez ve çubuk kapandıktan sonra grafikte kalır. VERSION MT 5     -    RFI LEVELS PRO  göstergesiyle birlikte kullanıldığında maksimum p
" Dynamic Scalper System " göstergesi, trend dalgaları içinde işlem yapmak için scalping yöntemi için tasarlanmıştır. Başlıca döviz çiftleri ve altın üzerinde test edilmiştir, diğer işlem araçlarıyla uyumluluğu mümkündür. Ek fiyat hareketi desteğiyle trend boyunca pozisyonların kısa vadeli açılması için sinyaller sağlar. Göstergenin prensibi. Büyük oklar trend yönünü belirler. Küçük oklar şeklinde scalping için sinyaller üreten bir algoritma trend dalgaları içinde çalışır. Kırmızı oklar yüksel
Quantum Breakout Indicator PRO
Bogdan Ion Puscasu
4.96 (26)
Tanıtım       Quantum Breakout PRO   , Breakout Bölgeleri ile ticaret yapma şeklinizi değiştiren çığır açan MQL5 Göstergesi! 13 yılı aşkın ticaret deneyimine sahip deneyimli tüccarlardan oluşan bir ekip tarafından geliştirilen   Quantum Breakout PRO   , yenilikçi ve dinamik koparma bölgesi stratejisiyle ticaret yolculuğunuzu yeni zirvelere taşımak için tasarlanmıştır. Kuantum Breakout Göstergesi, size 5 kar hedefi bölgesi ile kırılma bölgelerinde sinyal okları ve kırılma kutusuna dayalı olara
Currency Strength Exotics
Bernhard Schweigert
4.88 (33)
ŞU ANDA %20 INDIRIMLI! Herhangi bir Acemi veya Uzman Tüccar için En İyi Çözüm! Bu Gösterge, Egzotik Çiftler Emtialar, Endeksler veya Vadeli İşlemler gibi herhangi bir sembol için para birimi gücünü göstermek için uzmanlaşmıştır. Türünün ilk örneğidir, Altın, Gümüş, Petrol, DAX, US30, MXN, TRY, CNH vb. gerçek para birimi gücünü göstermek için 9. satıra herhangi bir sembol eklenebilir. Bu benzersiz, yüksek kaliteli ve uygun fiyatlı bir ticaret aracıdır çünkü bir dizi tescilli özelliği ve yeni b
Route Lines Prices - fiyat yönlerini bulmak için tasarlanmış bir göstergedir. Basit arayüzü, fiyat davranışı ve gelecekteki yön hesaplamaları için birden fazla algoritma içerir. Bu algoritmalar, kullanılan zaman dilimlerine bağlı olarak volatilite hesaplamalarını ve fiyat düzeltmesini içerir. Gösterge, " Calculating price values " değerini değiştirmek için tek bir parametreye sahiptir. Varsayılan 1 değeri, dengeli bir otomatik hesaplama sağlar, bu da göstergeyi manuel olarak yapılandırmadan kul
CRT Multi-Timeframe Market Structure & Liquidity Sweep Indicator Non-Repainting | Multi-Asset | MT5 Version Available MT5 Version:   https://www.mql5.com/en/market/product/162075 Full User Guide — explains what each feature does and why:   https://www.mql5.com/en/blogs/post/767525 Quick Start User Guide  — explains how to configure and in what order:  https://www.mql5.com/en/blogs/post/767540 Indicator Overview CRT Ghost Candle HTF Fractal is a complete institutional-grade market structure too
Şu anda %40 İNDİRİMLİ! Herhangi bir Acemi veya Uzman Tüccar için En İyi Çözüm! Bu gösterge paneli yazılımı 28 döviz çifti üzerinde çalışıyor. Ana göstergelerimizden 2'sine (Gelişmiş Para Birimi Gücü 28 ve Gelişmiş Para Birimi Dürtüsü) dayanmaktadır. Tüm Forex piyasasına harika bir genel bakış sağlar. Gelişmiş Para Birimi Gücü değerlerini, para birimi hareket hızını ve tüm (9) zaman dilimlerinde 28 Forex çifti için sinyalleri gösterir. Trendleri ve / veya scalping fırsatlarını belirlemek için
Super Signal Market Slayer Repaint Yok | Yüksek Hassasiyet | Çok Piyasaya Uyumlu Akıllı Trend Göstergesi Trading’de asıl zorluk emir vermek değil, piyasa gürültüsü içinde trendin ne zaman başladığını net şekilde görmektir. Market Slayer bu amaçla geliştirildi. Bu gösterge, gün içi işlemler için tasarlanmış repaint yapmayan akıllı bir indikatördür. Çok katmanlı onay ve trend filtreleme sayesinde yalnızca kritik anlarda net ve güvenilir Buy / Sell sinyalleri üretir. Temel Avantajlar Repaint yok B
Dynamic Forex28 Navigator
Bernhard Schweigert
4.43 (7)
Dynamic Forex28 Navigator - Yeni Nesil Forex Ticaret Aracı. ŞU ANDA %49 İNDİRİM. Dynamic Forex28 Navigator, uzun zamandır popüler olan göstergelerimizin evrimidir ve üçünün gücünü tek bir göstergede birleştirir: Gelişmiş Döviz Gücü28 Göstergesi (695 inceleme) + Gelişmiş Döviz İMPULS ve UYARI (520 inceleme) + CS28 Kombo Sinyalleri (Bonus). Gösterge hakkında ayrıntılar https://www.mql5.com/en/blogs/post/758844 Yeni Nesil Güç Göstergesi Ne Sunuyor?  Orijinallerde sevdiğiniz her şey, şimdi yeni
GOLD Impulse with Alert
Bernhard Schweigert
4.67 (12)
Bu gösterge, 2 ürünümüz Advanced Currency IMPULSE with ALERT  +   Currency Strength Exotics  'in süper bir kombinasyonudur. Tüm zaman dilimleri için çalışır ve 8 ana para birimi artı bir Sembol için grafiksel olarak güç veya zayıflık dürtüsünü gösterir! Bu Gösterge, Altın, Egzotik Çiftler, Emtialar, Endeksler veya Vadeli İşlemler gibi herhangi bir sembol için para birimi gücü ivmesini göstermek için uzmanlaşmıştır. Türünün ilk örneğidir, Altın, Gümüş, Petrol, DAX, US30, MXN, TRY, CNH vb. içi
Reversal Master
Alexey Minkov
4.8 (15)
The Reversal Master is an indicator for determining the current direction of price movement and reversal points. The indicator will be useful for those who want to see the current market situation better. The indicator can be used as an add-on for ready-made trading systems, or as an independent tool, or to develop your own trading systems. The Reversal Master indicator, to determine the reversal points,  analyzes a lot of conditions since the combined analysis gives a more accurate picture of t
Volatility Trend System - girişler için sinyaller veren bir ticaret sistemi. Oynaklık sistemi, trend yönünde doğrusal ve noktasal sinyaller ve ayrıca yeniden çizme ve gecikme olmaksızın trendden çıkmak için sinyaller verir. Trend göstergesi, orta vadeli trendin yönünü izler, yönünü ve değişimini gösterir. Sinyal göstergesi volatilitedeki değişikliklere dayalıdır ve piyasa girişlerini gösterir. Gösterge, çeşitli uyarı türleri ile donatılmıştır. Çeşitli alım satım araçlarına ve zaman dilimlerine
RFI levels PRO
Roman Podpora
5 (1)
Bu gösterge, fiyat dönüş noktalarını ve fiyat geri dönüş bölgelerini doğru bir şekilde gösterir.       Başlıca oyuncular   . Yeni trendlerin nerede oluştuğunu görüyorsunuz ve her işlem üzerinde kontrolü elinizde tutarak, azami hassasiyetle kararlar alıyorsunuz. TREND LINES PRO   göstergesiyle birlikte kullanıldığında maksimum potansiyelini ortaya koyar.  VERSION MT5 Göstergenin gösterdiği şey: Yeni bir trendin başlangıcında aktivasyonla birlikte tersine dönüş yapıları ve tersine dönüş seviyeler
Binary Volume Edge – Martingale Stats  Indicator for binary options with live pre-signals and full martingale stats Binary Volume Edge – Martingale Stats is a professional tool that combines powerful signal filtering, smart martingale analysis, and a unique early warning system. No magic – just clear rules and verifiable stats. What do you get? 1. Signals you can trust Absolute absence of redrawing – arrows appear only on closed candles and never change again. Preliminary signals on t
Introduction Harmonic Patterns are best used to predict potential turning point. Traditionally, Harmonic Pattern was identified manually connecting peaks and troughs points in the chart. Manual harmonic pattern detection is painfully tedious and not suitable for everyone. You are often exposed under subjective pattern identification with manual pattern detection. To avoid these limitations, Harmonic Pattern Plus was designed to automate your harmonic pattern detection process. The functionality
Currency Strength Matrix
Raymond Gilmour
4.5 (26)
THE ONLY CURRENCY STRENGTH INDICATOR THAT IS BASED ON PRICE ACTION. DESIGNED FOR TREND, MOMENTUM & REVERSAL TRADERS This indicator  reads price action to confirm trend and strength . Advanced multi-currency and multi-time frame indicator that shows you simply by looking at one chart, every currency pair that is trending and the strongest and weakest currencies driving those trends. For full details on how to use this indicator, and also how to get a FREE chart tool, please see user manual HERE
Hi, I made one of best sygnalizators on a stock markets. It's prepared for a pro players. There is not even, a one mistake. It works on every timeframe and every stock market. Test it before you say something, in my 7 years I check houndreds of fakes. This one work right in time, not in slow motions. It' s a dot with 3 levels of strong power depends on how strong market is. If power is high you have very profitable results but the most important it's allways on time. So it is protecting your acc
Wave and Cycle counter to give an immediate indication how far the ongoing trend has progressed. Low numbers: trend has just started, ride the trend. Higher numbers: trend is 'older', watch for reversals This indicator is 100% compatible with the fantastic TopDog trading strategy. (I will NOT give any details about this Top Dog strategy) The trend direction is determined by a SMA value (or any other MA) you can set. Waves and cycles numbers and letters are derived from a SlowStoch setting. Wave
Miraculous Göstergesi – Gann Dokuz Kareye Dayalı %100 Tekrarlamayan Forex ve İkili Araç Bu video, Forex ve İkili Opsiyon traderları için özel olarak geliştirilmiş son derece doğru ve güçlü bir ticaret aracı olan Miraculous Göstergesi 'ni tanıtıyor. Bu göstergeyi benzersiz kılan, efsanevi Gann Dokuz Karesi ve Gann Titreşim Yasası 'na dayanmasıdır; bu da onu modern ticarette mevcut en hassas tahmin araçlarından biri yapmaktadır. Miraculous Göstergesi tamamen tekrarlamaz ; yani mum kapandıktan son
Grafikleri yapılandıran ve döngüsel fiyat hareketlerini belirleyen teknik bir gösterge. Herhangi bir grafik üzerinde çalışabilirim. Birkaç çeşit bildirim var. Grafiğin kendisinde ek oklar var. Tarihe yeniden bakmadan, mumun kapanışına dair çalışmalar. M5 ve üzeri TF önerilir. Kullanımı ve yapılandırması kolay parametreler. Farklı parametrelere sahip 2 indikatörü kullanırken, bunları diğer indikatörler olmadan da kullanabilirsiniz. 2 giriş parametresi vardır Döngüsellik ve Sinyal Süresi Bu 2 pa
GEM Signal Pro GEM Signal Pro, MetaTrader 4 için geliştirilmiş bir trend takip göstergesidir ve daha net sinyaller, daha düzenli işlem kurulumları ve daha pratik risk yönetimini doğrudan grafik üzerinde görmek isteyen yatırımcılar için tasarlanmıştır. Sadece basit bir ok göstermek yerine, GEM Signal Pro işlem fikrinin tamamını daha temiz ve daha okunabilir bir şekilde sunmaya yardımcı olur. Koşullar onaylandığında, gösterge giriş fiyatını, stop loss seviyesini ve take profit hedeflerini grafik ü
Linear Trend Predictor - Giriş noktalarını ve yön destek çizgilerini birleştiren bir trend göstergesi. Yüksek/Düşük fiyat kanalını kırma prensibiyle çalışır. Gösterge algoritması piyasa gürültüsünü filtreler, oynaklığı ve piyasa dinamiklerini dikkate alır. Gösterge yetenekleri  Düzeltme yöntemleri kullanılarak piyasa trendi ve ALIM veya SATIŞ emirlerinin açılabileceği giriş noktaları gösterilir.  Herhangi bir zaman dilimindeki grafikleri analiz ederek kısa ve uzun vadeli piyasa hareketlerini
Hidden Block Finder MT4
Umar Ilyas Raja Muhamma Ilyas
Hidden Block Göstergesi Profesyonel Trading Aracı   Ürün Özeti Fiyattaki gizli kurumsal tepki bölgelerini gösteren yapı-temelli bir indikatördür.   Özellikler Otomatik Hidden Block tespiti Dinamik destek & direnç Yapı ve trend ile uyumlu Volatilite tabanlı doğrulama Temiz grafik görünümü Tüm semboller & zaman dilimleri Onay sonrası repaint yapmaz   Neden Hidden Block? Fiyat büyük hareketlerden önce sessizce tepki verir.   Kullanım Trend belirle Blok dönüşünü bekle Yapı/kandil teyid
Öncelikle, bu Ticaret Aracının Non-Repainting, Non-Redrawing ve Non-Lagging Gösterge olduğunu vurgulamakta fayda var, bu da onu profesyonel ticaret için ideal hale getiriyor. Çevrimiçi kurs, kullanıcı kılavuzu ve demo. Akıllı Fiyat Hareketi Kavramları Göstergesi, hem yeni hem de deneyimli tüccarlar için çok güçlü bir araçtır. İleri ticaret fikirlerini, Inner Circle Trader Analizi ve Smart Money Concepts Ticaret Stratejileri gibi 20'den fazla kullanışlı göstergeyi bir araya getirerek bir araya g
Bu gösterge, pratik ticaret için mükemmel olan otomatik dalga analizine yönelik bir göstergedir! Dava... Not:   Dalga sınıflandırması için Batılı isimleri kullanmaya alışkın değilim. Tang Lun'un (Tang Zhong Shuo Zen) adlandırma kuralının etkisiyle, temel dalgayı   kalem   , ikincil dalga bandını ise   segment   olarak adlandırdım. aynı zamanda segmentin trend yönü vardır. Adlandırma   esas olarak trend segmentidir   (bu adlandırma yöntemi gelecekteki notlarda kullanılacaktır, öncelikle söyleyey
Adaptive Volatility Range [AVR] is a powerful tool for identifying key trend reversal points. AVR accurately reflects the Average True Range (ATR) of volatility, taking into account the Volume-Weighted Average Price (VWAP). The indicator adapts to any market volatility by calculating the average volatility over a specific period, ensuring a stable rate of profitable trades. You receive not just an indicator but a professional automated trading system , AVR-EA . Advantages: Automated Trading Sys
GoldRush Trend Ok Sinyali GoldRush Trend Ok Sinyali göstergesi, XAU/USD'de yüksek hızlı, kısa vadeli scalperlar için özel olarak tasarlanmış hassas, gerçek zamanlı trend analizi sağlar. 1 dakikalık zaman dilimi için özel olarak tasarlanan bu araç, net giriş noktaları için yön okları gösterir ve scalper'ların değişken piyasa koşullarında güvenle hareket etmelerini sağlar. Gösterge, PRIMARY ve SECONDARY uyarı oklarından oluşur. PRIMARY sinyalleri, trend yönündeki değişikliği gösteren Beyaz ve
NAM Order Blocks
NAM TECH GROUP, CORP.
3.67 (3)
MT4 Multi-timeframe Order Blocks detection indicator. Features - Fully customizable on chart control panel, provides complete interaction. - Hide and show control panel wherever you want. - Detect OBs on multiple timeframes. - Select OBs quantity to display. - Different OBs user interface. - Different filters on OBs. - OB proximity alert. - ADR High and Low lines. - Notification service (Screen alerts | Push notifications). Summary Order block is a market behavior that indicates order collection
Yazarın diğer ürünleri
Today is the Day
Alexander Shienkov
5 (3)
This simple information indicator shows the name of the current day and past working days, months and years. On the concept of time and timeframe It is common knowledge that a timeframe is a time interval considered in technical analysis of free financial markets, during which the price and other market data changes occur when the price charts are plotted. In the MetaTrader 4 trading terminal, these periods are separated by vertical dashed line, which can be enabled or disabled by simply pressi
FREE
Indicator of vertical lines on the timeframes М5 and М1. It draws the lines for the period of the current day and the previous day. This indicator visualizes visually shows the trader the beginning and end of the chart hour, as well as the past hourly periods, 30-minute and 5-minute chart intervals. The advantage provided by this indicator is that the trader using this indicator on a chart of a currency pair with the smaller timeframe will always be aware of when the new hour begins. On the con
FREE
Spread and Cost pips
Alexander Shienkov
5 (2)
It is another simple information indicator. This indicator shows the current spread of a financial instrument and the value of one point with a volume of 0.10 lot. About the Spread Spread is the difference between the Ask and the Bid price of an asset in the stock or currency exchange. Let's refer to Central Banks and currency exchange in these banks, in order to understand why Spread is so important in currency trading. In Central Banks, we always see the difference between the buying and the
FREE
EMA Above Below Bid price Технический индикатор в помощь трейдеру. Данный индикатор, показывает расположение пяти ЕМА,  пяти средних скользящих, относительно цены формирующей японские свечи или бары (цена Bid ). О понятии ЕМА. Скользящая средняя (moving average, MA)  — это дополнительная линия на графике цены актива.  Внешне она повторяет график цены, но с небольшим запозданием и более гладко, без колебаний. Основные характеристики: 1.     Показывает тренды. Если скользящая устремлена ввер
FREE
High and Low Levels EMA Технический индикатор в помощь трейдеру. Однажды пришла идея при изучении индикатора Moving A verage ( MA ). Так как мувинги эти сглаженное, среднее значения цены за выбранный период, то как и у обычной цены и у мувинга должны быть «хаи и лои». Данный индикатор, показывает уровни High и Low . Динамических уровней поддержки и сопротивления. О понятии High и Low . Хай  — от английского  high  — обозначает наиболее высокую цену («рынок на  хаях » — капитализация актив
FREE
Opening Candle Time
Alexander Shienkov
5 (1)
A simple information indicator showing the time left before the opening of the next candlestick or bar. About the concept of a timeframe A timeframe is the time interval considered in the technical analysis of free financial markets (the same applies to the global currency market), during which the price and other market data change. The smallest timeframe is the so-called tick. A timeframe is the time interval used to group quotes when drawing elements of a price chart (bars, Japanese candlest
FREE
ATR info panel
Alexander Shienkov
5 (1)
Индикатор таблица, постоянно меняющихся значений, пройденных ценой пунктов от начало дня (D1) , от начала недели (W1) и от начала текущего месяца (MN) . Индикатор также показывает средний дневной АТР за выбранный период. Параметры всей таблицы регулируются. Перемещение по осям монитора, для расположения в удобном месте, цвета текстов и заполнений ячеек, размеры столбцов, строк, цифр и текстов. Пользоваться можно на белом и тёмном фоне. По индикатору трейдер может легко определить настроение на р
Indicator of the Margin Call, Stop Out and Plus 100 (one hundred percent of profit to the deposit) levels. It has been designed to better visualize and maintain money management when trading financial instruments. The levels drawn by the indicator have different colors. They visualize the price range, at which a broker generates a notification (Margin Call) and force closes the deals (Stop Out) due to the shortage of funds on the account, in case the price goes against the positions opened by a
An indicator of round levels. A range of important price levels with sound and text alerts, which are generated when the current Bid price of a currency pair is equal to a round number. This indicator visually shows the trader true support and resistance levels, which are used by most of traders and trading robots. The advantage provided by this indicator is that the trader using this indicator on a chart does not need to draw any additional levels. Round price levels represent a certain barrier
This indicator shows the levels and signal dots of the Doji pattern. The indicator allows traders to easily determine possible location of a price rebound. Doji is a candlestick with Open and Close price equal, or almost equal. It should also have shadows of approximately the same size on both sides. Doji denotes the balance between buyers and sellers, or the absence of major players, or level testing. This pattern can mean both a reversal and a continuation of the trend. Indicator Parameters I
This indicator visualizes the intersection of two moving averages. (SМА, EMA, SMMA, LWMA). It has been created for visibility of signals and notification about intersections of Moving Average. Moving Average is simply the averaged value of the price for the selected timeframe (TF). Therefore, the moving averages are used on a wide variety of timeframes, from 1 minute to a year and even decades. Possible types of moving averages in the indicator SMA (Simple Moving Average); EMA (Exponential Movi
This indicator visualizes the intersection of two moving averages in the MACD oscillator. It uses the histogram color to signal about the moving averages crossing the zero level of the indicator. The MACD (Moving Average Convergence/Divergence) indicator is a popular oscillator actively used by traders when working in the currency and stock markets to determine trends and to search for trading signals. This linear indicator allows obtaining a variety of trading signals: crossing the zero line; d
Folding meter 4 Trend Lines
Alexander Shienkov
4.5 (2)
Folding rule of 4 trend lines The indicator has been created based on the "Folding rule" trading strategy. It shows four pairs of inclined resistance and support lines. These lines are plotted based on the nearest High and Low of the ZigZag technical indicator with four given input parameters. The indicator draws dots above and below the price extremums that have been used for plotting the trend lines. The indicator of trend lines facilitates the plotting of trend lines, channels and technical p
Kiss III EMA
Alexander Shienkov
Индикатор динамического уровня сопротивления и поддержки Moving Average. Визуально показывает момент прикосновение цены Bid , одной или трёх скользящих средних с   заданными во входных параметрах свойствами. Создан для наглядности сигналов и оповещения состоявшегося пересечения (прикосновения) цены Bid и Moving Average. Скользящая средняя — это просто усредненное значение цены за выбранный период времени, он же таймфрейм (ТФ). Именно поэтому скользящие используются на самых разнообразных ТФ,
Ещё один простой информационный индикатор, показывающий самые важные торговые сессии валютного рынка. О понятии торговых сессий. Всем известно, что торговая сессия – это промежуток времени, в течение которого банки и другие участники рынка ведут активную торговлю, при этом активизируются   в определённые часы рабочего дня. Валютный рынок, рынки акций и сырьевые рынки   работают круглосуточно с понедельника по пятницу, кроме праздничных дней. Когда в одной стране ещё спят, в другой рабочий ден
Risk Manager VT Робот - помощник, от команды VT. О рискменеджменте в торговле: Грамотный риск менеджмент в трейдинге – это залог успеха при решении основных Ваших задач, при активной ручной торговле, на биржевом рынке: дисциплина и контроль эмоций! Данный помощник поможет вам с лёгкостью ограничивать риски на каждую сделку, и правильно выставить уровни прибылей. Те кто долго торгуют, на валютном рынке, уже знают, что правильное соотношение риск/прибыль, является эффективным инструментом в
Open Day and ATR
Alexander Shienkov
Информационный индикатор, показывающий самые важные торговые уровни для внутридневной торговли, и не только. О понятии уровней «Поддержка» и «Сопротивление». Всем известно, что исторический ценовой диапазон цен состоит из уровней от которых в прошлом, были значимые движения. И уровни работающие в прошлом, наверняка будут работать и сейчас. К примеру, уровень, находящийся снизу текущей цены является уровнем «Поддержки», если от него ранее было значительное движение. К примеру, уровень, нах
History VT
Alexander Shienkov
History VT Информационный индикатор. Показывает на графике, сразу после открытия сделки, стрелку именно на той японской свече, где позиция открыта. То есть там, где появилась штрихпунктирная линия открытой сделки, в терминале. Далее, после открытия сделки, как обычно, трейдер ставит SL и TP  и ждёт итога своего выбора направления движения. После того как сделка закрылась, по « sl » или « tp » или «вручную», индикатор отображает на графике уровни и текстовые сноски параметров сделки. Сноски
Auto Multi Channels VT Ещё один технический индикатор в помощь трейдеру. Данный индикатор, автоматически показывает, наклонные каналы в восходящем, нисходящем и боковом движении цены, т.е. тренды. (Внутри дня. Среднесрочные и долгосрочные, а также Восходящие, нисходящие и боковые). О понятии Тренд. На бирже, трендом называется  направленное движение ценового графика в одну из сторон (вверх или вниз) . То есть, тренд в трейдинге — это ситуация, когда цена определенное время возрастает или сниж
Old Time Frame EMA   Индикатор двух динамических уровней сопротивления и поддержки Moving Average. Данный индикатор рисует на открытом графике младшего тайм фрейма, ЕМА со старшего тайм фрейма.   Создан для наглядности сигналов, для входа в рынок, для тех трейдеров, у кого Средние Скользящие Цены (ЕМА или МА), являются основным сигналом для открытия или закрытия сделок. А также ориентиром, направлением тренда в движении текущих цен, внутри дня и в среднесрочной торговле. Возможные типы сред
Filtrele:
Değerlendirme yok
Değerlendirmeye yanıt