Channels VT Auto Multi
- Göstergeler
- Sürüm: 1.0
- Etkinleştirmeler: 10

Auto Multi Channels VT
Ещё один технический индикатор в помощь трейдеру. Данный индикатор, автоматически показывает, наклонные каналы в восходящем,
нисходящем и боковом движении цены, т.е. тренды. (Внутри дня. Среднесрочные и долгосрочные, а также Восходящие, нисходящие и боковые).
О понятии Тренд.
На бирже, трендом называется направленное движение ценового графика в одну из сторон (вверх или вниз). То есть, тренд в трейдинге — это ситуация,
когда цена определенное время возрастает или снижается. Исходя из этого, ситуация, при которой цена некоторое время возрастает — это «тренд вверх».
А когда цена некоторое время снижается — это «тренд вниз».
Виды трендов в трейдинге. Существует всего три типа тренда: восходящий, нисходящий и боковой.
Восходящий тренд - наблюдается, когда цена по большей части движется вверх.
Нисходящий тренд - формируется, когда цена по большей части падает в течение долгого периода.
Горизонтальный или боковой тренд - это слабое движение цены, обычно внутри определённого узкого, диапазона цен, вправо.)
Что значит торговать по тренду?
Торговать по тренду значит:
Когда тренд восходящий - открывайся на повышение, если нисходящий – открываем сделки на понижение. Импульсы в трендах
всегда сильнее коррекций. Поэтому, если открываться в направлении импульсов, вероятность заработать всегда выше.
Кто торгует против тренда?
Торговля против тренда - это подход к торговле, когда трейдер стремится получить прибыль от ценовых движений, которые
идут вразрез с преобладающим трендом. Трейдеры, работающие против тренда, пытаются поймать краткосрочный откат цены
или полный разворот.
Обычно торговые стратегии против тренда имеют среднесрочную продолжительность - позиция удерживается от нескольких часов,
до нескольких дней и недель.
Примечание. Метод торговли с помощью трендового Индикатора AMC:
В дополнении, всего вышесказанного о трендах, хочется вспомнить ещё одну основу торговли – это уровни «Поддержки и Сопротивления».
Как известно принято считать, что эти уровни именно горизонтальные. И всем известно что трейдеру нужно на поддержке покупать,
а сопротивлении продавать. И для правильности сделок, войдя в рынок, размещать стоп ордера, за этими уровнями с учётом двух спредов.
Работая на отскок от уровней.
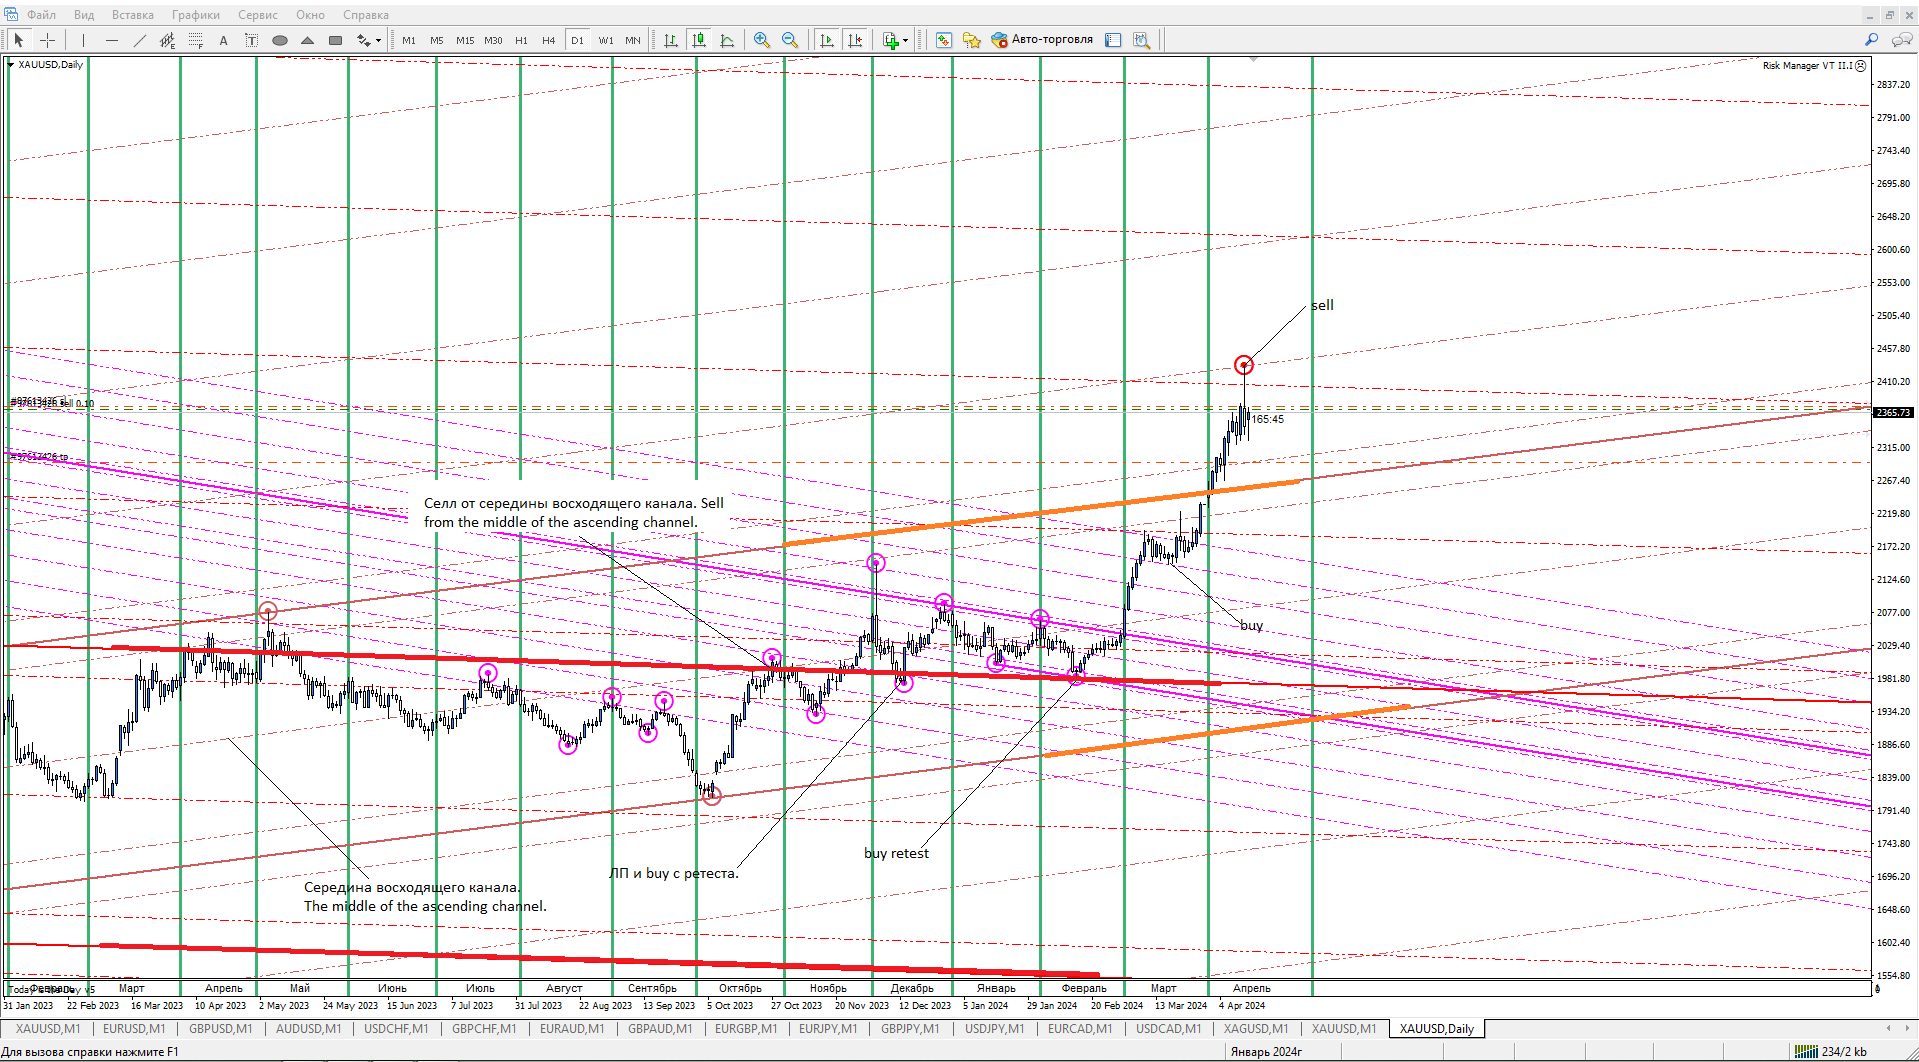
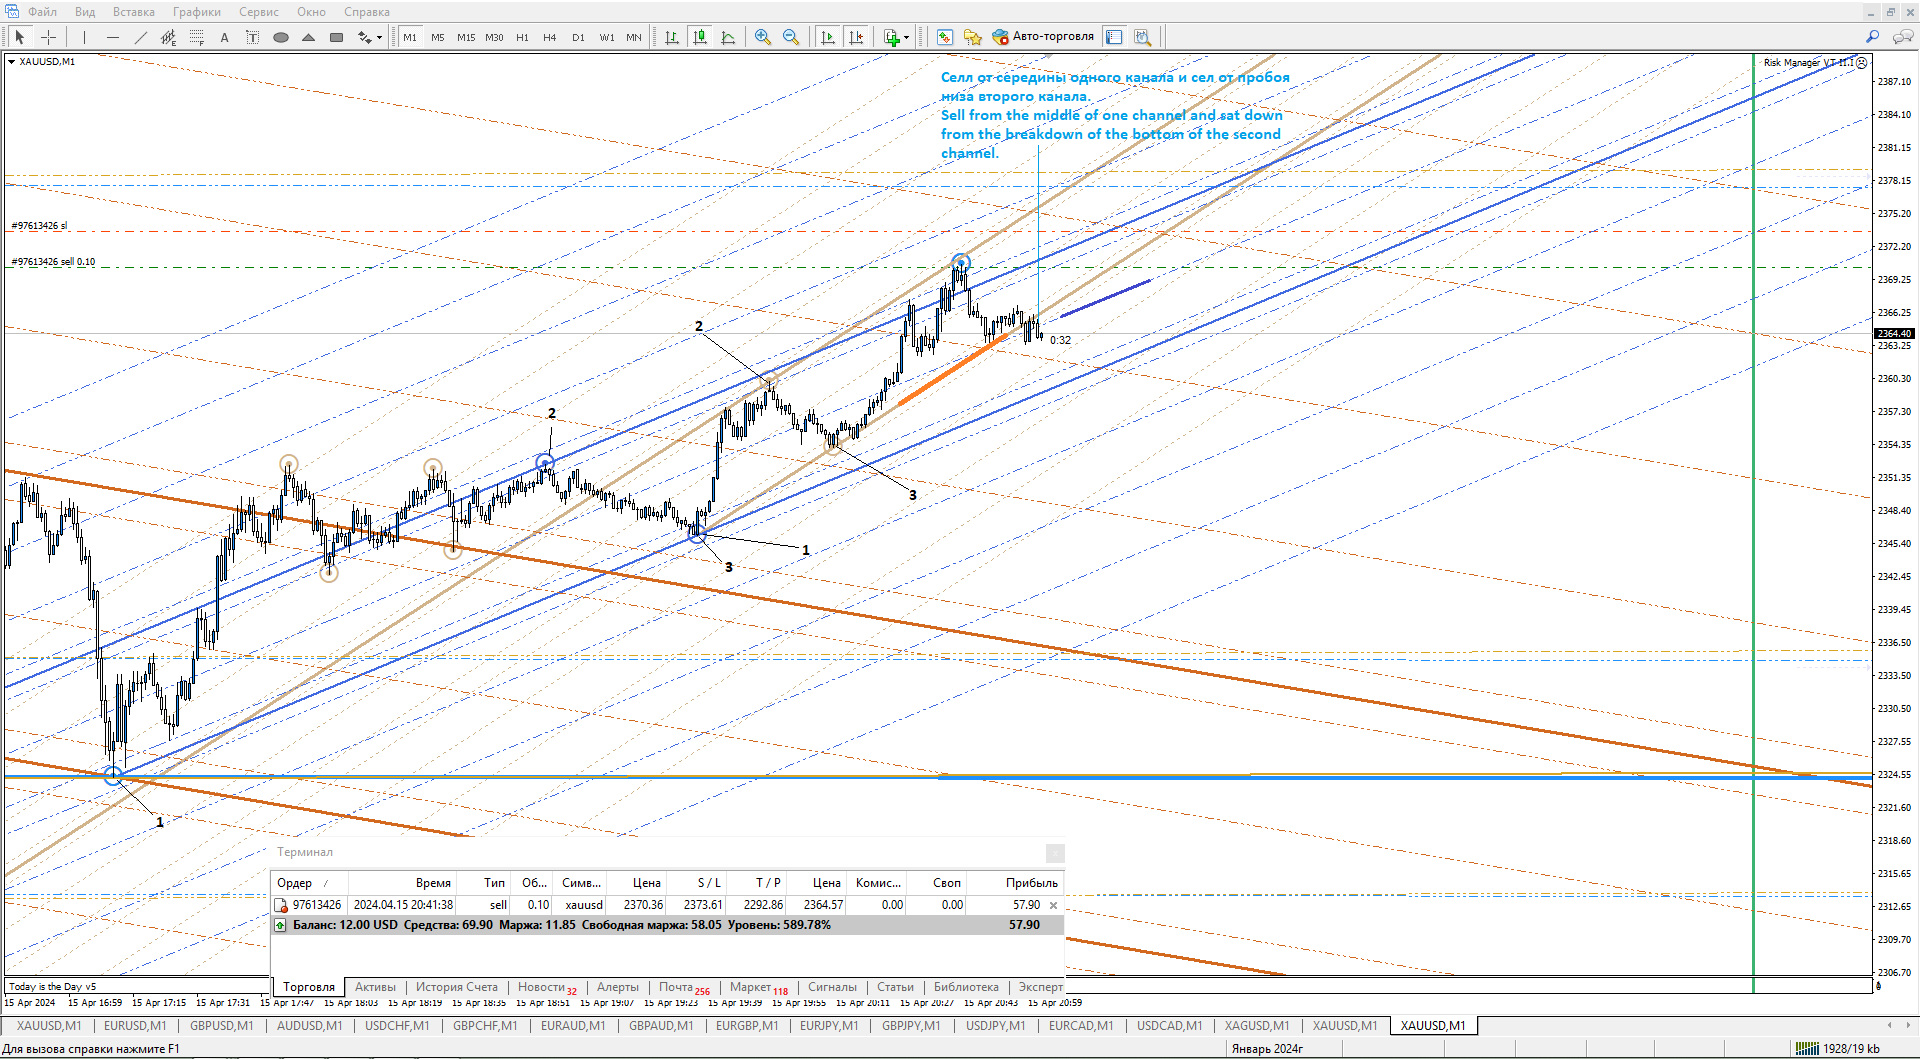
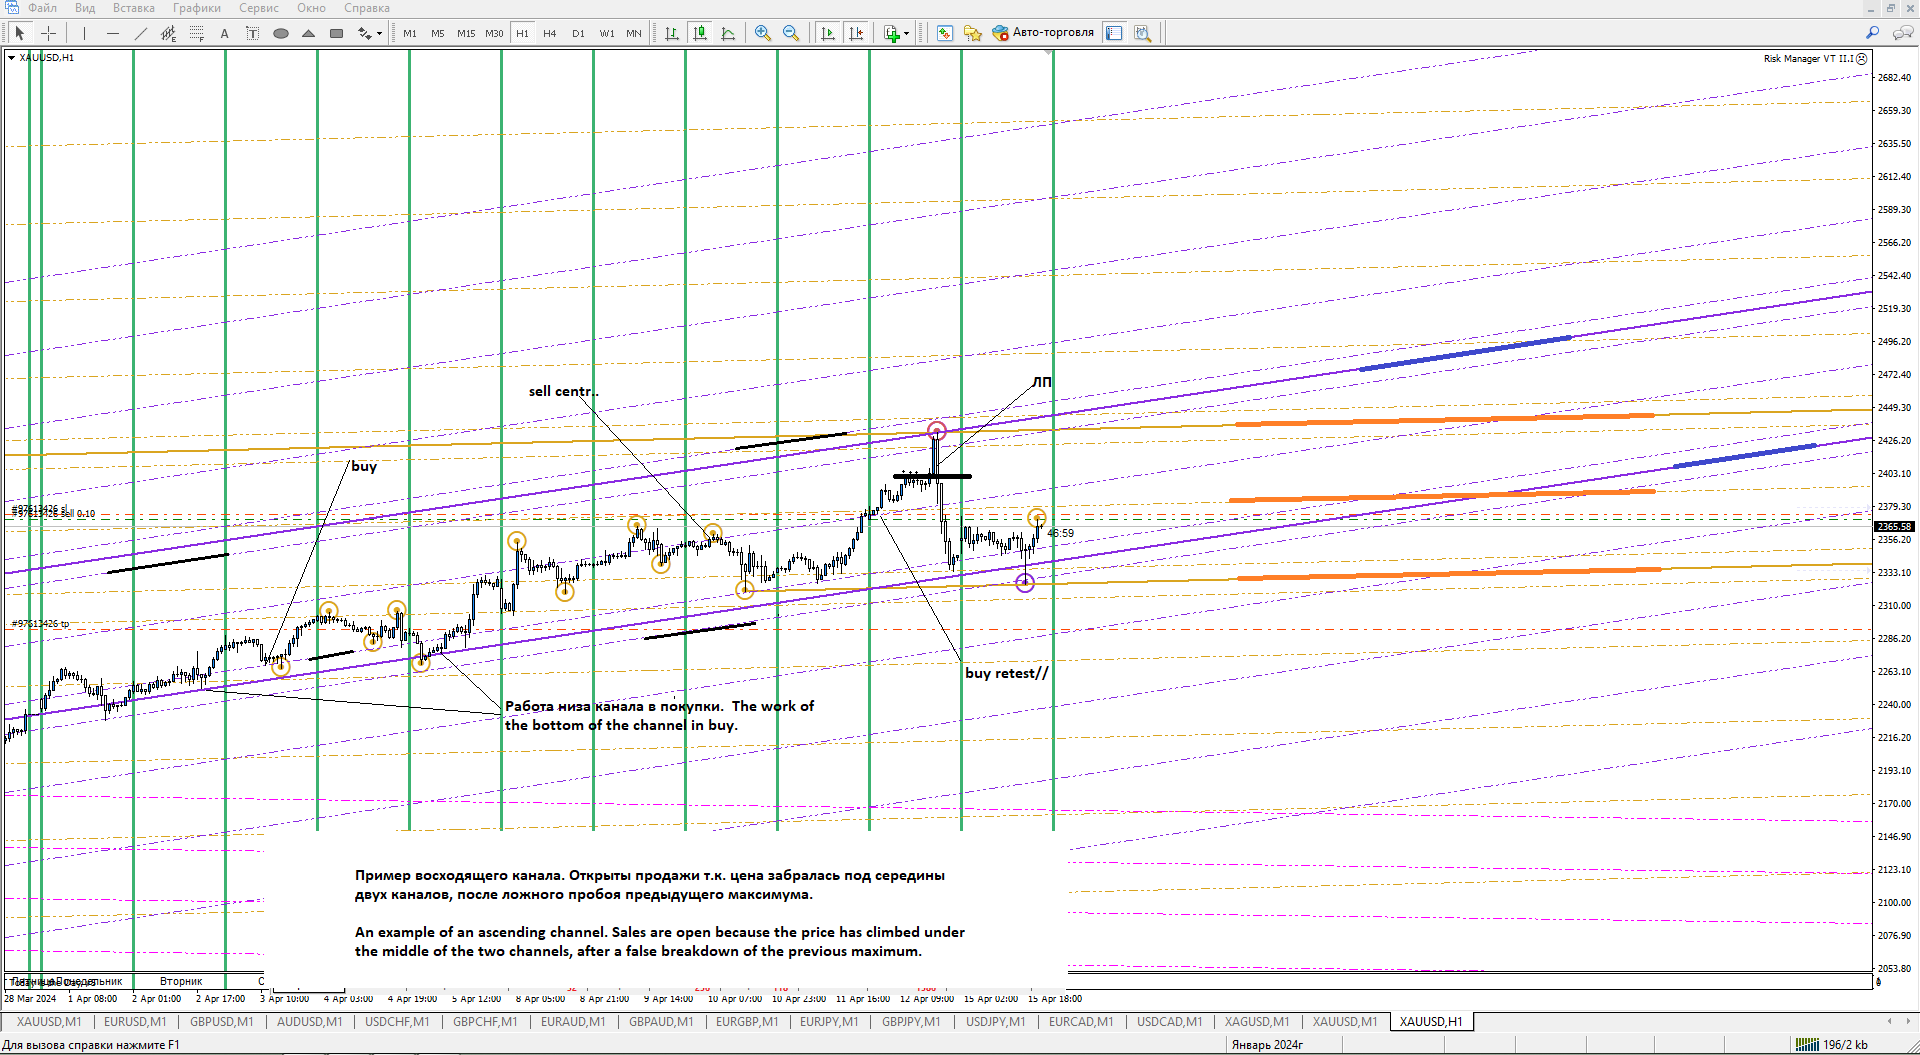
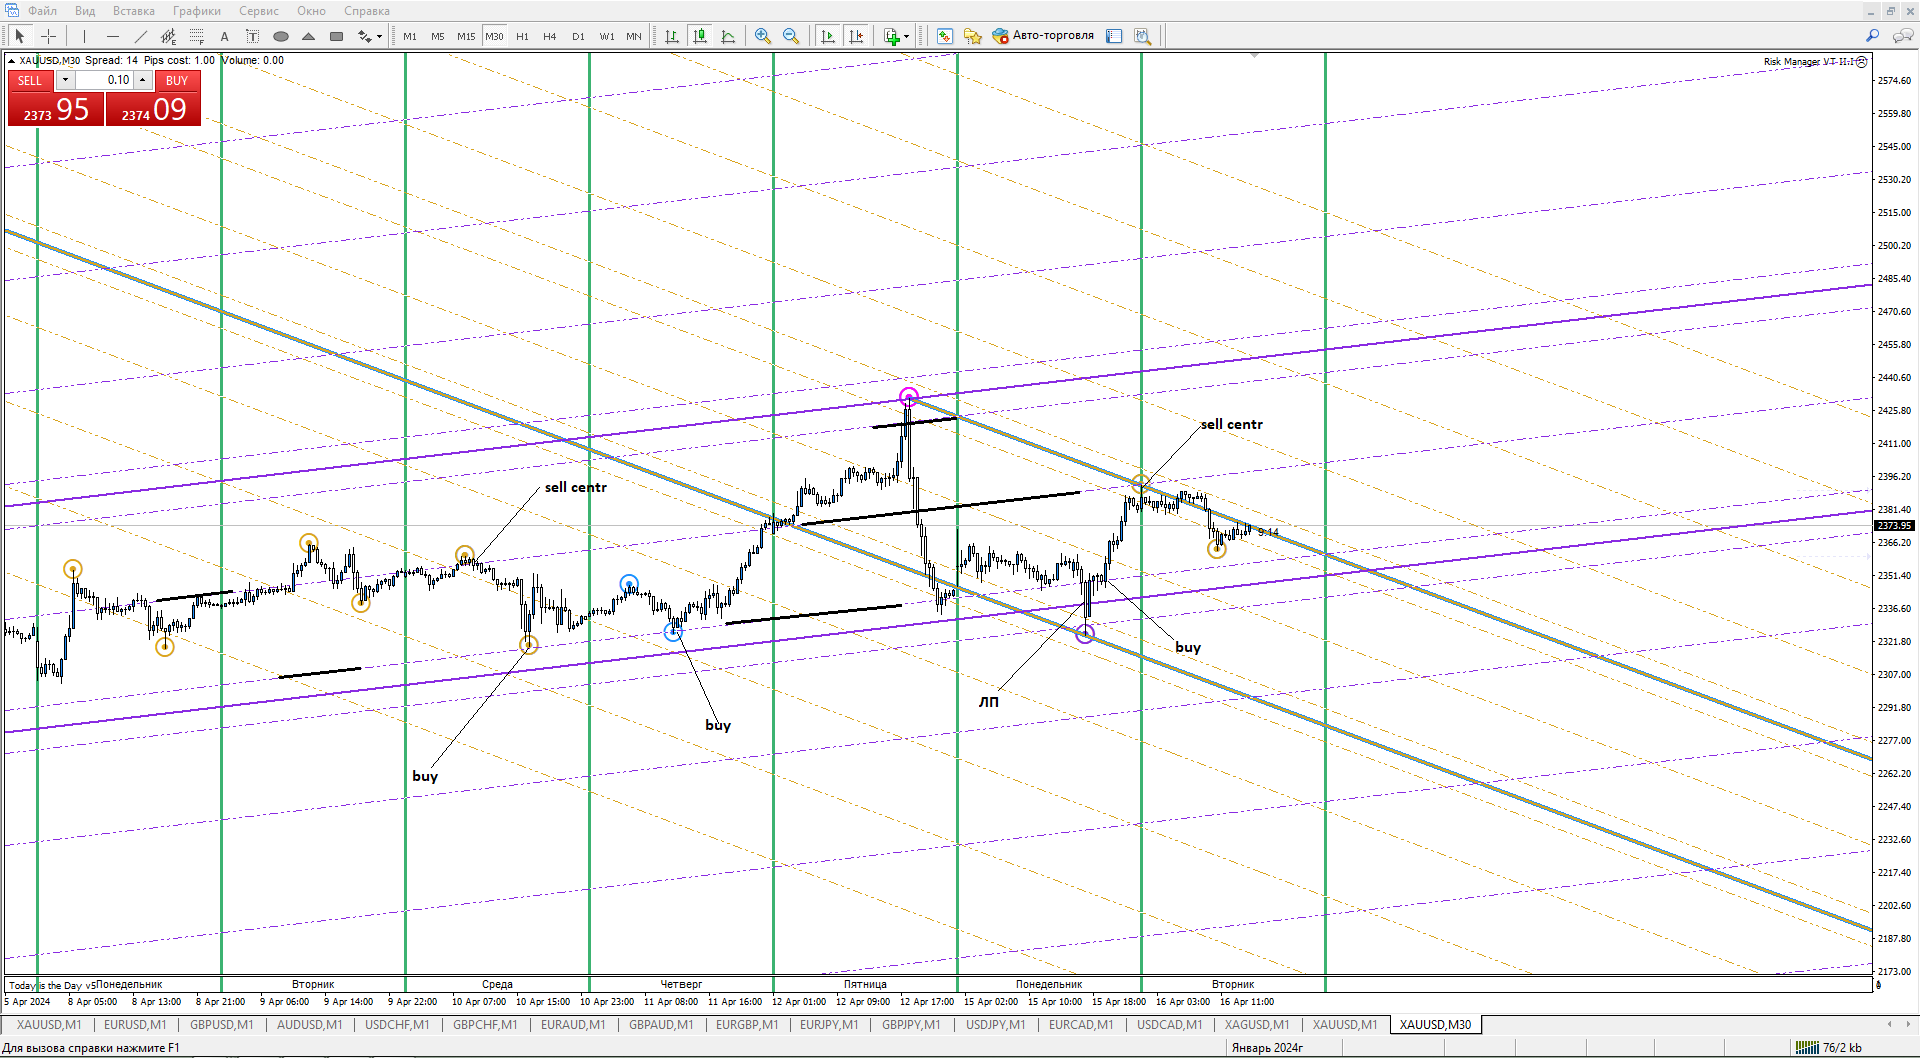
Ну так вот данный индикатор АМС, рисует автоматически ещё и наклонные уровни «Поддержки и Сопротивления» от которых можно и нужно
работать. И не малую важность в работе в канале, имеет наклонный уровень, «Середины канала» (СК). Т.е., к примеру, после того как цена
отскочила от сформированного низа или верха канала, дойдя и пробив середину канала, можно зайти в рынок с «Ретеста» наклонного уровня СК.
Но важнее всего заходить от краёв канала, т.е. от сформированных трендовых линий (верх или низ) канала. На поддержке покупаем,
на сопротивлении продаём. И как и в варианте с просто горизонтальными уровнями риск (sl) прячем за уровнями от которых была открыта сделка.
Подробности и примеры входов смотри на скрине индикатора. Успехов!
Что такое «Ретест» в трейдинге простыми словами?
Ретест - это повторный возврат к пробитому уровню поддержки/сопротивления. Слово происходит от двух слов - "Тест" - тестирование.
"Ре" - происхождение слова с англ. “обратно, опять снова”. Явление" ретеста" происходит у важных уровней, при котором цена сначала пробивает
ранее наметившийся уровень, а потом ненадолго возвращается к нему (происходит откат), после чего она продолжает движение в изначальном
направлении.
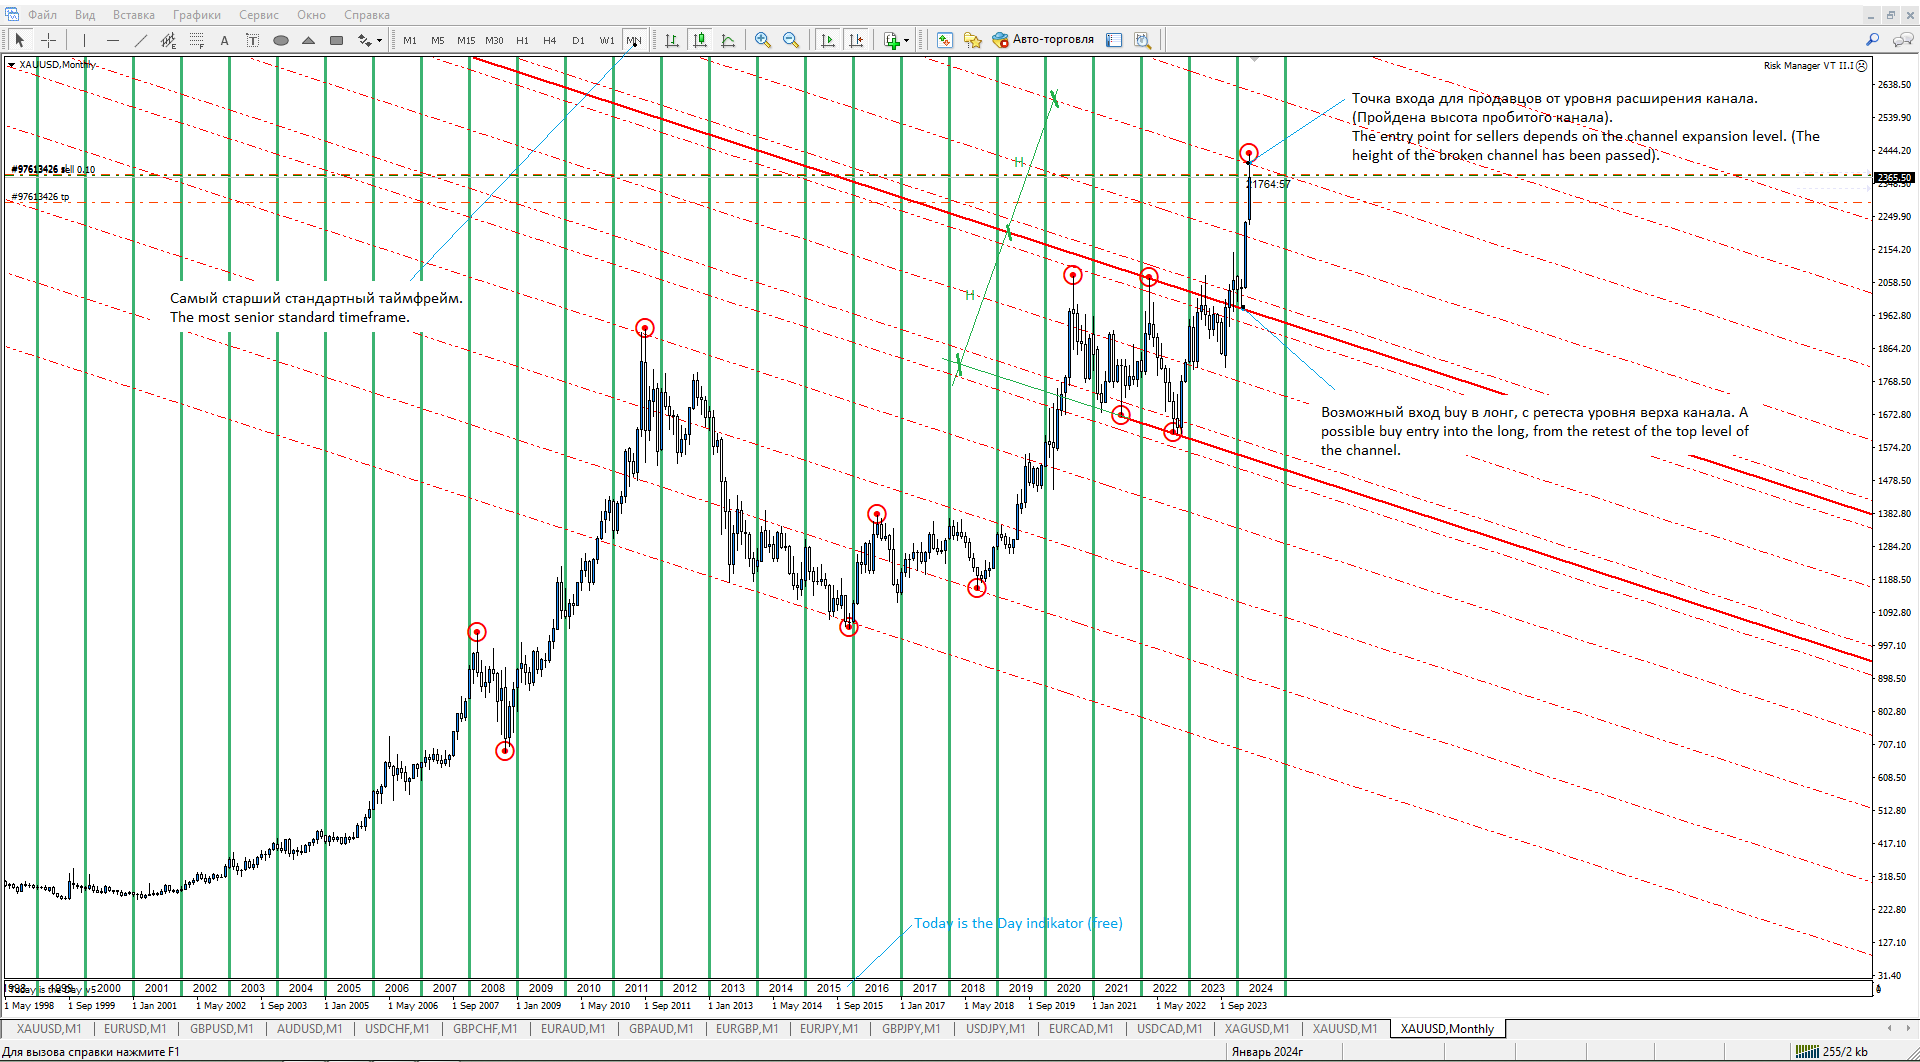
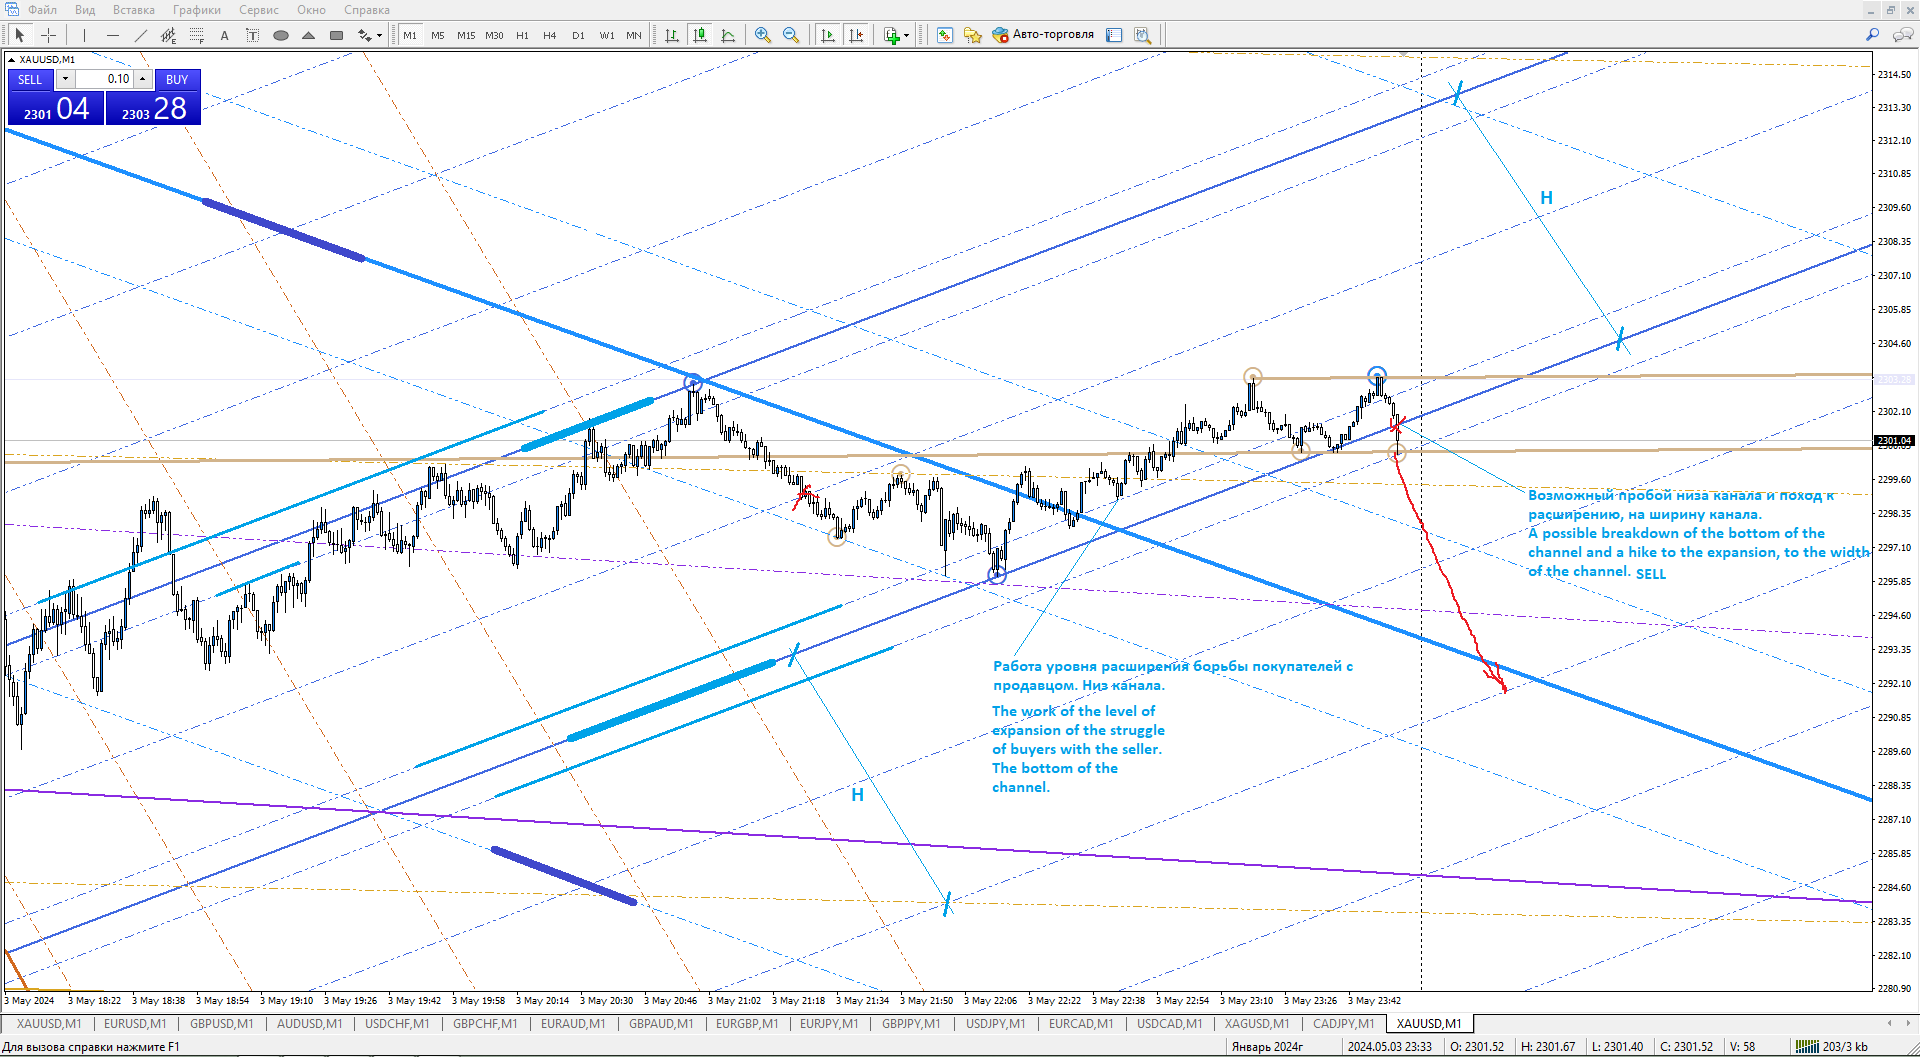
Расширение канала.
Также, по моему мнению, и я заметил, что в рынке в движениях цены есть симметрия движений цены. Поэтому, в данном индикаторе «АМС»,
я добавил ещё и «расширение канала». Т.е. когда цена вышла из канала, пробив верх или низ канала, есть смысл, с того же самого «ретеста»
уровня, зайти в продолжение движения. И запасом хода, постановкой тейк профита (tp) будет размер половины высоты канала, из которого
цена вышла пробив край канала. Подробности на скрине индикатора.
Расширение канала, во входных параметрах индикатора можно: выключать и включать.
При включенном расширении каналов, индикатор также рисует «уровни коррекции»,
точнее «борьбы» покупателей и продавцов, около краёв каналов. Смотри скрин индикатора.
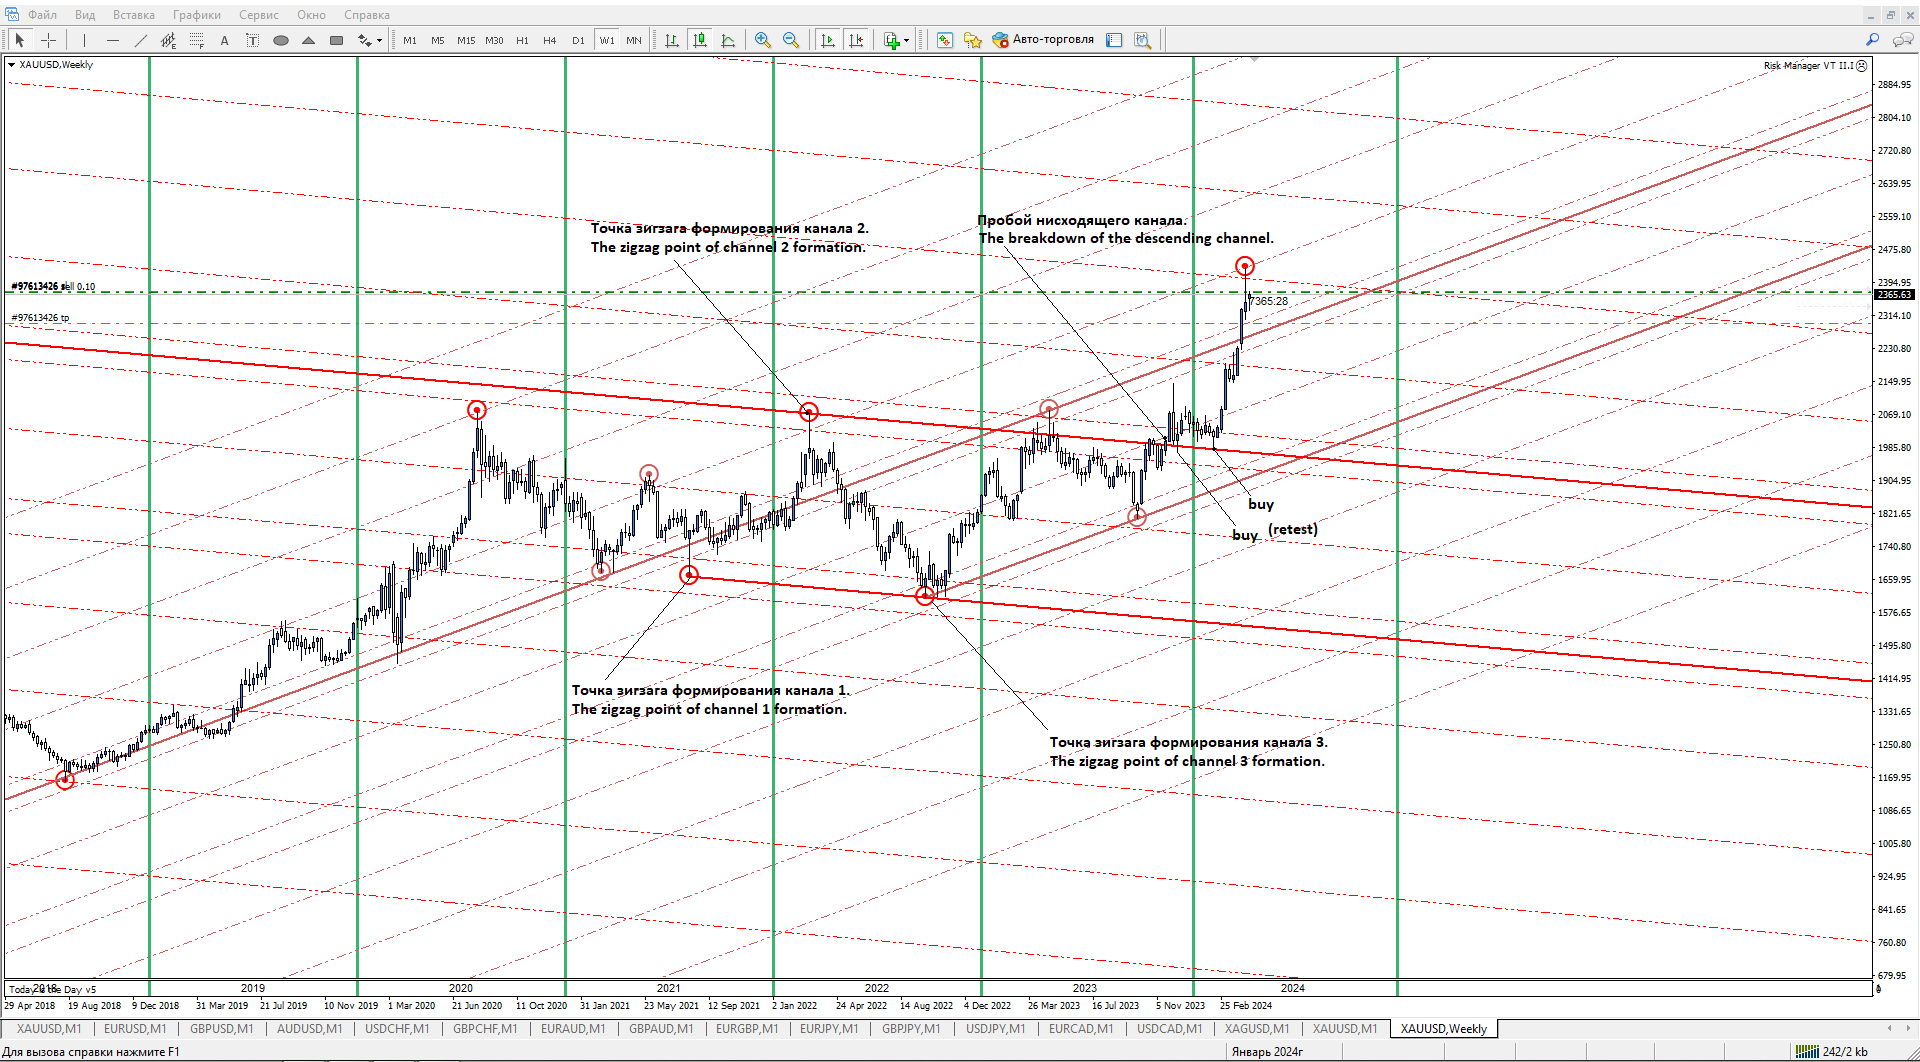
Автоматических рисующихся каналов, в индикаторе – девять. Девять каналов индикатора, со своими индивидуальными расширениями.
Которые строятся по разным параметрам технического, стандартного индикатора "Zigzag". ( "high и low" предыдущих движений цены, за
энное количество свечей или баров графика).
Основные входные параметры индикатора:
- Channel color – цвета каналов, по порядку, названий цвета. От меньшего к большему.
- Width Channel – толщины уровней каналов. От меньшего к большему.
- Style Expansion Channel – стили уровней расширения каналов, при толщине 1 (по умолчанию)., где 1 – пунктир. 2 - точка. 3 – штрих пунктир. 4 – двоеточие пунктир.
Параметры стилей уровней расширения вписываются также через запятую, от меньшего к большему.
- On/Off channel icon – включить, выключить обозначение точек формирования канала high и low - (zigzag).
- Channel building icon – стиль точки формирования канала. По умолчанию: 164. (Таблица стандартных иконок для МТ4, смотри на скрине индикатора).
- Width icon – толщина, размер иконки индикатора. По умолчанию: 3.
- Expansion Channels – включить, выключить расширение каналов.
P.S. Попутного тренда друзья единомышленники и Успехов нам во всём.
Все вопросы и предложения, пишите личными сообщениями автору, или
комментариями к данному индикатору. И мы сделаем нашу с вами работу
трейдера ещё комфортнее, удобнее и прибыльнее. На связи. VT ✔