Fractals Dashboard MT4
- Indikatoren
- Version: 4.40
- Aktualisiert: 7 Mai 2025
- Aktivierungen: 10

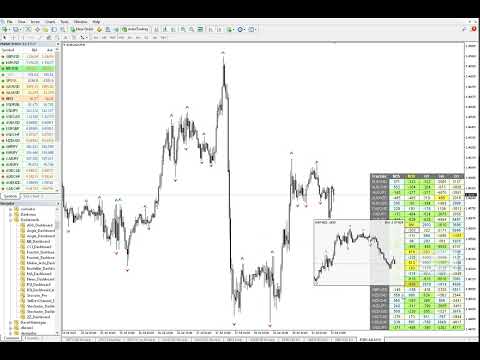
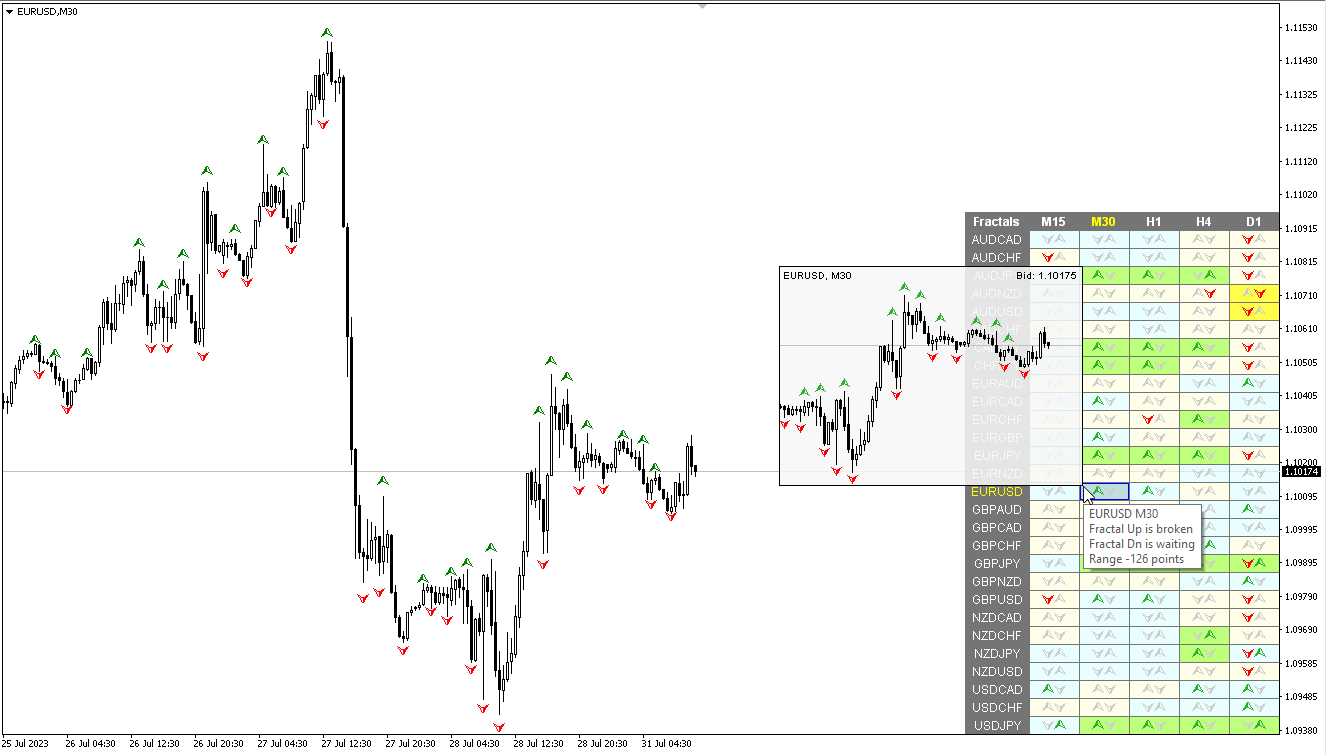
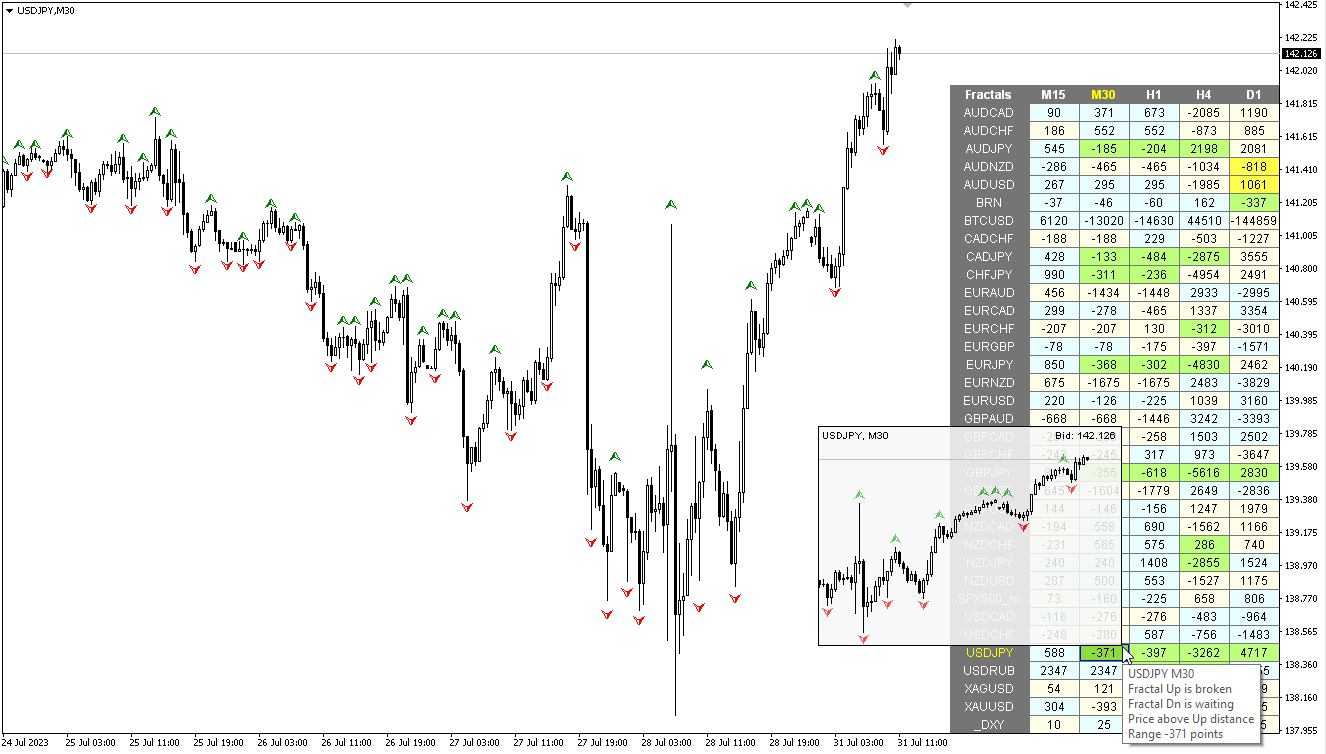
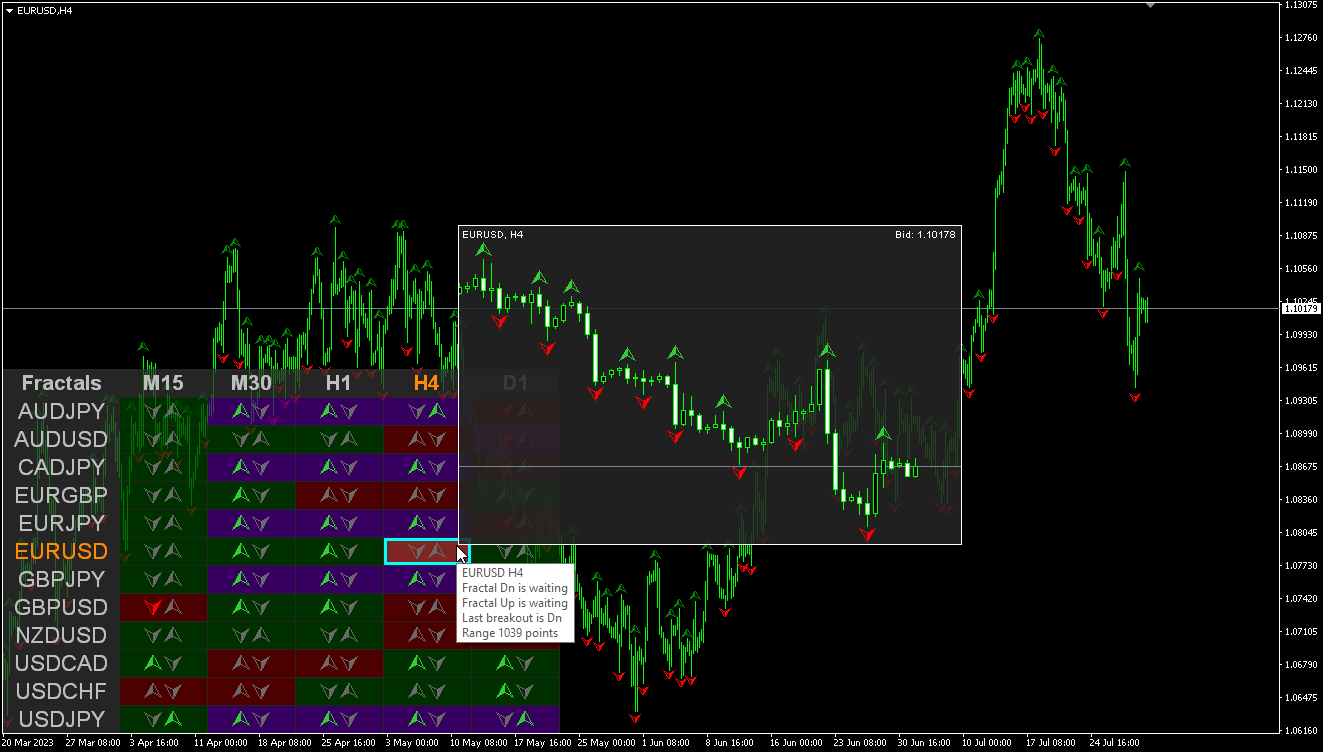
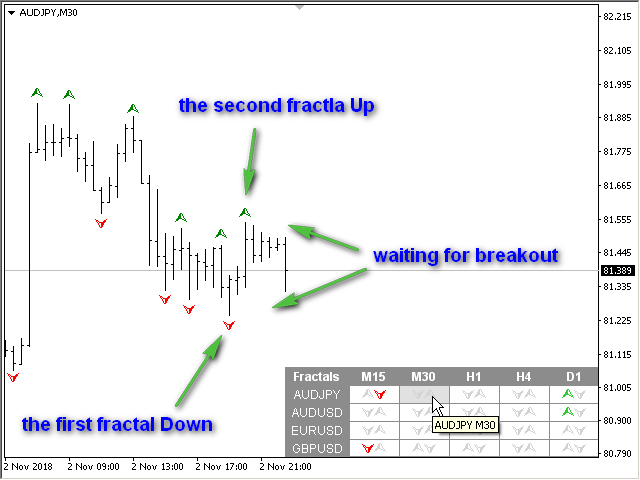
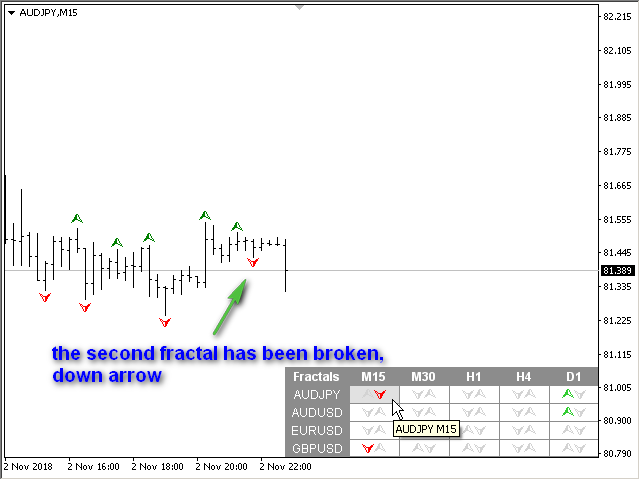
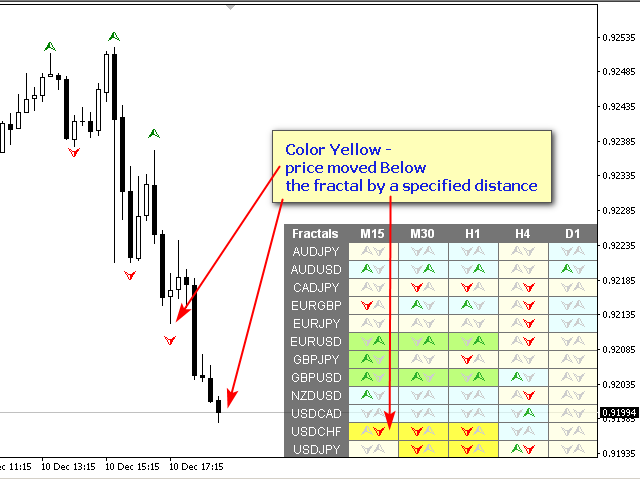
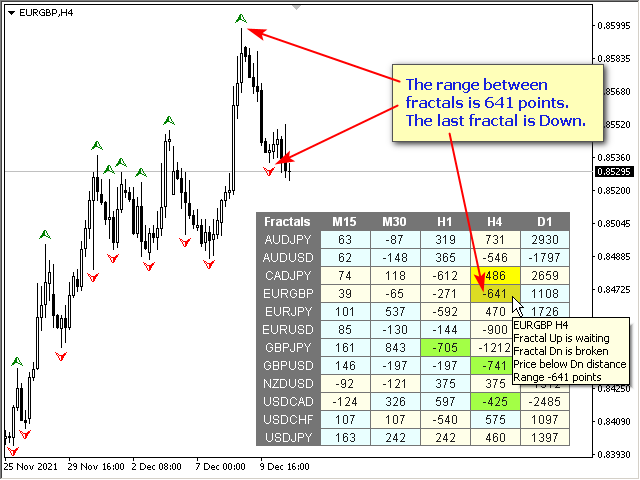
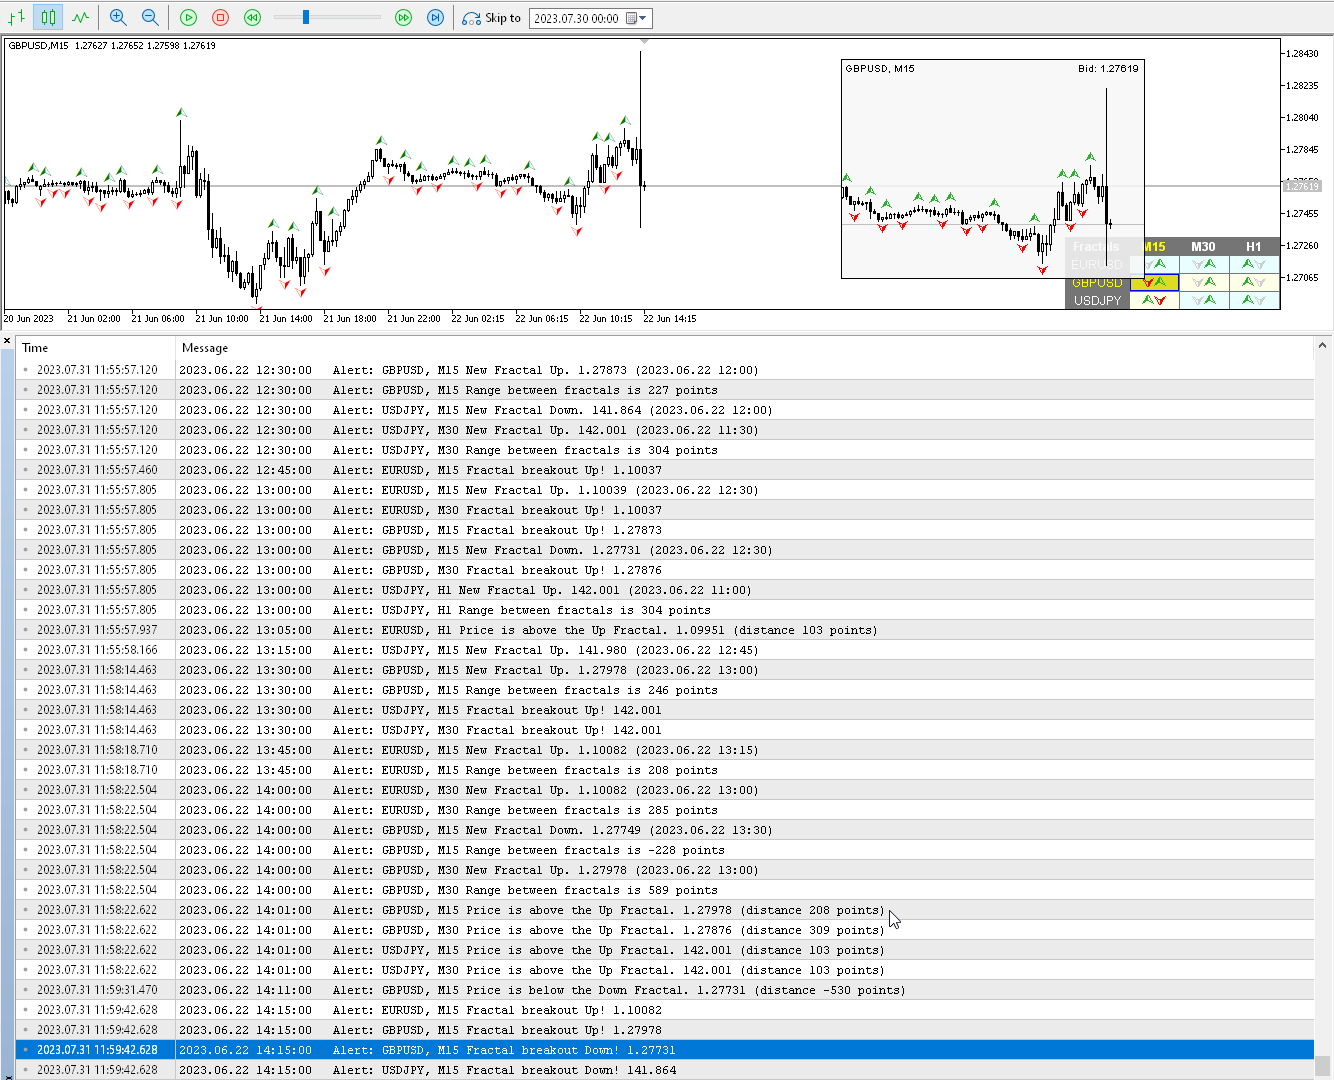
Modifikation des Fractals-Indikators für mehrere Währungen und Zeitrahmen. Zeigt die letzten beiden Fraktale an – ihre Reihenfolge (und welches durchbrochen wurde) oder den Abstand zwischen ihnen. Sie können in den Parametern beliebige Währungen und Zeitrahmen festlegen. Außerdem kann das Panel Benachrichtigungen über den Ausbruch eines Fraktals senden. Durch Klicken auf eine Zelle mit einem Zeitraum werden dieses Symbol und dieser Zeitraum geöffnet. Dies ist der MTF-Scanner.
Die Standardtaste zum Ausblenden des Dashboards aus dem Chart ist „D“.
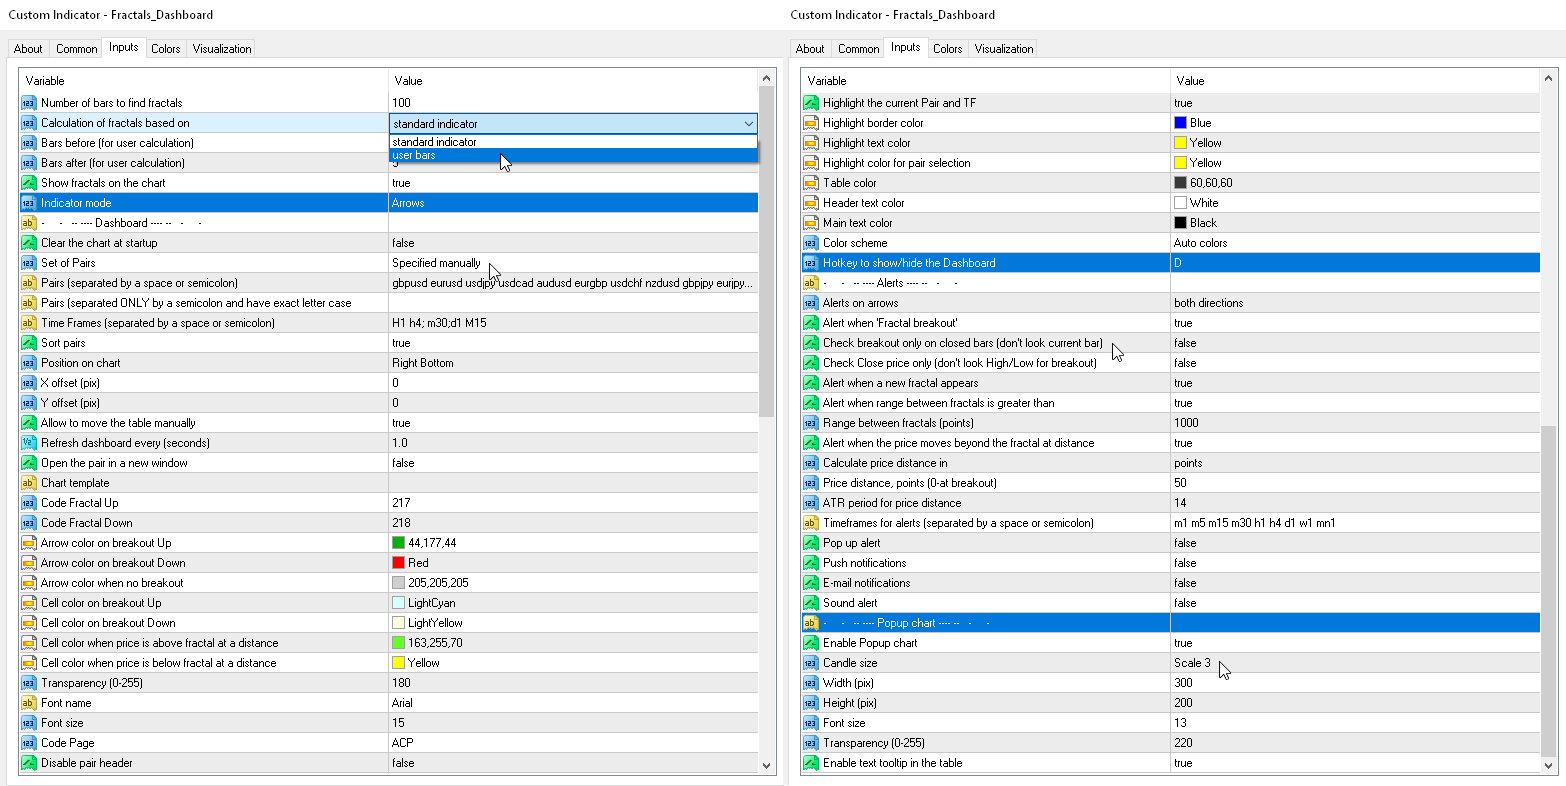
Parameter
Berechnung von Fraktalen basierend auf — Fraktalsuchmodus:— Standardindikator — anhand des Standardindikators;
— Benutzer balken — anhand der Anzahl der benutzerdefinierten Balken (einstellbares Fraktal);
Balken danach (Benutzerberechnung) — die Anzahl der Balken nach dem Fraktal
Indikator-Modus — Anzeigemodi
— Pfeile — die letzten beiden Pfeile der Fraktale;
— Abstand — Abstand zwischen den letzten beiden Fraktalen;
Chart beim Start löschen — den Chart beim Start löschen.
Paare — Liste der Symbole
— Market Watch — Paare aus dem „Market Watch“ des MT.
—Manuell festgelegt — manuell festgelegte Paare in den Parametern „Paare“.
— Aktuelles Paar — nur das aktuelle Paar anzeigen.
Zeitrahmen (durch Leerzeichen oder Semikolon getrennt) — Liste von Zeitrahmen, getrennt durch Leerzeichen oder Semikolons (mehrere Zeitrahmen).
Paare sortieren — Sortierung der Liste der Paare.
Position auf dem Chart – Ecke, an der das Panel auf dem Chart angezeigt werden soll.
X-Versatz (Pixel) – Verschiebung des Fensters entlang der X-Achse;
Y-Versatz (Pixel) — Verschiebung des Fensters entlang der Y-Achse;
Dashboard alle (Sekunden) aktualisieren — Aktualisierungsintervall für alle Paare und Zeitrahmen.
Paar in einem neuen Fenster öffnen — ein Symbol durch Anklicken in einem neuen Chartfenster öffnen.
Chartvorlage – Name der Vorlage für das Chart, falls das Chart in einem neuen Fenster geöffnet wird.
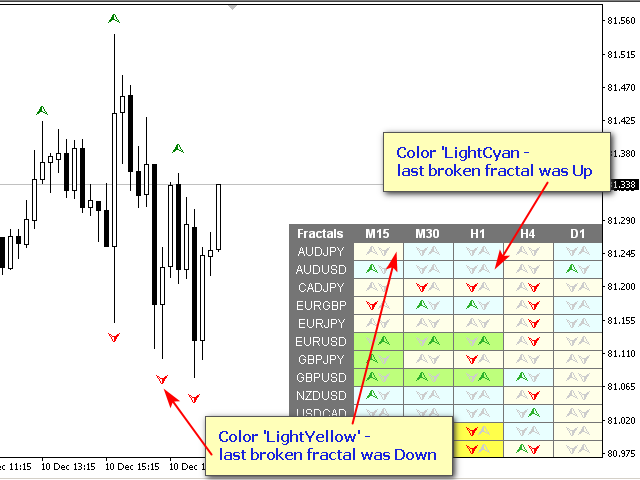
Farbe nach oben — Farbe des Aufwärtspfeils beim Ausbruch.
Farbe nach unten – Farbe des Abwärtspfeils bei Ausbruch.
Farbe „Stop“ – Farbe des Pfeils ohne Durchbruch.
Transparenz (0–255) – Transparenz des Fensters.
Schriftartname – Name der Schriftart.
Schriftgröße — Schriftgröße.
Codeseite — Ändern Sie die Codeseite. Wenn die Zeichen auf dem Bedienfeld falsch angezeigt werden, probieren Sie andere Kodierungen aus (z. B. ACP oder UTF7);
Benachrichtigungen
Benachrichtigung bei Erscheinen eines neuen Fraktals — Senden Sie eine Benachrichtigung, wenn ein neues Fraktal erscheint;
Benachrichtigung bei „Fraktal-Ausbruch“ — Senden Sie eine Benachrichtigung, wenn der Kurs das letzte Fraktal überschritten hat;
Ausbruch nur bei geschlossenen Balken prüfen (aktuellen Balken nicht berücksichtigen) — Prüfen Sie den Fraktal-Ausbruch nur bei geschlossenen Balken;
Nur Schlusskurs prüfen (High/Low für Ausbruch nicht berücksichtigen) — zur Bestimmung des Ausbruchs aus dem Fraktal wird nur der Schlusskurs des Balkens berücksichtigt.
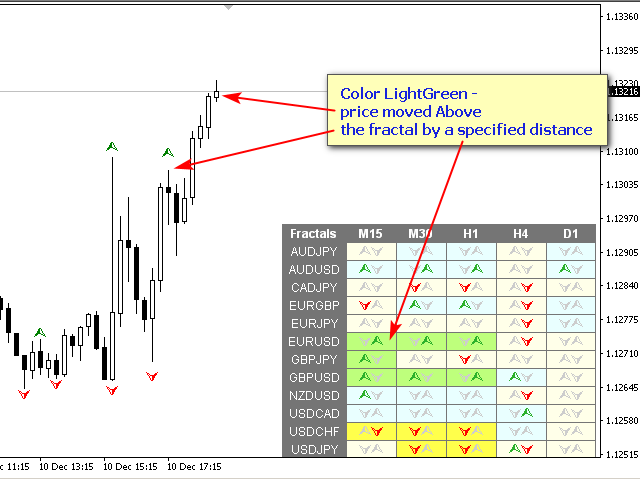
Benachrichtigung, wenn der Abstand zwischen Fraktalen größer ist als — eine Benachrichtigung senden, wenn der Abstand zwischen Fraktalen größer ist als Abstand oder gleich Abstand.
Abstand (Punkte) — Abstand zwischen den Fraktalen.
Zeitrahmen für Benachrichtigungen (durch Leerzeichen oder Semikolon getrennt) — Liste der Zeiträume, für die die Benachrichtigung gesendet wird (durch Leerzeichen oder Semikolon getrennt).
Popup-Benachrichtigung — Popup-Benachrichtigung.
Push-Benachrichtigungen — Push-Benachrichtigung.
E-Mail-Benachrichtigungen — E-Mail-Benachrichtigung.
Akustischer Alarm — akustischer Alarm.
Benachrichtigung bei Erscheinen eines neuen Fraktals — Senden Sie eine Benachrichtigung, wenn ein neues Fraktal erscheint;
Benachrichtigung bei „Fraktal-Ausbruch“ — Senden Sie eine Benachrichtigung, wenn der Kurs das letzte Fraktal überschritten hat;
Ausbruch nur bei geschlossenen Balken prüfen (aktuellen Balken nicht berücksichtigen) — Prüfen Sie den Fraktal-Ausbruch nur bei geschlossenen Balken;
Nur Schlusskurs prüfen (High/Low für Ausbruch nicht berücksichtigen) — zur Bestimmung des Ausbruchs aus dem Fraktal wird nur der Schlusskurs des Balkens berücksichtigt.
Benachrichtigung, wenn der Abstand zwischen Fraktalen größer ist als — eine Benachrichtigung senden, wenn der Abstand zwischen Fraktalen größer ist als Abstand oder gleich Abstand.
Abstand (Punkte) — Abstand zwischen den Fraktalen.
Zeitrahmen für Benachrichtigungen (durch Leerzeichen oder Semikolon getrennt) — Liste der Zeiträume, für die die Benachrichtigung gesendet wird (durch Leerzeichen oder Semikolon getrennt).
Popup-Benachrichtigung — Popup-Benachrichtigung.
Push-Benachrichtigungen — Push-Benachrichtigung.
E-Mail-Benachrichtigungen — E-Mail-Benachrichtigung.
Akustischer Alarm — akustischer Alarm.
Одни из самых лучших продуктов в маркете! Ничего не глючит, не тормозит. Лучшая поддержка от разработчика! Спасибо Вам за ваши труды!