Super trend ATR Indicator

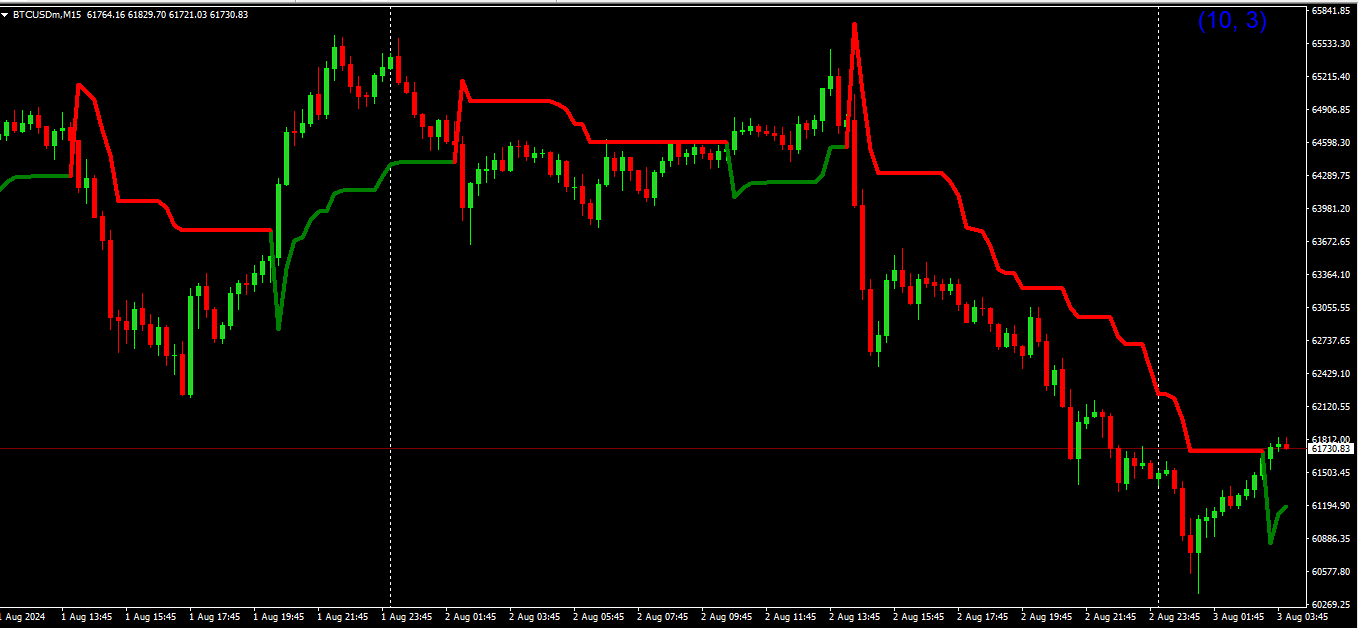
The Supertrend Indicator is a popular technical analysis tool designed to assist traders in identifying market trends.
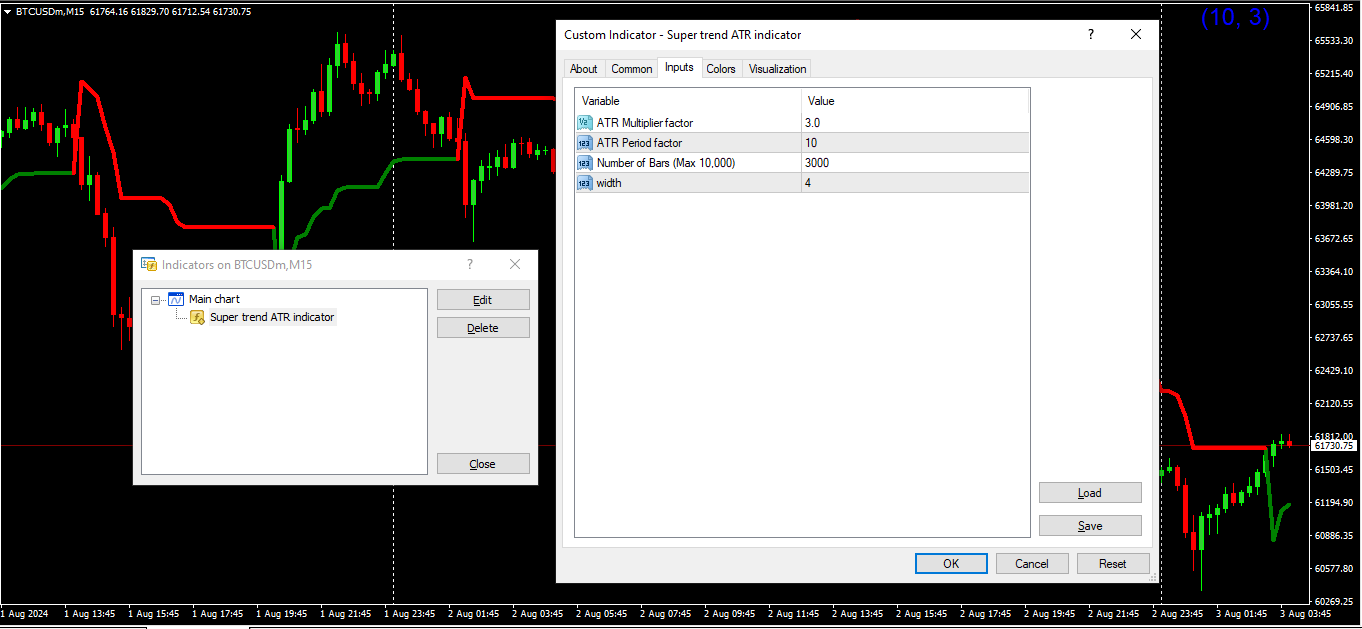
The indicator combines the average true range (ATR) with a multiplier to calculate its value. This value is then added to or subtracted from the asset’s closing price to plot the supertrend line.
The Supertrend Indicator can help identify trends, manage risk, and confirm market tendencies.
The indicator is limited by its lagging nature, is not very flexible, and can send up false signals.
The Super-trend Indicator has become a staple for traders in stocks, currencies, and commodities for its ability to identify and follow market trends.
Önerilen ürünler
Free automatic Fibonacci is an indicator that automatically plots a Fibonacci retracement based on the number of bars you select on the BarsToScan setting in the indicator. The Fibonacci is automatically updated in real time as new highest and lowest values appears amongst the selected bars. You can select which level values to be displayed in the indicator settings. You can also select the color of the levels thus enabling the trader to be able to attach the indicator several times with differe
FREE
-- Basit ama etkili. Tersine Dönüş Göstergesi - Nedir? SuperTrend mantığını üstel eğri teknolojisiyle birleştiren, trendi takip eden bir üst katman göstergesidir. Trend yönünü algılar, grafikte dinamik bir kanal çizer ve trend tersine döndüğünde gerçek zamanlı uyarılar gönderir. Nasıl çalışır? Gösterge, ATR ve SuperTrend faktörünü kullanarak üstel bir temel çizgi hesaplar. Fiyat bu temel çizginin üzerinde veya altında kapandığında, trendin tersine döndüğü teyit edilir. Yeşil ok, AL trendinin
FREE
Discover the power of precision and efficiency in your trading with the " Super Auto Fibonacci " MT4 indicator. This cutting-edge tool is meticulously designed to enhance your technical analysis, providing you with invaluable insights to make informed trading decisions. Key Features: Automated Fibonacci Analysis: Say goodbye to the hassle of manual Fibonacci retracement and extension drawing. "Super Auto Fibonacci" instantly identifies and plots Fibonacci levels on your MT4 chart, saving you tim
FREE
Description: The indicator measures, through the zigzag indicator, the levels of trend or correction. It shows in the chart the levels of each low or high detected. KEY LINKS:   How to Install  –  Frequent Questions  -  All Products  How is this indicator useful? This indicator determines, depending on Zigzag parameter if a trend is beginning, developing, or ending This indicator determines the direction of the trend Components Levels as positive or negative numbers, depending on the direction
FREE
PZ Three Drives
PZ TRADING SLU
5 (2)
This indicator finds Three Drives patterns. The Three Drives pattern is a 6-point reversal pattern characterised by a series of higher highs or lower lows that complete at a 127% or 161.8% Fibonacci extension. It signals that the market is exhausted and a reversal can happen. [ Installation Guide | Update Guide | Troubleshooting | FAQ | All Products ] Customizable pattern sizes Customizable colors and sizes Customizable breakout periods Customizable 1-2-3 and 0-A-B ratios It implements visual/s
FREE
Rainbow MT4 is a technical indicator based on Moving average with period 34 and very easy to use. When price crosses above MA and MA changes color to green, it’s a signal to buy. When price crosses below MA and MA changes color to red, it’s a signal to sell. The Expert advisor ( Rainbow EA MT4) based on Rainbow MT4 indicator, as you can see in the short video below is now available here .
FREE
SuperTrend V
Muhammad Hassaan
*This is TradingView indicator converted to mql4* The SuperTrend V indicator is a popular technical analysis tool used to identify trends and potential trend reversals in financial markets. It is based on the concept of the SuperTrend indicator but incorporates additional features and variations. The SuperTrend V indicator uses a combination of price action and volatility to determine the trend direction and generate trading signals. Here are the key components and features of the indicator: Ca
Aroon Classic
Etsushi Ishizuka
Aroon Classic Göstergesinin Genel Bakışı Aroon Classic göstergesi, bir grafikte trendin oluşumunu ve devamlılığını nicel olarak belirleyen teknik bir araçtır. Trend gücünü ve dönüş noktalarını 0–100 aralığında göstermek için “Aroon Up” ve “Aroon Down” olmak üzere iki çizgi kullanır. Yüksek bir Aroon Up değeri güçlü bir yükseliş trendini, yüksek bir Aroon Down değeri ise güçlü bir düşüş trendini işaret eder. Öne Çıkan Özellikler Trend başlangıcını ve dönüşünü görsel olarak ayırt eder Hesaplama pe
FREE
LordAutoFibonnaci
Igor Pereira Calil
5 (2)
Lord Auto Fibonnaci is a free indicator for Meta Trader, in order to show the most famous chart in the financial market known as "Fibonnaci". As we can see in the images below, the fibonnaci table will automatically analyze the graph for you, with trend factors through percentage, almost infallible use, you can always work when the percentage is low or high, start shopping and sales on time, great for analyzing entries! In the images below we can see an example in gold in H4, where we are at
FREE
Trendline indicator
David Muriithi
2 (1)
Are you tired of drawing trendlines every time you're analyzing charts? Or perhaps you would like more consistency in your technical analysis. Then this is for you. This indicator will draw trend lines automatically when dropped on a chart. How it works Works similar to standard deviation channel found on mt4 and mt5. It has 2 parameters: 1. Starting Bar 2. Number of bars for calculation The   starting bar   is the bar which drawing of the trend lines will begin, while the   number of bars for c
FREE
Fiyat Dalga Modeli   MT4 --(ABCD Modeli)--   hoş geldiniz     ABCD modeli, teknik analiz dünyasında güçlü ve yaygın olarak kullanılan bir ticaret modelidir. Tüccarların piyasadaki potansiyel alım ve satım fırsatlarını belirlemek için kullandıkları uyumlu bir fiyat modelidir. ABCD modeliyle, tüccarlar potansiyel fiyat hareketlerini tahmin edebilir ve alım satımlara ne zaman girip çıkacakları konusunda bilinçli kararlar verebilir. EA Sürümü :   Price Wave EA MT4 MT5 sürümü:   Price Wave Patter
FREE
Elliott Wave Theory
Ashkan Hazegh Nikrou
MetaTrader 4 için Elliott Dalga Teorisi Göstergesi Elliott Dalga Teorisi'ne dayalı gösterge, Forex piyasasının profesyonel kavramlarından biri temel alınarak tasarlanmıştır. Bu gösterge, piyasa yapısını dalga formunda çizer ve 1'den 5'e kadar yükselen ve düşen dalgaları numaralandırır. Kullanıcılar dalga yapısını görselleştirir ve yeni bir numara oluştuğunda bildirim alabilir. İki tip dalga desteklenmektedir: ana dalga ve alt dalga. Her dalga farklı renklerle gösterilebilir veya bağımsız olarak
FREE
Smart FVG Indicator MT4 – MetaTrader 4 için Gelişmiş Fair Value Gap Tespiti Smart FVG Indicator MT4, MetaTrader 4 grafikleri üzerinde Fair Value Gap (FVG) alanlarını profesyonel düzeyde tespit eder, izler ve uyarılar üretir. ATR tabanlı filtreleme ile piyasa yapısını dikkate alan akıllı bir algoritmayı birleştirerek gürültüyü azaltır, likiditeye uyum sağlar ve sadece en önemli dengesizlikleri bırakarak daha net işlem kararları almanıza yardımcı olur. Başlıca avantajlar Doğru FVG tespiti: Sadec
FREE
LineBreakMT4
Nattadecha Tangpakinwat
Key Features: Type of Indicator: Line Break Chart Indicator Usage: Identifying trend reversals and potential market turning points. Input Parameters: The primary input parameter is 'Lines_Break,' which represents the number of lines the price needs to move to create a new line in the opposite direction. How it works: The indicator draws green and red histogram bars to represent the line break chart. Green bars indicate an upward trend, and red bars indicate a downward trend. The indicator calcul
FREE
ENGLISH DESCRIPTION (MQL5 Standard Optimized) Product Name: TempestLightning – Elliott Wave Pro (MT4) [Subtitle: ZigZag Wave 3 Hunter | Market Health Monitor | USD Risk Logic] Introduction TempestLightning is a professional trading system designed to automate the complex Elliott Wave theory. Instead of guessing wave counts, this EA uses a precision ZigZag algorithm to identify the classic 1-2-3 structure and targets the highly profitable Wave 3 impulse. Stacked with a multi-factor filter engine
FREE
Fibonacci SR Indicator This indicator creates support and resistance lines. This indicator is based on Fibonacci Retracement and Extension levels. It will consider many combinations of the Fibonacci levels and draw support/resistance lines based on these. This indicator uses tops and bottoms drawn by the ZigZag indicator in its calculations. The ZigZag can also be drawn on the chart, if necessary. The indicator considers many combinations of past reversal points and Fibonacci ratio levels, and w
FREE
Sentinel Arrow
Dmytro Kasianov
1 (1)
Sentinel Arrow Temel Özellikler: ⊗Trendleri, dönüşleri ve momentum değişikliklerini hızlı ve doğru bir şekilde belirlemek için özel bir algoritma. ⊗Profesyonel kullanım için tasarlanmış olup, gecikmeleri veya hatalı güncellemeleri ortadan kaldıran güçlü bir sinyal mantığına sahiptir. ⊗Çeşitli zaman dilimleri için uygundur. ⊗Geçmiş sinyalleri yeniden çizmez, silmez veya değiştirmez. ⊗Tüm AL ve SAT sinyalleri mum çubuğunun kendisinde üretilir ve sabit kalır. ⊗Gerçek alım satımda yeniden çizim yo
FREE
Price Retest
Suvashish Halder
4.88 (8)
Introducing our exciting new Price Retest indicator! Get instant alerts when the price retests, giving you a powerful edge in your trading strategy. Remember to do your own analysis before making any moves in the market. MT5 Version -  https://www.mql5.com/en/market/product/118159/ Join To Learn Market Depth -   https://www.mql5.com/en/channels/suvashishfx Here’s a detailed explanation of how the Price Retest indicator works, its components, and how you can incorporate it into your trading str
FREE
The free version of the Hi Low Last Day MT4 indicator . The Hi Low Levels Last Day MT4 indicator shows the high and low of the last trading day . The ability to change the color of the lines is available . Try the full version of the Hi Low Last Day MT4 indicator , in which additional indicator features are available : Displaying the minimum and maximum of the second last day Displaying the minimum and maximum of the previous week Sound alert when crossing max . and min . levels Selecting an arb
FREE
FRM Half Trend
Noiros Tech
3.5 (2)
YOU CAN NOW DOWNLOAD FREE VERSIONS OF OUR PAID INDICATORS . IT'S OUR WAY OF GIVING BACK TO THE COMMUNITY ! >>>    GO HERE TO DOWNLOAD   The system is a free open source pine script originally published on TradingView by everget   . It was converted to Mt4 by Forex Robot Makers. This system is a  popular trend indicator based on ATR ( Average True Range ) , Moving Averages and the Donchian channel . System BackGround ATR The average true range is an indicator of the price volatility of an asse
FREE
Renko Chart with Moving Average. Classic Renko charts idea. It is protted on main chart and Moving Average can be applied. Prices for bars are used from a lower timeframe. Parameters: BarsBack - how many bars of lower timeframe to use. If value is zero than it will use all available bars. LTF - lower timeframe. BrickSize - Renko bar in points. BullishColor - color for bull candle. BearishColor - color for bear candle. HideLineChart - if this value is true the line chart when be hidden when sele
FREE
Tipu Heikin Ashi Panel
Kaleem Haider
4.56 (18)
Tipu Heikin-Ashi Panel is the modified version of the original Heiken Ashi indicator published by MetaQuotes here . A professional version of this indicator is available here . Features An easy to use Panel that shows the Heiken Ashi trend of selected timeframe. Customizable Buy/Sell alerts, push alerts, email alerts, or visual on-screen alerts. Customizable Panel. The panel can be moved to any place on the chart or minimized to allow more space. Heikin means "the average", and Ashi means "foot
FREE
PZ Tick Chart
PZ TRADING SLU
4.5 (2)
This indicator displays a complete tick chart with two optional moving averages, and makes paying attention to sub-m1 price data really easy. [ Installation Guide | Update Guide | Troubleshooting | FAQ | All Products ] Identify price spikes easily The blue line is the ask price The red line is the bid price The indicator doesn't lose tick data when reloaded It implements two optional moving averages The indicator is non-repainting Input Parameters Display Moving Averages: Display or hide the mo
FREE
Follow The Line
Oliver Gideon Amofa Appiah
3.94 (16)
FOLLOW THE LINE GET THE FULL VERSION HERE: https://www.mql5.com/en/market/product/36024 This indicator obeys the popular maxim that: "THE TREND IS YOUR FRIEND" It paints a GREEN line for BUY and also paints a RED line for SELL.  It gives alarms and alerts of all kinds. IT DOES NOT REPAINT and can be used for all currency pairs and timeframes. Yes, as easy and simple as that. Even a newbie can use it to make great and reliable trades. NB: For best results, get my other premium indicators for more
FREE
SX Supply Demand Zones accurately identifies and draws high-probability Supply and Demand zones using a sophisticated algorithm. Unlike traditional indicators that clutter your chart, this indicator is designed with a focus on performance and a clean user experience. New Unique Feature: Interactive Legend System What truly sets this indicator apart from everything else is the Interactive Control Legend. You have a professional dashboard directly on your chart that allows you to: Show/Hide: Ins
FREE
MACD Trend Follower
Mohamed Amine Talbi
4 (3)
The "MACD Trend Follower" is an indicator based on the MACD oscillator. It serves to spot the trend direction by giving it a fixed color until the trend changes (the trend direction colors are customizable). The default MACD settings for the indicator has been changed to adapt to the fast moving Forex market, but they can be changed to suit the trader. Recommended settings for the indicator : - MACD Fast EMA : 8 Periods. - MACD Slow EMA : 13 Periods. - MACD SMA : 5 Periods. Indicator inputs :
FREE
MACD Crossover Arrows & Alert is a MT4 (MetaTrader 4) indicator and it can be used with any forex trading systems / strategies for additional confirmation of trading entries or exits on the stocks and currencies market. This mt4 indicator provides a   BUY signal   if the MACD main line crosses above the MACD   signal  line . It also displays a   Sell signal   if the   MACD main line crosses  below the MACD   signal  line . STRATEGY Traders can use the MACD signal alerts from a higher time frame
FREE
This scanner shows the trend values of the well known indicator SuperTrend for up to 30 instruments and 8 time frames. You can get alerts via MT4, Email and Push-Notification as soon as the direction of the trend changes. This is the FREE version of the indicator: SuperTrend Scanner The free version works only on EURUSD and GBPUSD! Important Information How you can maximize the potential of the scanner, please read here: www.mql5.com/en/blogs/post/718074 With the following FREE indicator you c
FREE
QualifiedEngulfing
Ashkan Hazegh Nikrou
QualifiedEngulfing, ProEngulfing Göstergesi'nin ücretsiz sürümüdür. ProEngulfing , Advance Engulf Göstergesi'nin ücretli sürümüdür. İndirin buradan. ProEngulfing'in ücretsiz ve ücretli sürümleri arasındaki fark nedir? Ücretsiz sürümünde bir gün içinde bir sinyal kısıtlaması bulunmaktadır. QualifiedEngulfing Tanıtımı - MT4 İçin Profesyonel Engulf Deseni Göstergeniz QualifiedEngulfing ile precision gücünü serbest bırakın; forex piyasasındaki nitelikli engulf desenlerini belirlemek ve vurgulamak i
FREE
HMA Trend
Pavel Zamoshnikov
4.54 (70)
A trend indicator based on the Hull Moving Average (HMA) with two periods. The Hull Moving Average is an improved variant of the moving average, which shows the moment of trend reversal quite accurately. It is often used as a signal filter. Combination of two types of Hull Moving Averages makes a better use of these advantages: HMA with a slow period identifies the trend, while HMA with a fast period determines the short-term movements and signals in the trend direction. Features The movement d
FREE
Bu ürünün alıcıları ayrıca şunları da satın alıyor
Gann Made Easy
Oleg Rodin
4.83 (157)
Gann Made Easy , bay teorisini kullanarak ticaretin en iyi ilkelerine dayanan, profesyonel ve kullanımı kolay bir Forex ticaret sistemidir. WD Gann. Gösterge, Zararı Durdur ve Kâr Al Seviyeleri dahil olmak üzere doğru SATIN AL ve SAT sinyalleri sağlar. PUSH bildirimlerini kullanarak hareket halindeyken bile işlem yapabilirsiniz. Satın alma işleminden sonra, alım satım talimatlarını ve harika ek göstergeleri ücretsiz olarak almak için lütfen benimle iletişime geçin! Muhtemelen Gann ticaret yöntem
Market Makers
Mohamed Hassan
5 (3)
After purchase, contact me privately to receive 7 days of free testing with EA Forex Proton. This advanced MT4 trading robot automatically executes signals from any MT4 indicator, including Market Makers. The latest version also includes AI integration, allowing each trade signal to be analyzed using Artificial Intelligence. Market Makers is a powerful price action trading system designed to identify high-probability Buy and Sell opportunities based on market momentum, volatility, and price po
Scalper Inside PRO
Alexey Minkov
4.74 (69)
An exclusive indicator that utilizes an innovative algorithm to swiftly and accurately determine the market trend. The indicator automatically calculates opening, closing, and profit levels, providing detailed trading statistics. With these features, you can choose the most appropriate trading instrument for the current market conditions. Additionally, you can easily integrate your own arrow indicators into Scalper Inside Pro to quickly evaluate their statistics and profitability. Scalper Inside
Trend Screener
STE S.S.COMPANY
4.79 (95)
Trend Göstergesi, Trend Alım Satım ve Filtreleme için Çığır Açan Benzersiz Çözüm, Tüm Önemli Trend Özellikleriyle Tek Bir Araç İçinde Yerleştirildi! Forex, emtialar, kripto para birimleri, endeksler ve hisse senetleri gibi tüm sembollerde/araçlarda kullanılabilen %100 yeniden boyamayan çoklu zaman çerçevesi ve Çoklu para birimi göstergesidir. SINIRLI SÜRELİ TEKLİF: Destek ve Direnç Tarama Göstergesi sadece 50$ ve ömür boyu mevcuttur. (Orijinal fiyat 250$) (teklif uzatıldı) Trend Screener, grafik
Atomic Analyst
Issam Kassas
5 (4)
Öncelikle belirtmek gerekir ki bu Ticaret Göstergesi Yeniden Çizim Yapmaz, Gecikmez ve Gecikme Göstermez, bu da hem manuel hem de robot ticareti için ideal hale getirir. Kullanıcı kılavuzu: ayarlar, girişler ve strateji. Atom Analisti, Piyasada Daha İyi Bir Avantaj Bulmak İçin Fiyatın Gücünü ve Momentumunu Kullanan PA Fiyat Hareketi Göstergesidir. Gürültüleri ve Yanlış Sinyalleri Kaldırmaya ve Ticaret Potansiyelini Artırmaya Yardımcı Olan Gelişmiş Filtrelerle Donatılmıştır. Birden fazla katman
M1 Sniper
Oleg Rodin
5 (20)
M1 SNIPER kullanımı kolay bir işlem göstergesi sistemidir. M1 zaman dilimi için tasarlanmış bir ok göstergesidir. Gösterge, M1 zaman diliminde scalping için bağımsız bir sistem olarak kullanılabilir ve mevcut işlem sisteminizin bir parçası olarak kullanılabilir. Bu işlem sistemi özellikle M1'de işlem yapmak için tasarlanmış olsa da, diğer zaman dilimleriyle de kullanılabilir. Başlangıçta bu yöntemi XAUUSD ve BTCUSD ticareti için tasarladım. Ancak bu yöntemi diğer piyasalarda işlem yaparken de ya
" Dynamic Scalper System " göstergesi, trend dalgaları içinde işlem yapmak için scalping yöntemi için tasarlanmıştır. Başlıca döviz çiftleri ve altın üzerinde test edilmiştir, diğer işlem araçlarıyla uyumluluğu mümkündür. Ek fiyat hareketi desteğiyle trend boyunca pozisyonların kısa vadeli açılması için sinyaller sağlar. Göstergenin prensibi. Büyük oklar trend yönünü belirler. Küçük oklar şeklinde scalping için sinyaller üreten bir algoritma trend dalgaları içinde çalışır. Kırmızı oklar yüksel
PRO Renko Sistemi, RENKO grafikleri ticareti için özel olarak tasarlanmış son derece hassas bir ticaret sistemidir. Bu, çeşitli ticaret araçlarına uygulanabilen evrensel bir sistemdir. Sistemi etkin piyasa sana doğru ters sinyallerine erişim hakkı denilen ses nötralize eder. Göstergenin kullanımı çok kolaydır ve sinyal üretiminden sorumlu tek bir parametreye sahiptir. Aracı, seçtiğiniz herhangi bir ticaret aracına ve renko çubuğunun boyutuna kolayca uyarlayabilirsiniz. Yazılımımla karlı bir
Advanced Supply Demand
Bernhard Schweigert
4.91 (299)
Özel Ticaret –%40 İndirim Yeni Başlayanlar veya Uzman Yatırımcılar İçin En İyi Çözüm! Bu gösterge, bir dizi özel özellik ve yeni bir formül içerdiği için benzersiz, yüksek kaliteli ve uygun fiyatlı bir işlem aracıdır. Bu güncelleme ile çift zaman dilimi bölgeleri gösterebileceksiniz. Sadece daha yüksek bir zaman dilimini değil, hem grafik zaman dilimini hem de daha yüksek zaman dilimini gösterebileceksiniz: İÇ İÇE GEÇMİŞ BÖLGELER GÖSTERİYOR. Tüm Arz Talep yatırımcıları buna bayılacak. :) Önem
Quantum Breakout Indicator PRO
Bogdan Ion Puscasu
4.96 (26)
Tanıtım       Quantum Breakout PRO   , Breakout Bölgeleri ile ticaret yapma şeklinizi değiştiren çığır açan MQL5 Göstergesi! 13 yılı aşkın ticaret deneyimine sahip deneyimli tüccarlardan oluşan bir ekip tarafından geliştirilen   Quantum Breakout PRO   , yenilikçi ve dinamik koparma bölgesi stratejisiyle ticaret yolculuğunuzu yeni zirvelere taşımak için tasarlanmıştır. Kuantum Breakout Göstergesi, size 5 kar hedefi bölgesi ile kırılma bölgelerinde sinyal okları ve kırılma kutusuna dayalı olara
Currency Strength Exotics
Bernhard Schweigert
4.88 (33)
ŞU ANDA %20 INDIRIMLI! Herhangi bir Acemi veya Uzman Tüccar için En İyi Çözüm! Bu Gösterge, Egzotik Çiftler Emtialar, Endeksler veya Vadeli İşlemler gibi herhangi bir sembol için para birimi gücünü göstermek için uzmanlaşmıştır. Türünün ilk örneğidir, Altın, Gümüş, Petrol, DAX, US30, MXN, TRY, CNH vb. gerçek para birimi gücünü göstermek için 9. satıra herhangi bir sembol eklenebilir. Bu benzersiz, yüksek kaliteli ve uygun fiyatlı bir ticaret aracıdır çünkü bir dizi tescilli özelliği ve yeni b
Route Lines Prices - fiyat yönlerini bulmak için tasarlanmış bir göstergedir. Basit arayüzü, fiyat davranışı ve gelecekteki yön hesaplamaları için birden fazla algoritma içerir. Bu algoritmalar, kullanılan zaman dilimlerine bağlı olarak volatilite hesaplamalarını ve fiyat düzeltmesini içerir. Gösterge, " Calculating price values " değerini değiştirmek için tek bir parametreye sahiptir. Varsayılan 1 değeri, dengeli bir otomatik hesaplama sağlar, bu da göstergeyi manuel olarak yapılandırmadan kul
MT5 Versiyonu Burada Mevcut: https://www.mql5.com/en/market/product/50048 Telegram Kanalı ve Grubu: https://t.me/bluedigitsfx V.I.P Grup Erişimi: Ücretli ürünlerimizden herhangi birinin ödeme kanıtını özel mesaj ile gönderin Önerilen Broker: https://bit.ly/BlueDigitsFxStarTrader BlueDigitsFx Easy 123 System — MT4 için Güçlü Tersine Dönüş ve Kopuş Tespiti Piyasa yapısındaki değişimleri, kopuşları ve trend dönüşlerini kolayca tespit etmek için tasarlanmış, baştan sona non-repaint (yeniden çiz
CRT Multi-Timeframe Market Structure & Liquidity Sweep Indicator Non-Repainting | Multi-Asset | MT5 Version Available MT5 Version:   https://www.mql5.com/en/market/product/162075 Full User Guide — explains what each feature does and why:   https://www.mql5.com/en/blogs/post/767525 Quick Start User Guide  — explains how to configure and in what order:  https://www.mql5.com/en/blogs/post/767540 Indicator Overview CRT Ghost Candle HTF Fractal is a complete institutional-grade market structure too
Trend Lines PRO
Roman Podpora
5 (1)
TREND ÇİZGİLERİ PRO     Piyasanın gerçek yön değişimini anlamaya yardımcı olur. Gösterge, gerçek trend dönüşlerini ve büyük oyuncuların piyasaya yeniden girdiği noktaları gösterir. Anlıyorsun     BOS hatları  Daha yüksek zaman dilimlerindeki trend değişiklikleri ve önemli seviyeler, karmaşık ayarlar veya gereksiz gürültü olmadan gösterilir. Sinyaller yeniden çizilmez ve çubuk kapandıktan sonra grafikte kalır. VERSION MT 5     -    RFI LEVELS PRO  göstergesiyle birlikte kullanıldığında maksimum p
Scalper Vault
Oleg Rodin
5 (36)
Scalper Vault , başarılı bir scalping için ihtiyacınız olan her şeyi size sağlayan profesyonel bir scalping sistemidir. Bu gösterge, forex ve ikili opsiyon tüccarları tarafından kullanılabilecek eksiksiz bir ticaret sistemidir. Önerilen zaman çerçevesi M5'tir. Sistem size trend yönünde doğru ok sinyalleri sağlar. Ayrıca size üst ve alt sinyaller ve Gann piyasa seviyeleri sağlar. Göstergeler, PUSH bildirimleri dahil her türlü uyarıyı sağlar. Göstergeyi satın aldıktan sonra lütfen benimle iletişim
Şu anda %40 İNDİRİMLİ! Herhangi bir Acemi veya Uzman Tüccar için En İyi Çözüm! Bu gösterge paneli yazılımı 28 döviz çifti üzerinde çalışıyor. Ana göstergelerimizden 2'sine (Gelişmiş Para Birimi Gücü 28 ve Gelişmiş Para Birimi Dürtüsü) dayanmaktadır. Tüm Forex piyasasına harika bir genel bakış sağlar. Gelişmiş Para Birimi Gücü değerlerini, para birimi hareket hızını ve tüm (9) zaman dilimlerinde 28 Forex çifti için sinyalleri gösterir. Trendleri ve / veya scalping fırsatlarını belirlemek için
Currency Strength Wizard , başarılı ticaret için size hepsi bir arada çözüm sağlayan çok güçlü bir göstergedir. Gösterge, birden çok zaman dilimindeki tüm para birimlerinin verilerini kullanarak şu veya bu forex çiftinin gücünü hesaplar. Bu veriler, şu veya bu para biriminin gücünü görmek için kullanabileceğiniz, kullanımı kolay para birimi endeksi ve para birimi güç hatları biçiminde temsil edilir. İhtiyacınız olan tek şey, işlem yapmak istediğiniz tabloya göstergeyi eklemektir ve gösterge size
Pips Generator
Oleg Rodin
4.6 (10)
Apollo Pips Generator , trend yönünde sinyaller veren göstergedir. Gösterge, birden fazla giriş noktası sağlar, böylece her zaman kâr etmek için bir ticaret fırsatı bulabilirsiniz. Ekran görüntülerine dikkat edin. Ekran görüntüleri, Pips Generator aracını, kanal tarafından üstleri ve altları gösteren yıldız sinyalleriyle temsil edilen diğer aracımla birlikte gösterir. Bu kombinasyon, sistemi nasıl uygulayabileceğiniz konusunda size birçok yol sunar. Satın aldıktan sonra İKİNCİ GÖSTERGEMİ ÜCRETSİ
Auto Optimized Parabolic RSI: Gelişmiş 3D Momentum Motoru Çoğu perakende indikatörü, piyasa volatilitesi değiştiği an çöken statik girdilere dayandığı için başarısız olur. Auto Optimized Parabolic RSI, kendi matematiksel avantajını sürekli olarak yeniden hesaplayarak "indikatör körelmesi" (indicator decay) sorununu çözer ve kurumsal düzeyde kantitatif adaptasyonu doğrudan MT5 terminalinize getirir. Temel Avantaj: Özel Bellek İçi (In-Memory) 3D Optimizasyon   Standart otomatik optimize ediciler,
Super Signal Market Slayer Repaint Yok | Yüksek Hassasiyet | Çok Piyasaya Uyumlu Akıllı Trend Göstergesi Trading’de asıl zorluk emir vermek değil, piyasa gürültüsü içinde trendin ne zaman başladığını net şekilde görmektir. Market Slayer bu amaçla geliştirildi. Bu gösterge, gün içi işlemler için tasarlanmış repaint yapmayan akıllı bir indikatördür. Çok katmanlı onay ve trend filtreleme sayesinde yalnızca kritik anlarda net ve güvenilir Buy / Sell sinyalleri üretir. Temel Avantajlar Repaint yok B
Super Reversal Indicator with Alert Genel Bakış Super Reversal Indicator with Alert, stokastik momentum, arz ve talep bölgeleri ve fiyat reddi sinyallerini birleştirerek yüksek olasılıklı piyasa dönüş noktalarını belirlemek için tasarlanmış çoklu zaman dilimli bir işlem aracıdır. Bu gösterge, net görsel sinyaller ve gerçek zamanlı uyarılar ile yatırımcıların piyasadaki olası dönüş noktalarını tespit etmesine yardımcı olur. Temel Özellikler Çoklu Zaman Dilimli Stokastik Analiz Daha yüksek zaman d
Stratos Pali
Michela Russo
4.43 (7)
Stratos Pali Indicator   is a revolutionary tool designed to enhance your trading strategy by accurately identifying market trends. This sophisticated indicator uses a unique algorithm to generate a complete histogram, which records when the trend is Long or Short. When a trend reversal occurs, an arrow appears, indicating the new direction of the trend. Important Information Revealed Leave a review and contact me via mql5 message to receive My Top 5 set files for Stratos Pali at no cost! Dow
Dynamic Forex28 Navigator
Bernhard Schweigert
4.43 (7)
Dynamic Forex28 Navigator - Yeni Nesil Forex Ticaret Aracı. ŞU ANDA %49 İNDİRİM. Dynamic Forex28 Navigator, uzun zamandır popüler olan göstergelerimizin evrimidir ve üçünün gücünü tek bir göstergede birleştirir: Gelişmiş Döviz Gücü28 Göstergesi (695 inceleme) + Gelişmiş Döviz İMPULS ve UYARI (520 inceleme) + CS28 Kombo Sinyalleri (Bonus). Gösterge hakkında ayrıntılar https://www.mql5.com/en/blogs/post/758844 Yeni Nesil Güç Göstergesi Ne Sunuyor?  Orijinallerde sevdiğiniz her şey, şimdi yeni
GOLD Impulse with Alert
Bernhard Schweigert
4.67 (12)
Bu gösterge, 2 ürünümüz Advanced Currency IMPULSE with ALERT  +   Currency Strength Exotics  'in süper bir kombinasyonudur. Tüm zaman dilimleri için çalışır ve 8 ana para birimi artı bir Sembol için grafiksel olarak güç veya zayıflık dürtüsünü gösterir! Bu Gösterge, Altın, Egzotik Çiftler, Emtialar, Endeksler veya Vadeli İşlemler gibi herhangi bir sembol için para birimi gücü ivmesini göstermek için uzmanlaşmıştır. Türünün ilk örneğidir, Altın, Gümüş, Petrol, DAX, US30, MXN, TRY, CNH vb. içi
Reversal Master
Alexey Minkov
4.8 (15)
The Reversal Master is an indicator for determining the current direction of price movement and reversal points. The indicator will be useful for those who want to see the current market situation better. The indicator can be used as an add-on for ready-made trading systems, or as an independent tool, or to develop your own trading systems. The Reversal Master indicator, to determine the reversal points,  analyzes a lot of conditions since the combined analysis gives a more accurate picture of t
FX Power MT4 NG
Daniel Stein
4.95 (21)
FX Power: Daha Akıllı Ticaret Kararları için Para Birimlerinin Gücünü Analiz Edin Genel Bakış FX Power , her piyasa koşulunda başlıca para birimlerinin ve altının gerçek gücünü anlamak için vazgeçilmez bir araçtır. Güçlü para birimlerini alıp zayıf olanları satarak, FX Power ticaret kararlarınızı basitleştirir ve yüksek olasılıklı fırsatları ortaya çıkarır. İster trendlere sadık kalın ister Delta'nın aşırı değerlerini kullanarak tersine dönüşleri öngörün, bu araç ticaret tarzınıza mükemmel bir
Volatility Trend System - girişler için sinyaller veren bir ticaret sistemi. Oynaklık sistemi, trend yönünde doğrusal ve noktasal sinyaller ve ayrıca yeniden çizme ve gecikme olmaksızın trendden çıkmak için sinyaller verir. Trend göstergesi, orta vadeli trendin yönünü izler, yönünü ve değişimini gösterir. Sinyal göstergesi volatilitedeki değişikliklere dayalıdır ve piyasa girişlerini gösterir. Gösterge, çeşitli uyarı türleri ile donatılmıştır. Çeşitli alım satım araçlarına ve zaman dilimlerine
Auto Optimized MFI , geçmiş veriler üzerinde gerçek ticaret simülasyonları yürüterek, işlem yaptığınız piyasa ve zaman dilimine en uygun MFI alım/satım seviyelerini otomatik olarak belirleyen, kendini ayarlayan bir göstergedir. Geleneksel sabit 80/20 eşiklerine dayanan göstergelerin aksine, bu araç gerçek fiyat ve hacim davranışına göre uyum sağlar. Nasıl Çalışır Belirlediğiniz geçmiş mum aralığını tarar ve MFI sinyallerine dayalı giriş/çıkış işlemlerini simüle eder. Kazanma oranı, maksimum düşü
Trend indicator AI
Ramil Minniakhmetov
4.53 (83)
Trend Ai göstergesi, trend tanımlamasını işlem yapılabilir giriş noktaları ve geri dönüş uyarılarıyla birleştirerek bir yatırımcının piyasa analizini geliştirecek harika bir araçtır. Bu gösterge, kullanıcıların forex piyasasının karmaşıklıklarında güvenle ve hassasiyetle yol almalarını sağlar. Birincil sinyallerin ötesinde, Trend Ai göstergesi geri çekilmeler veya düzeltmeler sırasında ortaya çıkan ikincil giriş noktalarını belirleyerek, yatırımcıların belirlenen trend içindeki fiyat düzeltmele
Yazarın diğer ürünleri
Yesterday today high low
Sivaramakrishnan Thavasi
5 (1)
This indicator will show yesterday and today high low, very useful to understand the market sentiment. To trade within the range/ break out. Previous day low- can act as support- can used for pull back or break out Previous day high- can act as resistance- can used for pull back or break out The previous day high low breakout strategy  refers to the day trading technique that provides traders with multiple opportunities to go either long or short . The main idea is to identify the trend in its m
FREE
R Multiplier
Sivaramakrishnan Thavasi
The   risk-to-reward ratio   is used for assessing the potential profit (reward) against the potential loss (risk) of a trade. Stock traders and investors use the R/R ratio to fix the price at which they'll exit the trade, irrespective of whether it generates profit or loss. A   stop-loss   order is generally used to exit the position in case it starts moving in an opposite direction to what a trader anticipated. The relationship between the risk and reward helps determine whether the potentia
FREE
Weekdays lines
Sivaramakrishnan Thavasi
Boost your technical analysis with our Weekday Lines Indicator — a powerful yet lightweight tool designed for traders who want to clearly visualize daily market structure. Key Features: Auto Draws Vertical Lines for each trading day: Monday through Friday Customizable Colors & Styles to match your chart theme Day Labels (Mon, Tue, etc.) appear next to lines for easy tracking Works in All Timeframes — especially useful in intraday and swing trading No Lag, No Clutter – just clean, prec
FREE
Week Month High Low
Sivaramakrishnan Thavasi
4 (1)
This indicator will show week and monthhigh low, very useful to understand the market sentiment. To trade within the range/ break out. Low- can act as support- can used for pull back or break out High- can act as resistance- can used for pull back or break out Breakout strategy  refers to the day trading technique that provides traders with multiple opportunities to go either long or short . The main idea is to identify the trend in its most juicy state followed by a trending move.
FREE
This free tool is more reliable and user friendly to use Please give five star if you feel the tool is helpful  Lot size positioning is the important risk management rule The larger the lot, the more risk you're exposed to. Smaller lot sizes are often favored by traders who want to manage risk more conservatively. A general rule of thumb is to risk no more than 1-2% of their account on each trade. Traders need to determine their risk tolerance for each trade. This will help them decide how muc
FREE
you can plan you exit in terms of money/floating with this tool Once the negative or positive floating value reached this tool will close all opened positions How to deal with big negative floating profit? It will be very difficult to overcome this phase you can prevent with this phase with a exit strategy It can be stop loss or close all orders if account has reached this much floating 
FREE
Never miss an opportunity with a pending order But if market structure changes or during events it can act against you It is better to place pending orders with expire time This tool will be helpful for you with preset expire time Buy Limit : This order is placed   below   the current market price. Traders use it when they anticipate a pullback or retracement before the price continues to rise. Sell Limit : This order is placed   above   the current market price. It’s used when a trader expe
FREE
Hi Traders,  On purchase this tool we will give lifetime free updates for this tool you can contact me how to use this tool better or your suggestion for improvement  This tool will work on any accounts  Where When Enter Exit – Trade Plotter   helps traders easily   see, track, and review   their sell trades directly on the chart. It clearly shows   where   you entered,   when   you exited, and   why , so you can quickly learn from every trade. Key Features   Auto Plot Entries & Exits
Weekdays lines 5
Sivaramakrishnan Thavasi
Boost your technical analysis with our   Weekday Lines Indicator   — a powerful yet lightweight tool designed for traders who want to clearly visualize daily market structure. Key Features:   Auto Draws Vertical Lines   for each trading day: Monday through Friday   Customizable Colors & Styles   to match your chart theme   Day Labels   (Mon, Tue, etc.) appear next to lines for easy tracking   Works in All Timeframes   — especially useful in intraday and swing trading   No Lag, No Clut
Hi Traders,  On purchase this tool we will give lifetime free updates for this tool you can contact me how to use this tool better or your suggestion for improvement  This tool will work on any accounts  Where When Enter Exit – Trade Plotter   helps traders easily   see, track, and review   their sell trades directly on the chart. It clearly shows   where   you entered,   when   you exited, and   why , so you can quickly learn from every trade. Key Features   Auto Plot Entries & Exits   –
Filtrele:
Değerlendirme yok
Değerlendirmeye yanıt