MRA Index
- Göstergeler
- Sürüm: 2.1
- Güncellendi: 20 Temmuz 2023
- Etkinleştirmeler: 5

MRA Index Göstergesi Genel Bakış
Bonus Teklifi: İndikatörü satın aldığınızda "MRA Index EA"yi ücretsiz olarak alırsınız.
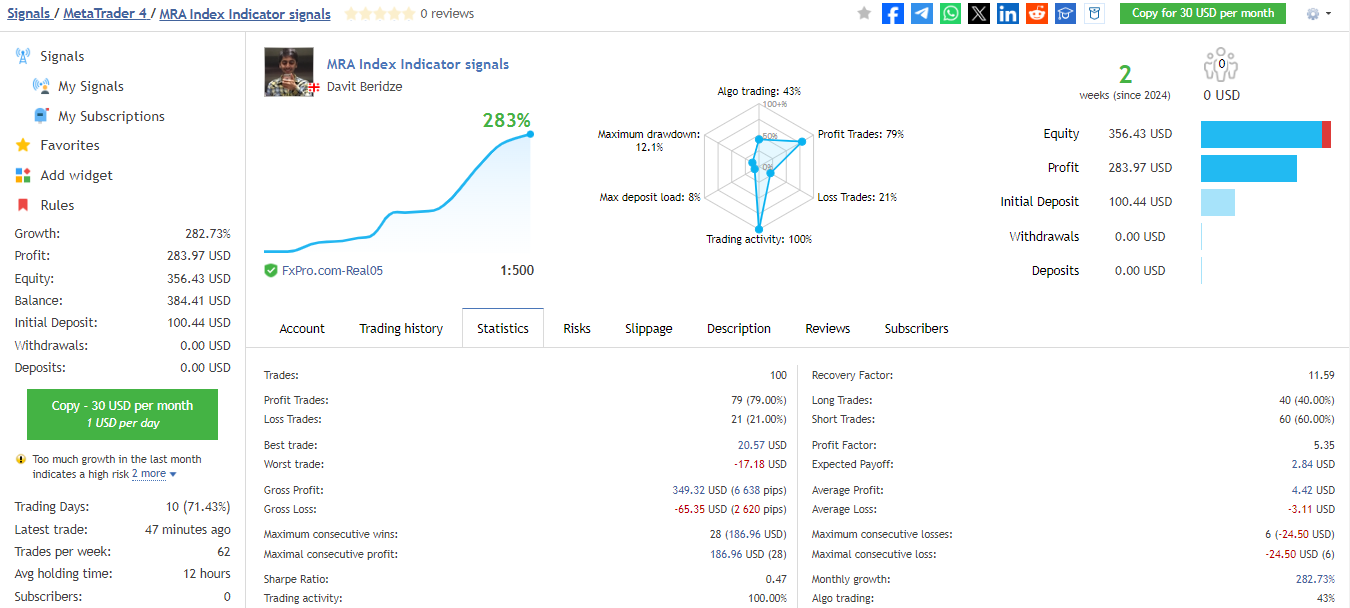
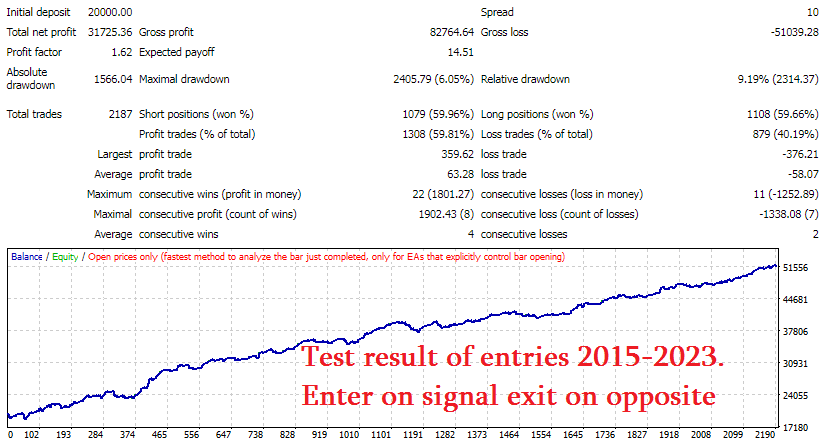
Optimizasyon Stratejisi: Scalping için, son 12 aylık veriye dayalı optimizasyon yaparak, bunu sonraki 1 ay boyunca kullanıyorum. Bu yöntem oldukça etkili olduğunu kanıtlamıştır.
Önemli Not: Varsayılan ayarlar yalnızca görselleştirme içindir ve kârlılık için optimize edilmemiştir. Doğru optimizasyon süreciyle ilgili yönergeler yalnızca alıcılara sağlanmaktadır.
"MRA Index" Göstergesi Hakkında:
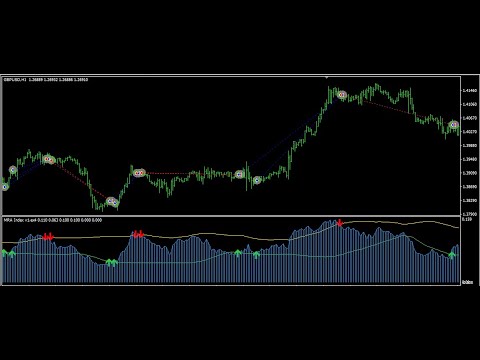
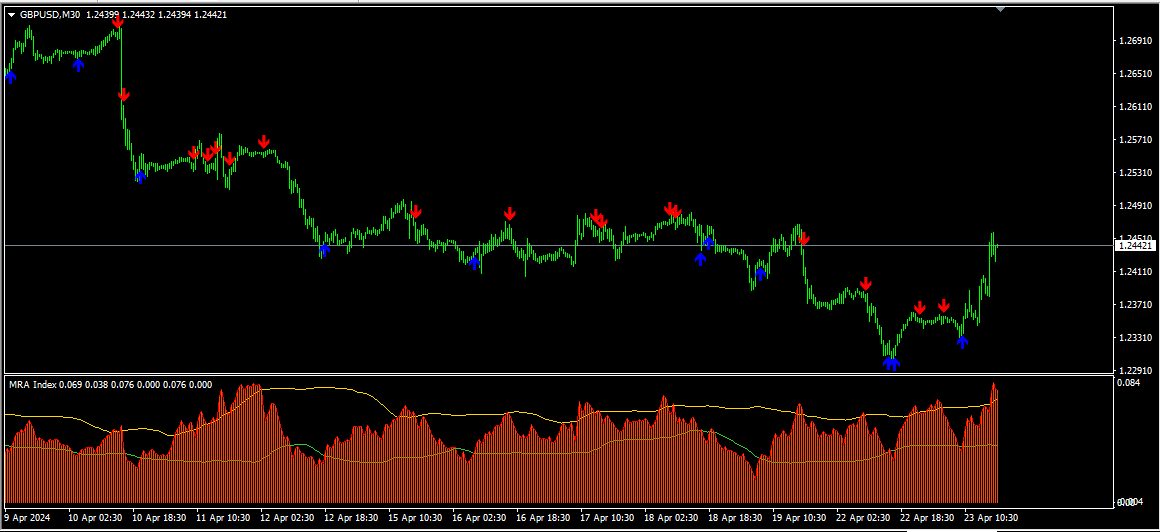
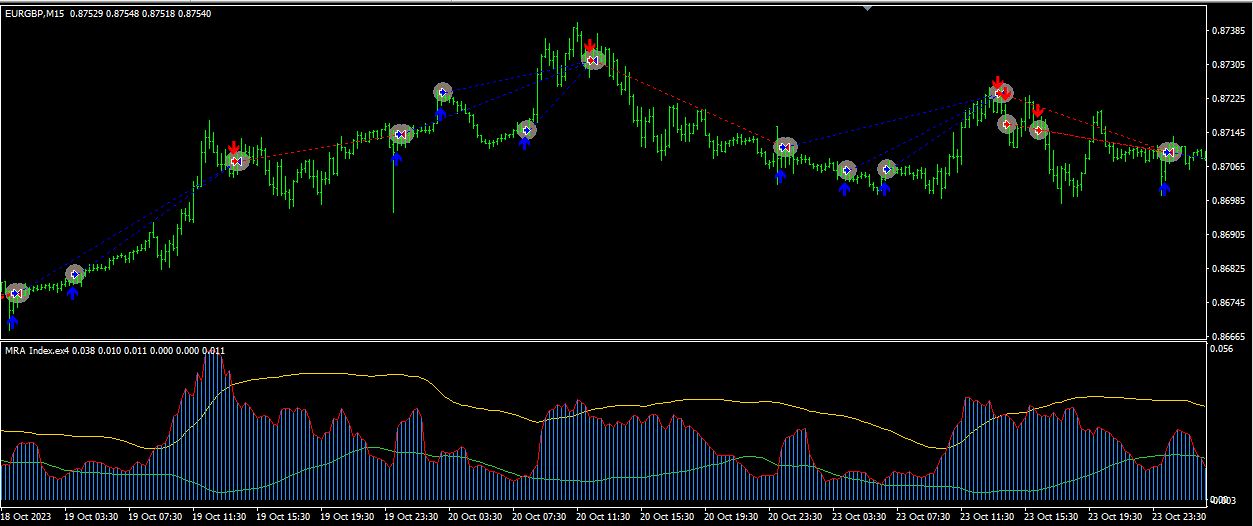
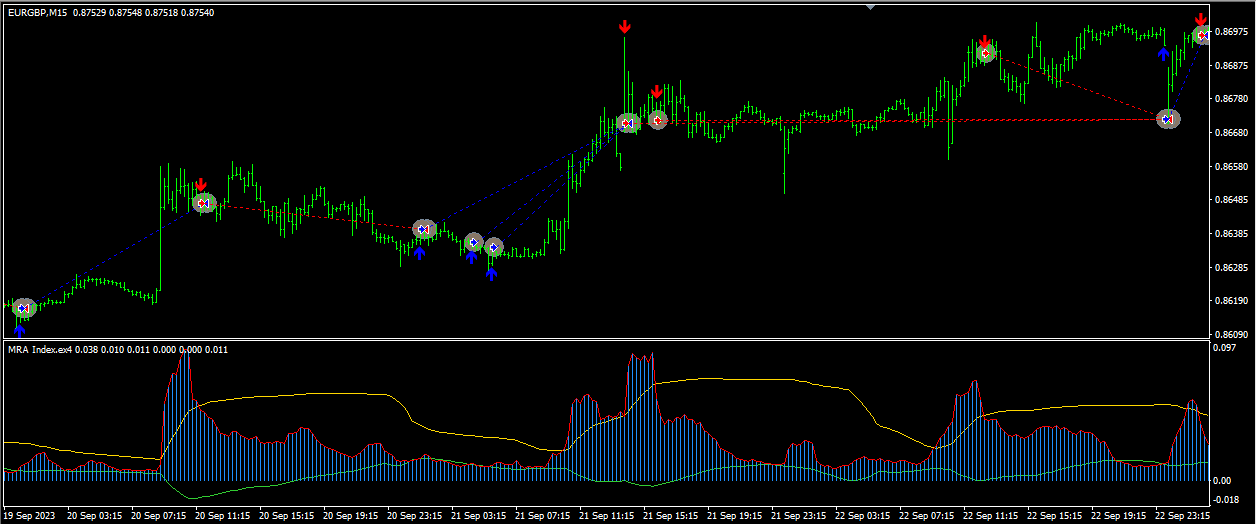
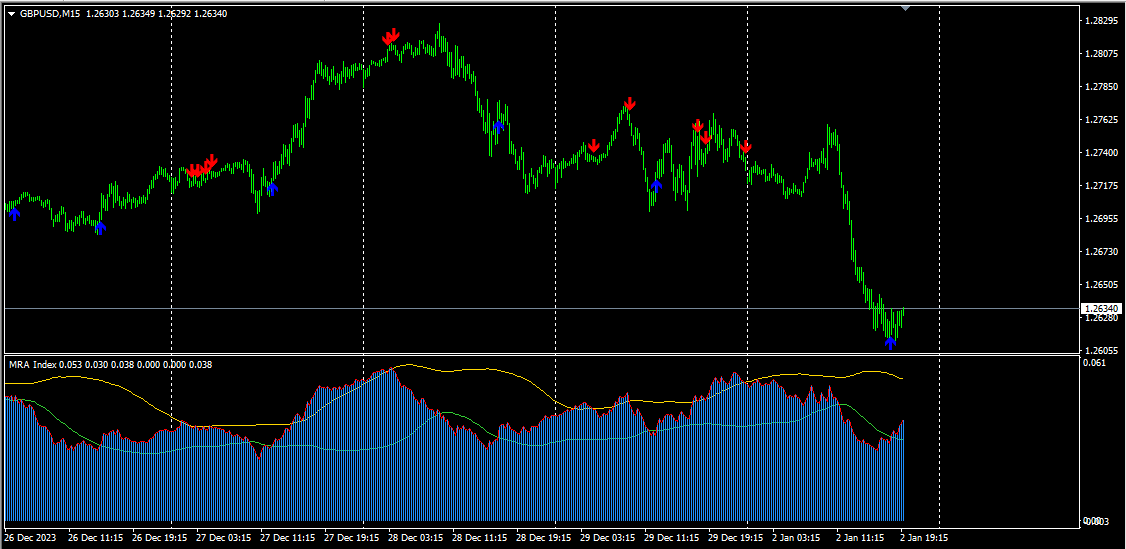
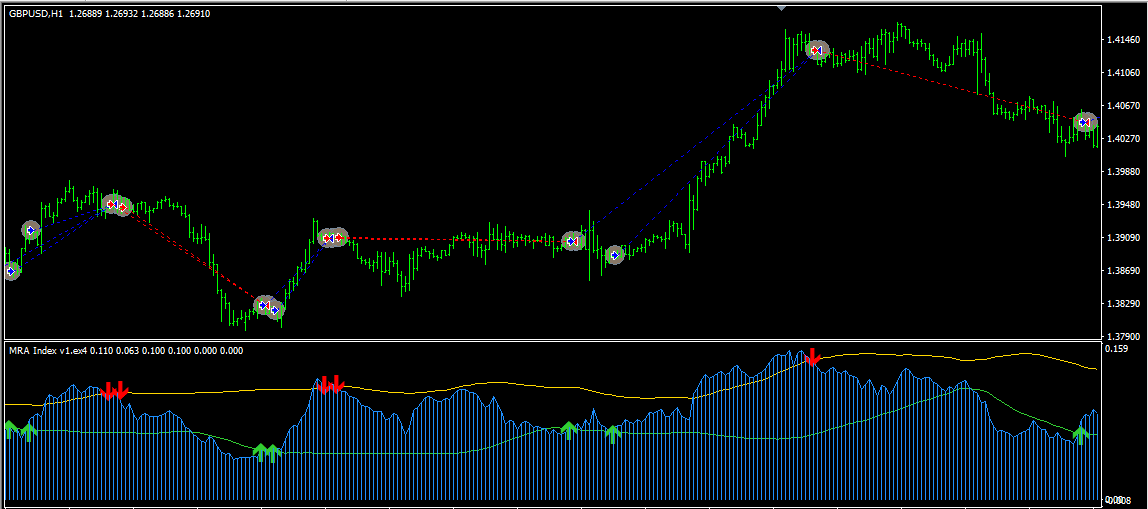
"MRA Index", yatırımcılara potansiyel piyasa trendlerini ve giriş noktalarını belirlemelerine yardımcı olan çok yönlü bir forex göstergesidir. Özel bir kanal ve bu kanal içinde hareket eden dinamik bir hibrit çizgiye sahiptir; bu çizgi alım ve satım sinyalleri üretir.
Ana Özellikler:
-
Dinamik Hibrit Çizgi: Kanal içinde hareket eder ve ticaret sinyalleri oluşturmanın temelini oluşturur.
-
Alım ve Satım Okları: Hibrit çizgi ile kanal arasındaki belirli etkileşimlere dayanarak oluşturulur ve olası piyasa dönüşlerini gösterir.
-
Özelleştirme: Yatırımcılar, çeşitli giriş parametrelerini ayarlayarak göstergeleri kendi stratejilerine uyarlayabilir.
-
Opsiyonel Filtreler:
-
ATR (Ortalama Gerçek Aralık): Hassasiyeti ayarlamak için etkinleştirilebilir veya devre dışı bırakılabilir.
-
Bollinger Bantları (BB): Fiyat hareketine dayalı sinyalleri filtrelemeye yardımcı olur.
-
FTR Filtresi: Piyasa koşullarını renk kodlu olarak görsel olarak tanımlamaya yardımcı olur.
-
Özelleştirme Seçenekleri: Gösterge, ATR, MFI, RSI, Bollinger Bantları ve Standart Sapma dahil olmak üzere bir dizi giriş parametresi sunmaktadır. Ayrıca yatırımcılar, açılır mesajlar, anlık bildirimler, ses ve e-posta yoluyla uyarıları etkinleştirebilir veya devre dışı bırakabilir.
Risk Uyarısı: Hiçbir gösterge kârlı işlemleri garanti edemez. Etkili bir risk yönetimi ve "MRA Index"in diğer analiz teknikleriyle birleştirilmesi, bilinçli ticaret kararları almak için gereklidir.
Giriş Parametrelerinin Genel Görünümü:
-
Göstergenin Davranışı:
-
UseATR: ATR hesaplamasını etkinleştir/devre dışı bırak.
-
Std_Period: Kanal için standart sapma periyodu.
-
TimeFrame: Grafik zaman dilimini tanımlar.
-
History: Hesaplanacak mum çubuk sayısı.
-
-
Filtreler:
-
UseBB: Bollinger Bantları filtresini etkinleştir/devre dışı bırak.
-
periodFTR: FTR filtresi aracılığıyla piyasa koşullarının görselleştirilmesini kontrol eder.
-
-
Uyarılar:
-
alertsOn: Uyarıları etkinleştir/devre dışı bırak.
-
alertsPush, alertsSound, alertsEmail: Bildirim tercihleri.
-
Bu ayarları özelleştirerek, yatırımcılar göstergeleri kendi ticaret tarzlarına ve hedeflerine göre uyarlayabilirler.


very helpfull seller, results looks good, looking forward, thank you