适用于MetaTrader 4的付费技术指标 - 108

Gold Level MT4
A great helper for trading Gold.
Levels do not repaint and do not change their data We recommend using it with the indicator - Professional Trade Arrow
Levels are built every day, so you will trade every day with the indicator.
Gold Level.
Price markups are shown on the chart, after reaching TP1 or SL1, close half of the position, and the rest is transferred to breakeven.
Any questions? Need help?, I am always happy to help, write me in private messages or in telegram.

The indicator plots key levels automatically for EURUSD.
The indicator doesn't give any trading signals.
It can be used to enhance your current strategy. (Please see screenshots)
The color, line style and thickness can be adjusted as preferred.
Symbol: EURUSD Timeframe: H1 and below
Please note the levels are not always a 100% accurate.
Enjoy! ------------------------------------------

TRADE THE BREAKOUTS like Gordon Gekko Gordon Gekko, the ruthless and iconic character from the movie "Wall Street," is renowned for his aggressive and opportunistic trading strategies. When it comes to trading breakouts, Gekko embodies the mindset of a savvy and relentless trader who seizes every opportunity to capitalize on market movements. In Gekko's trading playbook, spotting breakout opportunities is akin to identifying potential gold mines in the market. He meticulously scans the charts
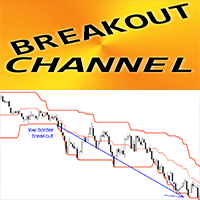
MT4 外汇指标突破通道,无需重新绘制
该指标可用作基于高/低突破的完整交易系统 它只有 1 个参数 - HYSTORY DEPTH,它反映指标考虑的蜡烛数量 参数 HYSTORY DEPTH 建议值:时间范围 D1 - 20(一个月)、H4 - 30(一周)、H1 - 24(一天) 突破通道由 3 条线组成:高边界 - 最后 N 个(HYSTORY DEPTH 参数)蜡烛的最高价格,低边界 - 最后 N 个(HYSTORY DEPTH 参数)蜡烛的最低价格,中线。 指标可以与其他指标/价格行为模式结合使用 BREAKOUT CHANNEL 指示器的使用示例可在图片中找到
// 这里提供更多优秀的 EA 交易和指标: https://www.mql5.com/en/users/def1380/seller // 也欢迎您加入盈利、稳定、可靠的信号 https://www.mql5.com/en/signals/1887493 它是仅在该 MQL5 网站上提供的原创产品。

使用我们的 Metatrader 交易量曲线指标,探索交易量分析的威力! / MT5 版本
基本成交量曲线是专为希望优化交易的手动交易者设计的指标。对于任何希望更好地了解市场行为的严肃交易者而言,成交量曲线指标都是必不可少的工具。利用我们的创新解决方案,您可以清晰、简明地直观了解交易量在不同价格间的分布情况。这样,您就可以确定关键的关注区域,如支撑位和阻力位、累积区和分布区以及重要的控制点。与显示特定日期交易量的普通交易量指标不同,Basic Volume Profile 显示的是特定价格的交易量。
我们的指标具有直观和可定制的界面,让您可以根据自己的交易偏好进行调整。
特点 在价格图表上清晰显示成交量概况。 快速识别高低成交量活动区域。 完全自定义颜色和样式,以适应您的交易风格。 支持多时段综合分析。 专门的技术支持,确保体验顺畅。
配置参数 指标设置 Number of histograms: 要显示的成交量条数 Profile position: 是否希望在第一根蜡烛或侧面显示成交量曲线 Color mode: 是否希望将成交量曲线分为看涨/看跌两种模
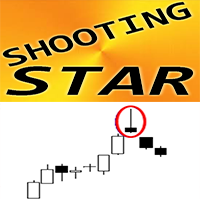
MT4 外汇指标“射击之星模式”
“流星模式”指标对于价格行为交易来说是非常强大的指标:无需重绘,无延迟; 指标检测到图表上的看跌流星形态:图表上的红色箭头信号(参见图片) 包括 PC、手机和电子邮件警报 “流星形态”指标非常适合与支撑/阻力位结合使用: https://www.mql5.com/en/market/product/100903
// 这里提供更多优秀的 EA 交易和指标: https://www.mql5.com/en/users/def1380/seller // 也欢迎您加入盈利、稳定、可靠的信号 https://www.mql5.com/en/signals/1887493 它是仅在该 MQL5 网站上提供的原创产品。
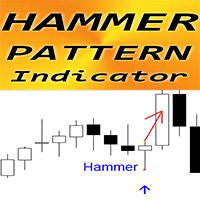
MT4 外汇指标“锤子形态”
“锤子形态”指标对于价格行为交易来说是非常强大的指标:无需重绘,无延迟; 指标检测图表上的看涨锤子形态:图表上的蓝色箭头信号(参见图片) 包括 PC、手机和电子邮件警报 “锤子形态”指标非常适合与支撑/阻力位结合使用: https://www.mql5.com/en/market/product/100903
// 这里提供更多优秀的 EA 交易和指标: https://www.mql5.com/en/users/def1380/seller // 也欢迎您加入盈利、稳定、可靠的信号 https://www.mql5.com/en/signals/1887493 它是仅在该 MQL5 网站上提供的原创产品。
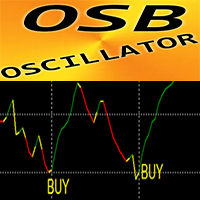
OSB 振荡器 - 是高级自定义指标、高效的价格行为辅助工具!
采用先进的新计算方法。 新一代振荡器 - 查看图片以了解如何使用它。 OSB 振荡器是一种辅助工具,用于查找价格行为、背离和超卖/超买信号的准确切入点 超卖值:低于30 超买值:超过70 即使是使用该指标的标准策略也有很多升级的机会。 它比标准振荡器更快、更准确。 指标设置非常简单。 它只有 1 个参数 - 灵敏度。
如何使用: 作为价格行为过滤器(见图) 作为主要趋势方向的入场信号(见图) 作为具有准确信号的背离指标(见图)
// 这里提供更多优秀的 EA 交易和指标: https://www.mql5.com/en/users/def1380/seller // 也欢迎您加入盈利、稳定、可靠的信号 https://www.mql5.com/en/signals/1887493 它是仅在该 MQL5 网站上提供的原创产品。

This is a correlation hedge type indicator which helps trade the obscure relationship between crude oil and natural gas markets. Which is overall an unknown trading concept to most traders, yet a very impressive one. The usual market risk is mittigated through the smooth trend of hedge tading, as well as the leading signals the indicator provides!
Pros: low risk trading, normal profits, no need to be right about either market
Cons: requires large capital
----------------------------------

"Awesome Market Prediction" is a revolutionary indicator designed to provide accurate and sophisticated market predictions to traders. Developed with cutting-edge technology and intelligent algorithms, this indicator offers deep insights into future market movements. Key features of "Awesome Market Prediction" include: High Accuracy Predictions : Utilizing in-depth data analysis and advanced prediction techniques, this indicator delivers highly accurate estimates of market direction. Multiple Ma

泥瓦匠是一个工具,将使你成为一个专业的分析师! 使用倾斜通道确定波浪运动的方法定性地传达了任何工具运动的原理图,不仅显示了市场可能的逆转,而且还显示了进一步运动的目标!破坏了市场还活着的神话,清楚地显示了从一个范围到另一个范围的运动原理图! 一个专业的工具,适合中期与当前趋势的定义! 泥瓦匠是一个工具,将使你成为一个专业的分析师! 使用倾斜通道确定波浪运动的方法定性地传达了任何工具运动的原理图,不仅显示了市场可能的逆转,而且还显示了进一步运动的目标!破坏了市场还活着的神话,清楚地显示了从一个范围到另一个范围的运动原理图! 一个专业的工具,适合中期与当前趋势的定义!
泥瓦匠是一个工具,将使你成为一个专业的分析师! 使用倾斜通道确定波浪运动的方法定性地传达了任何工具运动的原理图,不仅显示了市场可能的逆转,而且还显示了进一步运动的目标!破坏了市场还活着的神话,清楚地显示了从一个范围到另一个范围的运动原理图!
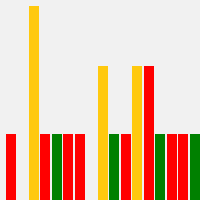
I'm excited to introduce you to the fifth bar on Martin Armstrong's Forecast Array - The Trading Cycle .
This innovative tool represents a transverse form of cyclical frequency analysis, offering a unique perspective on market trends.
The model employs a color-coded system for easy interpretation. In this model, green signals the ideal timing for highs, red indicates ideal lows, and yellow signifies a convergence of highs and lows occurring simultaneously. This intuitive approach allows
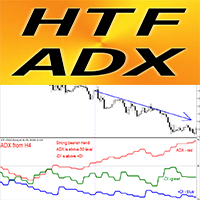
MT4 外汇指标 HTF ADX
使用适用于 MT4 的专业 HTF ADX 指标升级您的交易方法。 HTF 意味着 - 更高的时间范围 ADX(红线)用于衡量趋势强度 - 如果 ADX 值高于 30 并且具有楼上形状 - 趋势较强 如果+DMI(蓝线)高于-DMI(绿线):价格正在上涨,ADX 衡量上升趋势的强度 如果 -DMI(绿线)高于 +DMI(蓝色线):价格正在下跌,ADX 衡量下降趋势的强度 该指标非常适合多时间框架趋势交易 - 您可以将较高时间框架的 ADX 附加到当前图表
// 这里提供更多优秀的 EA 交易和指标: https://www.mql5.com/en/users/def1380/seller // 也欢迎您加入盈利、稳定、可靠的信号 https://www.mql5.com/en/signals/1887493 它是仅在该 MQL5 网站上提供的原创产品。
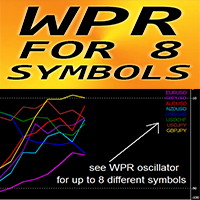
MT4 的外汇指标“WPR for 8 Symbols”,无需重新绘制
WPR 本身是剥头皮的最佳振荡器之一 最好从强劲的超买区域(高于 -10)买入卖出,从强劲的超卖区域(低于 -90)买入 “8 个交易品种的 WPR”让您有机会在 1 个图表上控制最多 8 个不同交易品种的 WPR 值 该指标也非常适合与超卖/买入区域的价格行为条目结合起来。 ............................................................................................................. // 这里提供更多优秀的 EA 交易和指标: https://www.mql5.com/en/users/def1380/seller // 也欢迎您加入盈利、稳定、可靠的信号 https://www.mql5.com/en/signals/1887493 它是仅在该 MQL5 网站上提供的原创产品。
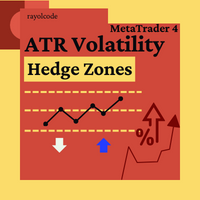
This indicator informs the user when the ATR is above a certain value defined by the user, as well as when the ATR prints a percentage increase or percentage decrease in its value, in order to offer the user information about the occurrence of spikes or drops in volatility which can be widely used within volatility-based trading systems or, especially, in Recovery Zone or Grid Hedge systems. Furthermore, as the volatility aspect is extremely determining for the success rate of any system based o
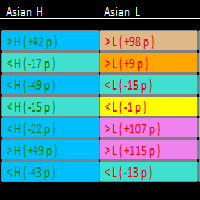
This scanner works with the other "Smart Market Structure Opportunity Scanner", and is basically an extension of that scanner with added features to find more accurate entry opportunities for day trading or refined swing trading. The most important added features are: 1) The ADRs ( Average Daily Range ) for the last 5 days would have color and +/- sign that shows the direction of each days ADR move. 2) I added RSI values for each of the trading timeframes ( 1min, 5min, 15min, 30min, 60m
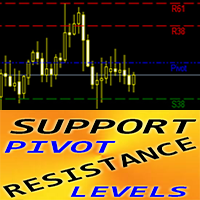
MT4 外汇指标“枢轴支撑阻力位日周月”
“枢轴 SR 水平 D_W_M”指标是价格行为交易的非常强大的辅助指标 该特定指标在计算中使用斐波那契数。 枢轴水平计算为前一交易期间市场表现的重要价格的平均值 枢轴水平本身代表最高阻力或支撑水平,具体取决于整体市场状况 指标“枢轴 SR 水平 D_W_M”向您显示最可能的反转水平,可以通过价格达到该水平。 R - 电平(红色) - 电阻 S - 级别(绿色) - 支持 每日、每周和每月之前的交易周期可在设置中进行计算 指标“枢轴水平 D_W_M ”非常适合通过价格行为模式规划您的止盈目标或价格反转。 如何使用指标: 1) 将指标附加到相应的图表上 2) 选择您需要的设置并按 OK 按钮 3) 点击MT4中的不同时间范围(H1、H4、D1、W1)以进行指标的初始正确计算。
// 这里提供更多优秀的 EA 交易和指标: https://www.mql5.com/en/users/def1380/seller // 也欢迎您加入盈利、稳定、可靠的信号 https://www.mql5.com/en/signals/1887493 它是仅在

Description of work
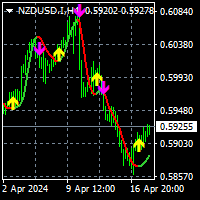
The 'MA7 Clover' indicator is based on candle shapes. Shows the 'Pin Bar' candle pattern. Detailed information about the 'MA7 Clover' indicator.
Indicator settings
General settings: Min body size ; Max body size ; Min nose size ; Max nose size .
Message settings: Send message to the terminal (Alert) – permission to send messages to the terminal using the Alert function; Send message to the mobile terminal (Push) – permission to send messages to the mobile terminal using
To download MT5 version please click here .
- This is the exact conversion from TradingView: " PA-Adaptive Hull Parabolic " By "Loxx".
- This is a non-repaint and light processing load indicator
- You can message in private chat for further changes you need.
- All input options are available except candle coloring.
- Buffers are available for processing within EAs.
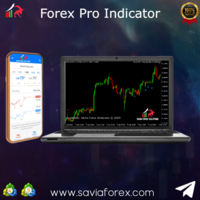
Savia Forex Pro Indicator The Savia Forex Solutions Forex Pro Indicator gives you highly accurate entries on all Forex/Currency pairs, Indices and Cryptocurrencies. The Forex Pro Indicator is dynamic and powerful and is optimized for all timeframes and ALL Currency pairs, Indices, Commodities, and Cryptocurrency pairs. Trade with improved confidence and maximize your success rate. Benefits Dynamic and Powerful FRP is fully optimized for all chart timeframes FMPL works with any asset. It can be

使用此交易工具,您可以同时扫描 15 个市场。
介绍新的交易指标 2024:
️ 仪表板多货币多时间框架随机。
我创建这个交易工具至少有两个原因:
首先,我厌倦了只观察一个市场。 其次,我不想失去进入另一个市场的时机。
这就是为什么我想同时了解其他市场状况。
因此,我需要一台可以同时扫描多个市场状况的扫描仪。
我经常寻找随机主线>(或<=)随机信号线从M1到H4(或只是M1到M30)的市场。
如果您同意我的分析,那么这就是您一直在寻找的交易指标。
不要错过市场状况满足上述要求的时刻。
这是一个随机扫描仪或仪表板,具有许多出色的功能:
可显示随机主线数据 可显示随机信号线数据 可以显示随机主线和信号线的位置(信号线上方主线或信号线下方主线) 可以显示随机主线和信号线的数据水平(看涨、看跌、趋势向上、趋势向下、超买但仍向上、超卖但仍向下) 可显示从M1到MN1的实时数据 可显示15种货币对的数据(多币种外汇/商品/加密货币/股票) 可定制参数 可定制颜色 OBOS 级别 漂亮的20仪表板配色方案 配备开/关货币对转换器 配备蜡烛高时间框架 配

This Fibonacci Indicator is showing fibo retracement lines on chart same as the default tool from Metatrader's menu, except this one is fully automatic and changes along with the chart (with modes B and C, then mode A is always fixed by set levels)
AND it also offers the line levels for the Expert Advisors to read (buffers) , so you can set your trades based on crossover\crossunder on those fibo lines.
You can choose from 3 modes for selecting the max HIGH and min LOW limit,
and you can set
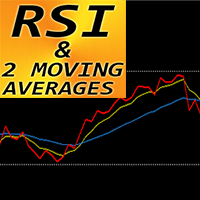
MT4 外汇指标“RSI 和 2 条移动平均线”
该指标非常适合动量交易系统。 “RSI 和 2 MAs”指标可让您查看 RSI 本身的快速和慢速移动平均线 指标提供了尽早看到趋势变化的机会 “RSI 和 2 MAs”可用于捕捉趋势方向的动能 通过参数设置该指标非常容易(见图) 指标可用于任何时间范围 ............................................................................................................. // 这里提供更多优秀的 EA 交易和指标: https://www.mql5.com/en/users/def1380/seller // 也欢迎您加入盈利、稳定、可靠的信号 https://www.mql5.com/en/signals/1887493 它是仅在该 MQL5 网站上提供的原创产品。

The Forex Correlation Indicator is a powerful tool designed to analyze and display the correlation between different major forex pairs in the market. This indicator helps traders identify relationships and trends between currency pairs, allowing for more informed trading decisions. Key Features: Displays correlation coefficients between pairs. Visualizes correlation strength through color-coded indicators. Customizable settings for timeframes and correlation calculations. User-friendly interfac
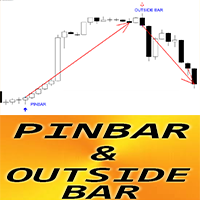
MT4 外汇指标“Pin Bar 和 Outside Bar 模式”
“Pin Bar & Outside Bar Patterns”指标对于价格行为交易非常强大 指标检测图表上的 Pin Bar 和 Outside Bar 形态: 看涨模式 - 图表上的蓝色箭头信号(参见图片) 看跌模式 - 图表上的红色箭头信号(见图) 无需重新喷漆; 没有延误; 带有 PC、手机和电子邮件警报 指标“Pin Bar & Outside Bar Patterns”非常适合与支撑/阻力位结合使用: https://www.mql5.com/en/market/product/100903
// 这里提供更多优秀的 EA 交易和指标: https://www.mql5.com/en/users/def1380/seller // 也欢迎您加入盈利、稳定、可靠的信号 https://www.mql5.com/en/signals/1887493 它是仅在该 MQL5 网站上提供的原创产品。

The Forex indicator TrendNavigator is a technical indicator. TrendNavigator is a tool that allows traders employing this strategy to better understand what is happening in the market and predict in which direction the price will continue to move. The indicator's values are calculated based on price movements of the currency pair or any other financial asset. Within the scope of technical analysis, the TrendNavigator indicator is used by traders to forecast future price values or the overall

The Trend Seeker indicator is perfectly suited for tracking long-term trends in the Forex market and can be used without restrictions on instruments or time intervals. This indicator allows attempting to forecast future values, but its main application lies in generating buy and sell signals. The AlphaTrend Seeker tracks market trends, disregarding sharp fluctuations and noise around the average price. It is based on the idea of technical analysis, asserting that the market has a cyclical n

Keltner Trend Pro - Unleash the Power of Price Action! Are you ready to transform your trading approach? Meet Keltner Trend Pro, an Expert Advisor meticulously crafted to harness the dynamic movements of the market using the renowned Keltner Channel and Average True Range (ATR) indicators. Limited-time Special Opportunity: Seize the moment! Be among the first 10 (Purchasing 0/10) to seize this unique opportunity, and not only will you acquire a top-tier trading algorithm but also enjoy an exclu
Professional Trade Arrow
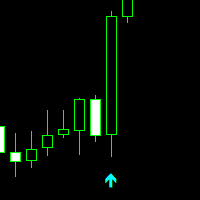
Non-repaint MT4 technical indicator.
works on all timeframes 1 minute to the monthly timeframe
the trade vision buy and sell arrow is a multi currency and synthetic indicator
Aqua arrow look for selling opportunities
Crimson arrow look for buying opportunities.
wait for candle to close and arrow to appear before taking any trades.
Settings: Key value - 3.0 ( This parameter is adjusted for a better signal.) We recommend a trend indicator - Trend

The "Trend Tandem" indicator is a trend analysis tool in financial markets that helps traders determine the direction of price movement.
Options:
RISK: Determines the level of risk taken into account in the trend analysis. The higher the value, the more aggressively volatility is taken into account. SSP (SSP Period): Defines the period of the moving average used to identify a trend. The higher the value, the smoother the trend signal will be. CountBars: Determines the number of bars on whic

The "Trend Api" indicator is an innovative tool for trend analysis in the Forex market. It has unique features and a wide range of settings that will help traders make informed decisions when trading.
This indicator is based on the analysis of the market trend and helps to identify the direction of price movement. It uses various mathematical algorithms and statistical methods to determine the strength and sustainability of a trend in the market.
One of the key features of the "Trend Api" i

The indicator has 3 lines: green, blue and red.
Between the blue and green line - bullish channel. Between the blue and the red line - a bearish channel.
In addition, there is a signal line that moves inside the channel. This line changes colour from green to red and vice versa, thus indicating what the sentiment of the market is.
The strategy is easy to follow.
When you are in the bullish channel and get a green signal line it is a signal of buying. When you are in a bearish channel
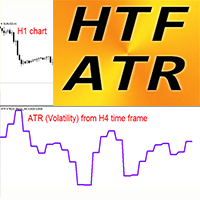
MT4 外汇波动率指标 HTF ATR
平均真实波动幅度本身是交易者最重要的指标之一 - 它显示市场波动性 HTF ATR 是用于技术分析的市场波动指标。 HTF 意味着 - 更高的时间范围 ATR 非常适合规划您的动态止盈/止损位置: 例如,最佳 SL 值位于 1.2-2.5 ATR 值之间 该指标是添加到任何交易系统的有用工具 HTF ATR 指标允许您将较高时间范围的 ATR 附加到当前图表 --> 这是专业的交易方法
// 这里提供更多优秀的 EA 交易和指标: https://www.mql5.com/en/users/def1380/seller // 也欢迎您加入盈利、稳定、可靠的信号 https://www.mql5.com/en/signals/1887493 它是仅在该 MQL5 网站上提供的原创产品。

MT4 的外汇指标“MA Speed”,无需重新绘制。
移动平均线的速度 - 是独特的趋势指标 该指标的计算基于物理学方程。 速度是移动平均线的一阶导数 MA 速度指标显示 MA 本身改变方向的速度 即使是标准策略,也有很多机会可以通过 MA Speed 进行升级。 适用于 SMA、EMA、SMMA 和 LWMA 建议在趋势策略中使用MA Speed,如果指标值<0:趋势向下; 如果指标值 > 0:趋势上升 时间范围 - 任意; 交易对 - 任何 指示器内置移动和 PC 警报。
参数(设置非常简单): 1)速度周期。 建议值为 3 到 7。当速度周期较低时,指示器的灵敏度增加,反之亦然。 2) MA周期(将计算该MA的速度) 3) MA方法:SMA、EMA、SMMA、LWMA 4)MA应用价格(7个选项)
// 这里提供更多优秀的 EA 交易和指标: https://www.mql5.com/en/users/def1380/seller // 也欢迎您加入盈利、稳定、可靠的信号 https://www.mql5.com/en/signals/1887493 它是仅在该
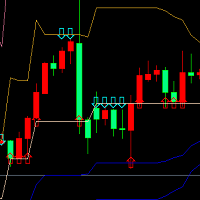
本指标是根据黄金分割理论,分别获取过去22(默认)根K线高低价,并通过黄金分割系数计算得出支撑、压力曲线。 当价格第一次向上靠近压力线,或者多次靠近压力线时,会出现向下的箭头符合,提示有压力,适宜做空sell; 当价格第一次向下靠近支撑线,或者多次靠近支撑线时,会出现向上的箭头符合,提示有支撑,适宜做多buy; 在数据窗口,会提示各条支撑、压力线的价格数值,出现的箭头符合数值为up、down。
这个指标,适合在所挂的图表里做短线,也即进场开仓后,持仓几根K线柱,然后可以平仓。做多的话,止损可以在支撑线下方,止盈在压力线附近。做空的话,止损可以在压力线上方,止盈在支撑线附近。
本指标涉及的黄金分割系数分别为0.382、0.618、1.618、2.168、4.236,计算得到对应的支撑压力线。 由于MT4的指标数量有限,本指标分成了2个EX4文件,第一个的黄金分割系数为0.382、0.618、1.618,第二个为2.168、4.236,第二个文件名为“Golden Ratio Support Pressure Indicator 2.168、4.236”,可免费下载和使用。
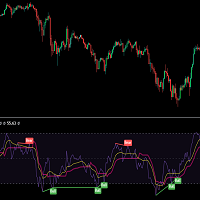
MOST is applied on this RSI moving average with an extra default option added VAR/VIDYA (Variable Index Dynamic Moving Average)
MOST added on RSI has a Moving Average of RSI and a trailing percent stop level of the Moving Average that can be adjusted by changing the length of the MA and %percent of the stop level.
BUY SIGNAL when the Moving Average Line crosses above the MOST Line
LONG CONDITION when the Moving Average is above the MOST
SELL SIGNAL when Moving Average Line crosses belo
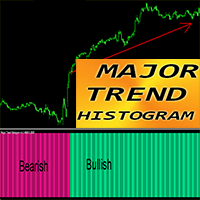
MT4 外汇指标“主要趋势直方图”
主要趋势直方图指标旨在捕捉真正的巨大趋势 指标有 2 种颜色:深粉色代表看跌趋势,春季绿色代表看涨趋势(颜色可以更改) 它可以检测开始阶段的趋势 - 比任何标准移动平均线交叉更有效 主要趋势柱状图可以与任何其他交易方法结合使用:价格行为、VSA、其他指标 指示器内置移动和 PC 警报 ............................................................................................................. // 这里提供更多优秀的 EA 交易和指标: https://www.mql5.com/en/users/def1380/seller // 也欢迎您加入盈利、稳定、可靠的信号 https://www.mql5.com/en/signals/1887493 它是仅在该 MQL5 网站上提供的原创产品。
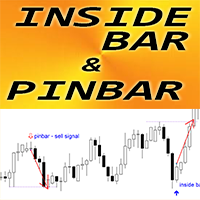
MT4 外汇指标“Inside Bar 和 PinBar 模式”
“Inside Bar & PinBar 模式”指标对于价格行为交易非常强大 指标检测图表上的 Inside Bar 和 PinBar 形态: 看涨模式 - 图表上的蓝色箭头信号(参见图片) 看跌模式 - 图表上的红色箭头信号(见图) 无需重新喷漆; 没有延误; Inside Bar 本身具有较高的 R/R 比率(奖励/风险) 带有 PC、手机和电子邮件警报 “Inside Bar & PinBar 模式”指标非常适合与支撑/阻力位结合使用: https://www.mql5.com/en/market/product/100903
// 这里提供更多优秀的 EA 交易和指标: https://www.mql5.com/en/users/def1380/seller // 也欢迎您加入盈利、稳定、可靠的信号 https://www.mql5.com/en/signals/1887493 它是仅在该 MQL5 网站上提供的原创产品。

MA Trend Following Indicator for MT4 is a simple technical analysis tool designed to follow the trend in any currency pair chosen by the trader by combining 3 moving averages on two different time frames, one long term and one short term.
It basically provides a bullish or bearish signal when the moving averages on one time frame align with the moving averages on a different time frame to have a confluence signal.
The indicator is presented as a screener with multiple currency pairs (that
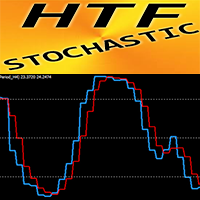
MT4 外汇指标 HTF 随机
随机振荡指标是市场上最好的指标之一 - 对于许多交易者来说是完美的工具。 HTF 意味着 - 更高的时间范围 超买区 - 80 以上; 超卖 1 - 低于 20 HTF 随机指标非常适合多时间框架交易系统,尤其是价格行为条目。 该指标允许您将较高时间范围内的随机指标附加到您当前的图表 --> 这是专业的交易方法 指示器内置移动和 PC 警报 HTF 随机振荡器也可用于常规背离检测。
// 这里提供更多优秀的 EA 交易和指标: https://www.mql5.com/en/users/def1380/seller // 也欢迎您加入盈利、稳定、可靠的信号 https://www.mql5.com/en/signals/1887493 它是仅在该 MQL5 网站上提供的原创产品。

MAXLUM SYSTEM is a Trading System that uses anti-Margin Call without using SL with a positive correlation Hedging Strategy
Simple example of BUY on EURUSD and SELL on GBPUSD at the same time This kind of trading will not occur as a Margin Call By calculating the GAP difference between the 2 pairs we can take advantage of the GAP
This indicator will be more effective if you use Data Analysis Please join the Maxlum System Telegram group for details
Recommended Pair NZDUSD - AUDUSD EURUSD -

Even when most brokers will give you a historic list of all your trading, with the time of the entry, if it was a sell, or a buy, the profit or loss, which is good.
It won't tell you:
Why did you enter the market? so you won't be able to determine if you followed your trading rules, or if you break all your rules and entered the market in a whim or feeling.
Trading is a learning skill, so you have to evaluate your trading performance at the end of your day.
In order to learn what things
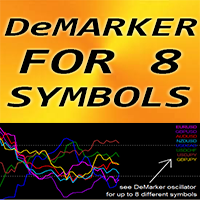
MT4 外汇指标“DeMarker for 8 Symbols”,无需重新绘制
DeMarker 振荡曲线表示指标计算期间相对于之前高点和低点的当前价格位置 DeMarker 提供其他振荡器中最有效的常规发散信号 最好在超买区域(高于 0.7)采用有规律背离的卖出入场点,在超卖区(低于 0.3)有规律背离的买入入场点 “8 个符号的 DeMarker”让您有机会在 1 个图表上控制最多 8 个不同符号的 DeMarker 值 该指标也非常适合与超卖/买入区域的价格行为条目结合起来。
// 这里提供更多优秀的 EA 交易和指标: https://www.mql5.com/en/users/def1380/seller // 也欢迎您加入盈利、稳定、可靠的信号 https://www.mql5.com/en/signals/1887493 它是仅在该 MQL5 网站上提供的原创产品。

The Forex Trend Scanne r is a powerful tool designed to revolutionize currency strength analysis. It caters to traders of all levels, offering guidance on what to trade and in which direction. This versatile model allows users to include any currency-related symbol, such as Gold (XAU/USD), Silver (XAG/USD), and even Bitcoin (BTC/USD). With compatibility across all time frames and default settings covering 28 major pairs, it provides comprehensive insights for informed trading decisions. Whether
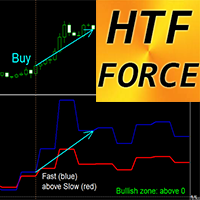
MT4 外汇指标 HTF 强力振荡器
HTF Force 是多时间框架交易的强大指标。 HTF 意味着 - 更高的时间范围 力量指数是将价格和成交量数据结合成单个值的顶级指标之一 高时间范围内的值可以显示趋势方向(下降趋势 - 低于 0;上升趋势 - 高于 0) 快力 - 蓝线,慢力 - 红线 买入信号 - 快线穿过慢线向上且均在 0 上方(见图) 卖出信号 - 快速线穿过慢速线向下且均低于 0(见图) 指示器内置移动和 PC 警报
// 这里提供更多优秀的 EA 交易和指标: https://www.mql5.com/en/users/def1380/seller // 也欢迎您加入盈利、稳定、可靠的信号 https://www.mql5.com/en/signals/1887493 它是仅在该 MQL5 网站上提供的原创产品。
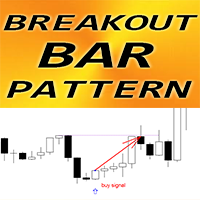
MT4 外汇指标“突破柱形态”
“突破柱形态”指标对于价格行为交易来说是非常强大的指标:无需重新绘制,无延迟; 指标检测图表上的突破柱形态: 看涨突破柱模式 - 图表上的蓝色箭头信号(参见图片) 看跌突破柱模式 - 图表上的红色箭头信号(参见图片) 带有 PC、手机和电子邮件警报 指标“突破柱形态”非常适合与支撑/阻力位结合使用: https://www.mql5.com/en/market/product/100903
// 这里提供更多优秀的 EA 交易和指标: https://www.mql5.com/en/users/def1380/seller // 也欢迎您加入盈利、稳定、可靠的信号 https://www.mql5.com/en/signals/1887493 它是仅在该 MQL5 网站上提供的原创产品。

Direct translation of blackcat's L3 Banker Fund Flow Trend Oscillator. Get push notifications on your phone app when a signal bar has formed. Historical signals are shown with a red checkmark right on the main chart. Indicators uses two data calculations to check for a positive cross below 25% level. Long signals only! For any further questions feel free to contact me directly. Including requests for product improvements.
Working with the Channel Motion Tracker indicator is as simple as possible. Just react to the arrows that the indicator displays. Each arrow represents an explicit command to action. The signals generated by this indicator are accurate enough to allow you to trade based on this information.
One of the main advantages of the indicator is its ability to build high-quality channels and generate signals for entering the market. This is great for the trader who always finds it difficult to choose

The Tripl indicator is designed to visually display the current trend in the market. One of the key aspects of currency market analysis is identifying a trend, which is a stable direction in which prices are moving. For this purpose, the Tripl indicator uses calculations that smooth out sharp fluctuations that do not have a significant impact on the overall trend of price movements.
A trend can be either upward (bullish) or downward (bearish). Most often, a trend develops for a long time befo

With the growth of information technology and the increasing number of participants in financial markets, traditional analysis tools are becoming less effective. Conventional technical indicators, such as the moving average or stochastic, in their pure form are unable to accurately determine the direction of the trend or its reversal. Is it possible to find an indicator that remains effective for 14 years without changing its parameters, and at the same time adapts to market changes? Yes, such
The Smart Volume Tracker is a indicator designed to provide insights into market sentiment by visually presenting bid and ask volume data in a dedicated window. This intuitive tool helps traders quickly identify where buying and selling activity is concentrated, allowing them to make more informed trading decisions. With Smart Volume Tracker, you can easily gauge whether the market is leaning toward a bullish or bearish trend. It shows clusters of bid and ask volumes, using green to represent bu
Dynamic Arc is a non-redrawing channel indicator based on the use of double smoothing moving averages. The difference between the Dynamic Arc indicator and other channel indicators such as Bollinger Band is that it uses double smoothed moving averages. This allows you to more accurately determine the direction of market movement, but makes the indicator less sensitive. However, thanks to double smoothing, it provides a clearer and more stable representation of channels on the chart, which helps

使用此交易工具,您可以同時掃描 15 個市場。
介紹新的交易指標 2024:
️ 儀表板多貨幣多時間框架雙 CCI。
我創建這個交易工具至少有兩個原因:
首先,我厭倦了只觀察一個市場。 其次,我不想失去進入另一個市場的機會。
這就是為什麼我想同時了解其他市場狀況。
因此,我需要一台可以同時掃描多個市場狀況的掃描器。
我經常尋找快速 CCI 線 >(或 <=)慢速 CCI 線從 M1 到 H4(或只是 M1 到 M30)的市場。
如果您同意我的分析,那麼這就是您一直在尋找的交易指標。
不要錯過市場狀況滿足上述要求的時刻。
這是一個隨機掃描器或儀表板,具有許多出色的功能:
可顯示快速CCI線數據 可顯示慢速CCI線數據 可顯示快CCI線和慢CCI線的位置(快線在慢線上方或快線在慢線下方) 可顯示快速CCI線和慢速CCI線的數據水準(看漲、看跌、趨勢向上、趨勢向下、超買但仍向上、超賣但仍向下) 可顯示從M1到MN1的即時數據 可顯示15種貨幣對的資料(多幣種外匯/商品/加密貨幣/股票) 可自訂參數 可自訂顏色 OBOS 級別 漂亮的20儀表板配
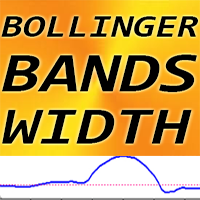
MT4 的外汇指标布林带宽度,无需重新绘制。
-BB 宽度指标适用于与标准布林带指标一起使用。 -每个布林线指标爱好者都必须拥有这个软件,因为它们的组合非常 有效交易突破 -BB 宽度指标显示布林带之间的距离(跨度)。
如何使用 BB 宽度(参见图片示例): 1) 找到最近6个月的BB宽度的最低值,并在该值上加上25%以获得LEVEL。 2) 将 LEVEL 连接到 BB 宽度指示器上。 还将布林带指标附加到图表上。 3)等到价格在布林线指标边界之间持平并且布林带宽度值低于水平 4) 当突破布林带指标边界时(蜡烛应收于布林带之外),检查布林带宽度 - 它应位于水平之上。 5) 在突破方向排列标记订单,在相反的布林线边界上设置止损。 将 TP 最小设置为 SL 的 3 倍(取决于较高时间范围内的支撑/阻力区域)
// 这里提供更多优秀的 EA 交易和指标: https://www.mql5.com/en/users/def1380/seller // 也欢迎您加入盈利、稳定、可靠的信号 https://www.mql5.com/en/signals/1887493 它是仅在
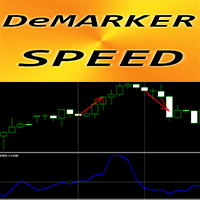
MT4 外汇指标“DeMarker Speed”
该指标的计算基于物理学方程。 DeMarker Speed 是 DeMarker 本身的一阶导数 DeMarker 振荡曲线表示指标计算期间相对于之前高点和低点的当前价格位置 当标准 DeMarker 振荡器处于超卖/超买区域时(如图所示),DeMarker Speed 适合剥头皮入场 DeMarker 速度指示器显示 DeMarker 本身改变方向的速度 - 它非常敏感 如果 DeMarker Speed 指标的值 < 0:速度为负值; 如果 DeMarker Speed 指示器的值 > 0:速度为正值 指示器内置移动和 PC 警报
// 这里提供更多优秀的 EA 交易和指标: https://www.mql5.com/en/users/def1380/seller // 也欢迎您加入盈利、稳定、可靠的信号 https://www.mql5.com/en/signals/1887493 它是仅在该 MQL5 网站上提供的原创产品。

Unveil the Secret to Trading with Joker's TrendMaster!
Ready to outperform the markets with a proven and reliable strategy? Look no further! Introducing Joker's TrendMaster, the revolutionary indicator crafted by Yuri Congia! With Joker's TrendMaster, you'll gain access to a powerful combination of advanced technical analysis and unique strategic insights.
Limited-time Special Opportunity: Seize the moment! Be among the first 10 (Purchasing 1/10) to seize this unique opportunity, and not
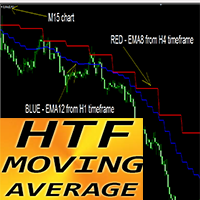
MT4 外汇指标 HTF 移动平均线
使用专业的 MT4 HTF MA 指标升级您的交易方法。 HTF 意味着 - 更高的时间范围 该指标对于具有价格行为条目的趋势交易者来说非常有用。 HTF MA 指标允许您将较高时间范围的移动平均线附加到当前图表。 指标显示较高时间范围内的趋势 --> 这始终是有利可图的方法。 HTF MA 指标提供了以低风险获得巨额利润的机会。
如何使用: 附上从 D1 到 H4 或 H1 图表的 MA 附上从 H4 到 H1、M30 或 M15 图表的 MA 等等(见图)
// 这里提供更多优秀的 EA 交易和指标: https://www.mql5.com/en/users/def1380/seller // 也欢迎您加入盈利、稳定、可靠的信号 https://www.mql5.com/en/signals/1887493 这是仅在该 MQL5 网站上提供的原创产品。

Elevate your trading game with TigerSignals – the ultimate MetaTrader 4 indicator. Designed for simplicity and precision, TigerSignals provides crystal-clear buy and sell signals, making it a must-have for traders of all levels.
Features: User-Friendly: Easy-to-use interface ensures hassle-free integration into your trading strategy. Alerts: Sound, phone, and email alerts. Receive notifications when a new signal appears, giving you the freedom to step away from the chart! Lot Size Calcula

MACD is probably one of the most popular technical indicators out there. When the market is trending, it actually does a pretty good job, but when the market starts consolidating and moving sideways, the MACD performs not so well. SX Impulse MACD for MT5 is available here . Impulse MACD is a modified version of MACD that works very well for trading Forex, stocks, and cryptocurrencies. It has its own unique feature which perfectly filters out the values in a moving average range and enables it t

The indicator show Higher timeframe candles for ICT technical analisys Higher time frames reduce the 'noise' inherent in lower time frames, providing a clearer, more accurate picture of the market's movements.
By examining higher time frames, you can better identify trends, reversals, and key areas of support and resistance.
The Higher Time Frame Candles indicator overlays higher time frame data directly onto your current chart.
You can easily specify the higher time frame candles yo

With one click open any pair any timeframe directly from dashboard The MA Speedometer Dashboard is a highly functional MetaTrader 4 (MT4) indicator designed to enhance trading strategies through dynamic market analysis. It offers robust features for identifying market trends, trading in sideways markets, and exiting flat market conditions, all based on moving average angles. As a special bonus, customers also receive a special version of the MA Speedometer indicator, which serves as the foundati

Waddah Explosion Scanner Features : Waddah Trend, Explosion Increase/Decrease Trend Percentage with Threshold DeadZone Trend Direction Aligned Checks Highlight and Alerts Multi-Timeframe & Multi-Currency Detailed Product Description and Free Demo: https://abiroid.com/product/abiroid-waddah-scanner/
Customizable Threshold: With customizable threshold, you can identify best trading opportunities in volume-based trading. Use Trend Height (x times Explosion) : Trend height in relation to the exp
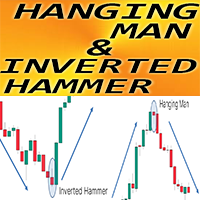
MT4 外汇指标“上吊线和倒锤形态”
“上吊线和倒锤形态”指标对于价格行为交易来说是非常强大的指标:无需重绘,无延迟; 指标检测图表上看涨的倒锤线和看跌的吊线形态: 看涨倒锤子 - 图表上的蓝色箭头信号(参见图片) 看跌上吊线 - 图表上的红色箭头信号(见图) 包括 PC、移动设备和电子邮件警报 指标“上吊线和倒锤形态”非常适合与支撑/阻力位结合使用: https://www.mql5.com/en/market/product/100903
// 这里提供更多优秀的 EA 交易和指标: https://www.mql5.com/en/users/def1380/seller // 也欢迎您加入盈利、稳定、可靠的信号 https://www.mql5.com/en/signals/1887493 它是仅在该 MQL5 网站上提供的原创产品。

Auto Multi Channels VT Ещё один технический индикатор в помощь трейдеру. Данный индикатор, автоматически показывает, наклонные каналы в восходящем,
нисходящем и боковом движении цены, т.е. тренды. (Внутри дня. Среднесрочные и долгосрочные, а также Восходящие, нисходящие и боковые).
О понятии Тренд. На бирже, трендом называется направленное движение ценового графика в одну из сторон (вверх или вниз) . То есть, тренд в трейдинге — это ситуация,
когда цена определенное время возрастает или

Introducing the Ultimate Horizontal Line Alert Indicator for MT4! Transform your trading with the smartest tool in the market. Our Horizontal Line Alert Indicator isn't just any indicator — it's your new trading partner that combines precision, flexibility, and intuitive control. What Does It Do? This revolutionary MT4 indicator automatically adjusts trend lines to be horizontal with just the press of the 'L' key. It’s perfect for traders who want to focus on specific price levels, ensu

MT4 外汇指标 HTF MACD 振荡器
HTF 意味着 - 更高的时间范围 MACD指标本身是趋势交易最流行的指标之一 该指标非常适合具有价格行为条目或与其他指标结合使用的多时间框架交易系统 HTF MACD 指标允许您将较高时间范围的 MACD 附加到您当前的图表 --> 这是专业的交易方法 指示器内置移动和 PC 警报 ............................................................................................................ // 这里提供更多优秀的 EA 交易和指标: https://www.mql5.com/en/users/def1380/seller // 也欢迎您加入盈利、稳定、可靠的信号 https://www.mql5.com/en/signals/1887493 这是仅在该 MQL5 网站上提供的原创产品。
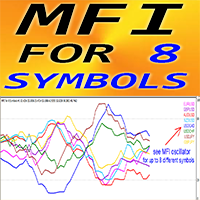
MT4 的外汇指标“MFI for 8 Symbols”。
资金流量指数 (MFI) 是一种技术振荡指标,它使用价格和交易量数据来识别超卖和超买区域 当 MFI 高于 80 时,最好从超买中获取卖出条目,而当 MFI 低于 20 时,从超卖中获取买入条目 MFI 对于分歧检测非常有用,与价格行为结合起来也很棒 “8 个交易品种的 MFI”提供了在 1 个图表上控制最多 8 个不同交易品种的 MFI 值的机会 MFI 振荡器提供有关看涨和看跌价格动量的信息
// 这里提供更多优秀的 EA 交易和指标: https://www.mql5.com/en/users/def1380/seller // 也欢迎您加入盈利、稳定、可靠的信号 https://www.mql5.com/en/signals/1887493 这是仅在该 MQL5 网站上提供的原创产品。
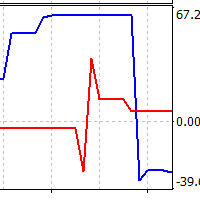
Two lines are being drawn in a separate window. And both are representing an angle of a trendline. One trendline is measured going across two price highs, but the other is measured across two lows. You get to choose the period from which the first price high and first price low is being determined. The second high and low comes from identical time period preceding the first one. Feel free to experiment with the period count until you get the confirmation you are looking for.

TrendWave Oscillator is an advanced MT4 oscillator that not only identifies the trend direction but also provides visual and audio alerts to enhance trading strategies.
Key Features: - Color-coded trend indication: - Blue : Indicates an uptrend, signaling potential price growth. - Orange : Indicates a downtrend, suggesting possible price decline. - Gray : Represents a flat market or lack of clear entry signals.
- Graphical signals on the chart : - Aqua : Highlights an uptrend, empha
AlphaTrend AM is an indicator that allows you to open a position at the very beginning of a significant price movement. The second most important quality of the indicator is the ability to follow the trend as long as possible in order to obtain all potential profits while minimizing potential losses. The indicator allows you to notify the user about your signals by sending messages to the terminal and e-mail. This indicator does not repaint or not recalculate.
The indicator is a synthesis of t
MetaTrader市场是独有的自动交易和技术指标商店。
阅读MQL5.community用户备忘更多地了解我们提供给交易者的独特的服务:复制交易信号,自由职业者开发的自定义应用程序,通过支付系统完成的自动付款和MQL5云网络。
您错过了交易机会:
- 免费交易应用程序
- 8,000+信号可供复制
- 探索金融市场的经济新闻
注册
登录