Regardez les tutoriels vidéo de Market sur YouTube
Comment acheter un robot de trading ou un indicateur
Exécutez votre EA sur
hébergement virtuel
hébergement virtuel
Test un indicateur/robot de trading avant d'acheter
Vous voulez gagner de l'argent sur Market ?
Comment présenter un produit pour qu'il se vende bien
Indicateurs techniques payants pour MetaTrader 4 - 108
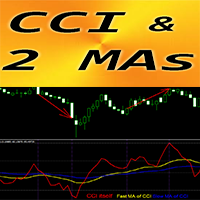
Forex Indicator "CCI and 2 Moving Averages" for MT4 Commodity Channel Index (CCI) is excellent for Momentum trading into the trend direction. " CCI and 2 Moving Averages" Indicator allows you to see Fast and Slow Moving Averages of CCI indicator Up trend - Fast MA is above Slow one; Down trend - Fast MA is below Slow one CCI is one of the most popular oscillators for trading - it measures the difference between the current price and the historical average price
Option#1 - Ope
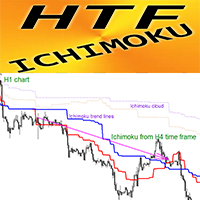
Forex Indicator HTF Ichimoku for MT4 Ichimoku indicator is one of the most powerful trend indicators . H TF means - H igher Time Frame This indicator is excellent for Trend Traders as well as combination with Price Action entries. HTF Ichimoku Indicator allows you to attach Ichimoku from Higher time frame to your current chart. Up trend - red line above blue one (and both lines are above cloud) / Down trend - red line below blue one (and both lines are below cloud) Open BUY orders

See what's happening across the entire market in different time frames with just a glance! This fully-responsive dashboard enables you to understand the current situation of the market without needing to check different charts. It visualizes the current value of three standard-scaled indicators (RSI, Stochastic and ADX) for your preferred symbol and time frames. You can even design some new trading strategies based on the insights it provides.
Key features: Clicking on each dashboard cell ope

Forex Indicator INSIDE Bar Pattern for MT4 Indicator " INSIDE Bar " is very powerful indicator for Price Action trading Indicator detects INSIDE Bar patterns on chart: Bullish INSIDE Bar - Blue arrow signal on chart (see pictures) Bearish INSIDE Bar - Red arrow signal on chart (see pictures) No repaint; No delays; High R/R ratio (reward/risk); PC, Mobile & Email alerts are included Indicator " INSIDE Bar Pattern" is excellent to combine with Support/Resistance Levels: htt
Based on unique formulas and calculations, this indicator analyses every price move on the chart and highlight then apply its unique formulas on them to indicate the currently dominant direction. This indicator works on all instruments but best with GOLD (XAUUSD). It can also work as an entry confirmation tool and can also serves highlighting the worthy and noticeable moves on the chart. The Oppo Signals Indicator can work alongside any other strategy and can also help traders devise their own

Heiken Ashi Histo Filter - is great & efficient auxiliary trading tool! Advanced new calculation method is used - 10 options for parameter "Price for calculation" Excellent to combine with Price Action patterns Green color histogram - Look for Bullish entries Magenta color histogram - Look for Bearish entries There are plenty of opportunities to upgrade even standard strategies with this indicator Indicator has built-in Mobile, PC and Email alerts
// More great Expert Advi

The indicator is based on the calculation of liquidity on the market and thus shows where the market can most likely turn.. It shows the places of liquidity where the price will reach sooner or later... The indicator can be set to several types of liquidity and therefore can display several levels on the graph.. It is a unique tool that can help you very well in your trading The indicator is suitable for currency pairs with the most liquidity (EURUSD/GBPUSD...)

Once upon a time, in the bustling streets of Gotham City, there lived a mysterious figure known only as the Joker. With his enigmatic grin and unpredictable nature, the Joker roamed the city's financial district, leaving chaos and uncertainty in his wake. One fateful day, a group of traders stumbled upon a peculiar artifact hidden deep within the dark alleys of Gotham. It was a cryptic indicator known as the "Joker Arrow," rumored to possess the power to predict market movements with uncanny acc

このインディケータはモーメンタムを裁量およびEAで実際に利用してきた私自身の経験から、より手軽に、かつ効果的に活用できるよう作成された裁量トレード用サインツールです。比較的短期のトレンドフォローに強み発揮し、高い頻度でサインを発信する特徴があります。
ブレイクアウトでの順張り、リバウンドでの逆張りの両面で利用でき、各種のフィルター機能でより精度の高いサインを発信します 勝敗判定機能により、このインディケータの直近の相場環境に対する有効性を確認できます 全通貨ペア、全タイムフレームで利用できます。リペイントはしません
設定項目は下記のとおりです。 Entry Mode...モーメンタムの基準値にタッチした際のシグナルの方向です。Breakout(順張り), Rebound(逆張り)のどちらかを指定します Momentum Level ...モーメンタムの基準値です Momentum Period Momentum Bars (1-5) ...指定した数で連続して基準値を上回った場合に シグナル を発信します Trend Filter...下で設定する移動平均のトレンド方向でのシ

Part One : Characteristics Integrated line drawing and wave marking function Automatic adsorption( namely Auto Search High/Low )during Drawing Draw zigzag Lines and Fibo/Expansion at the same time Calculate the scale rate of Interval Spans which is called Qjt for short Continuously delete objects by click Deleting drawings in batch Show/Hide Drawings and Wave-Marks Quickly save current chart as picture to certain folder Show/Hide main panel by click certain zone of PriceAxis or by hotkey W Swi
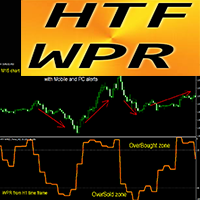
Powerful Forex Indicator HTF WPR Oscillator for MT4 Upgrade your trading methods with the professional HTF WPR Oscillator for MT4. H TF means - H igher Time Frame WPR is one of the top oscillators for scalping This indicator is excellent for Multi-Time Frame trading systems with Price Action entries from OverSold/Bought areas . HTF WPR Indicator allows you to attach WPR from Higher time frame to your current chart --> this is professional trading approach Indicator
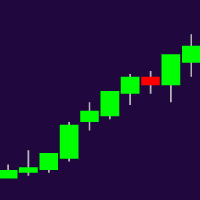
Higher Timeframe Chart Overlay will display higher timeframe candles, including the number of candles high/low you specify.
You no longer need to switch timeframes to check the candles. Everything can be shown in one chart. MT5 Version : https://www.mql5.com/en/market/product/115682 Almost everything can be change as you want. You can change/set:
- Choose different colors for the body and top/bottom wicks.
- Panel's height and width.
- The width of the body and wicks
- Change backgro

First of all, it is worth highlighting here that this Trading Indicator is Non Repainting, Non Redrawing and Non Lagging, which makes it ideal for manual trading. Never repaint and recalculate Once an arrow appears it never disappears, the signal comes at the opening of the new candle You will now be more profitable with this indicator The indicator will alert you when an arrow appears You can do swing trading or scalping trading The indicator helps you identify the trend Can be optimized acros
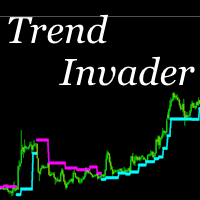
This indicator is very simple. It tracks the trend and leads it until it changes. You can also set or trail a stop using this indicator. The indicator is equipped with the ability to track older trends on lower charts. Optimal use is achieved by using this indicator together on the current and senior charts. Write after purchase to receive personal recommendations.

The indicator plots key levels automatically for XAUUSD.
The indicator doesn't give any trading signals.
It can be used to enhance your current strategy. (Please see screenshots)
The color, line style and thickness can be adjusted as preferred.
Symbol: XAUUSD Timeframe: H1 and below
Please note the levels are not always a 100% accurate.
Enjoy! ------------------------------------------

Gold Level MT4
A great helper for trading Gold.
Levels do not repaint and do not change their data We recommend using it with the indicator - Professional Trade Arrow
Levels are built every day, so you will trade every day with the indicator.
Gold Level.
Price markups are shown on the chart, after reaching TP1 or SL1, close half of the position, and the rest is transferred to breakeven.
Any questions? Need help?, I am always happy to help, write me in private messages or in telegram.

The indicator plots key levels automatically for BTCUSD.
The indicator doesn't give any trading signals.
It can be used to enhance your current strategy. (Please see screenshots)
The color, line style and thickness can be adjusted as preferred.
Symbol: BTCUSD Timeframe: H1 and below
Please note the levels are not always a 100% accurate.
Enjoy! --------------------------------------------

The indicator plots key levels automatically for EURUSD.
The indicator doesn't give any trading signals.
It can be used to enhance your current strategy. (Please see screenshots)
The color, line style and thickness can be adjusted as preferred.
Symbol: EURUSD Timeframe: H1 and below
Please note the levels are not always a 100% accurate.
Enjoy! ------------------------------------------

TRADE THE BREAKOUTS like Gordon Gekko Gordon Gekko, the ruthless and iconic character from the movie "Wall Street," is renowned for his aggressive and opportunistic trading strategies. When it comes to trading breakouts, Gekko embodies the mindset of a savvy and relentless trader who seizes every opportunity to capitalize on market movements. In Gekko's trading playbook, spotting breakout opportunities is akin to identifying potential gold mines in the market. He meticulously scans the charts
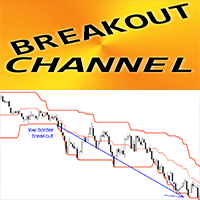
Forex Indicator BREAKOUT CHANNEL for MT4, No Repaint This indicator can be used as complete trading system based on High/Low breakouts It has just 1 parameter - HYSTORY DEPTH, it reflects the number of candles which are taken into consideration by indicator Parameter HYSTORY DEPTH recommended values: timeframe D1 - 20 (one month), H4 - 30 (one week), H1 - 24 (one day) BREAKOUT CHANNEL consist of 3 lines: High Border - max price of last N ( HYSTORY DEPTH parameter) candles, Low Border -

Découvrez la puissance de l'analyse des volumes avec notre indicateur de profil de volume pour Metatrader ! / Version MT5
Basic Volume Profile est un indicateur spécialement conçu pour les traders manuels qui cherchent à optimiser leur trading. L'indicateur Volume Profile est un outil essentiel pour tout trader sérieux cherchant à mieux comprendre le comportement du marché. Grâce à notre solution innovante, vous pouvez visualiser de manière claire et concise la manière dont le volume des tran
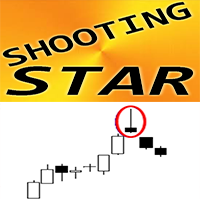
Forex Indicator " Shooting Star pattern" for MT4 Indicator " Shooting Star pattern " is very powerful indicator for Price Action trading : No repaint, No delays; Indicator detects bearish Shooting Star patterns on chart: Red arrow signal on chart (see pictures) P C, Mobile & Email alerts are included Indicator " Shooting Star pattern" is excellent to combine with Support/Resistance Levels: https://www.mql5.com/en/market/product/100903 // More great Expert Advisors and Ind
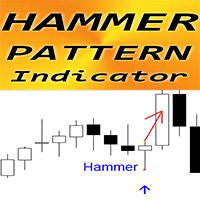
Forex Indicator " Hammer pattern" for MT4 Indicator " Hammer pattern " is very powerful indicator for Price Action trading : No repaint, No delays; Indicator detects bullish Hammer patterns on chart: Blue arrow signal on chart (see pictures) P C, Mobile & Email alerts are included Indicator " Hammer pattern" is excellent to combine with Support/Resistance Levels: https://www.mql5.com/en/market/product/100903 // More great Expert Advisors and Indicators are available here:
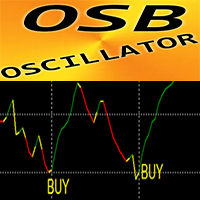
OSB Oscillator - is advanced custom indicator, efficient Price Action auxiliary tool! Advanced new calculation method is used. New generation of Oscillators - see pictures to check how to use it. OSB Oscillator is auxiliary tool to find exact entry points for Price Action, Divergence and Oversold/OverBought signals Oversold values: below 30 Overbought values: over 70 There are plenty of opportunities to upgrade even standard strategies with this indicator. It is much faster and more accurate

This is a correlation hedge type indicator which helps trade the obscure relationship between crude oil and natural gas markets. Which is overall an unknown trading concept to most traders, yet a very impressive one. The usual market risk is mittigated through the smooth trend of hedge tading, as well as the leading signals the indicator provides!
Pros: low risk trading, normal profits, no need to be right about either market
Cons: requires large capital
----------------------------------

"Awesome Market Prediction" is a revolutionary indicator designed to provide accurate and sophisticated market predictions to traders. Developed with cutting-edge technology and intelligent algorithms, this indicator offers deep insights into future market movements. Key features of "Awesome Market Prediction" include: High Accuracy Predictions : Utilizing in-depth data analysis and advanced prediction techniques, this indicator delivers highly accurate estimates of market direction. Multiple Ma

MASONS est un outil qui fait de vous un analyste professionnel! La méthode de détermination des mouvements d'onde à l'aide de canaux inclinés, transmet qualitativement le schéma du mouvement de n'importe quel instrument,montrant non seulement les Inversions possibles sur le marché,mais aussi les objectifs des mouvements ultérieurs!Détruit le mythe selon lequel le marché est vivant ,montrant clairement le schéma des mouvements d'une gamme à l'autre! Outil professionnel, adapté à la perspective à
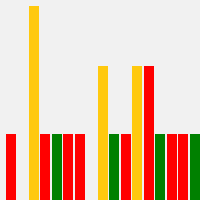
I'm excited to introduce you to the fifth bar on Martin Armstrong's Forecast Array - The Trading Cycle .
This innovative tool represents a transverse form of cyclical frequency analysis, offering a unique perspective on market trends.
The model employs a color-coded system for easy interpretation. In this model, green signals the ideal timing for highs, red indicates ideal lows, and yellow signifies a convergence of highs and lows occurring simultaneously. This intuitive approach allows
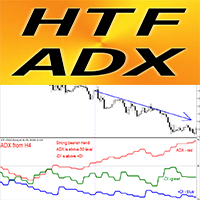
Forex Indicator HTF ADX for MT4 Upgrade your trading methods with the professional HTF ADX indicator for MT4. H TF means - H igher Time Frame ADX (red line) is used to measure trend strength - if ADX value is above 30 and has upstairs shape - trend is strong If the +DMI (blue line) is above the -DMI (green one): price is moving up, and ADX measures the strength of the uptrend If the -DMI (green line) is above the +DMI (blue one) : price is moving down, and ADX meas
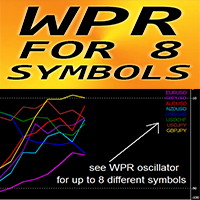
Forex Indicator "WPR for 8 Symbols" for MT4, No repaint WPR itself is one of the best oscillators for scalping It is great to take Sell entries from strong OverBought zone (above -10) and Buy entries from strong OverSold zone (below -90) "WPR for 8 Symbols" gives opportunity to control WPR values of up to 8 different symbols just on 1 chart
This indicator is excellent to combine with Price Action entries from OverSold/Bought areas as well . // More great Expert Advisors and
This indicator informs the user when the ATR is above a certain value defined by the user, as well as when the ATR prints a percentage increase or percentage decrease in its value, in order to offer the user information about the occurrence of spikes or drops in volatility which can be widely used within volatility-based trading systems or, especially, in Recovery Zone or Grid Hedge systems. Furthermore, as the volatility aspect is extremely determining for the success rate of any system based o
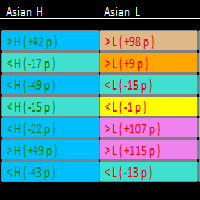
This scanner works with the other "Smart Market Structure Opportunity Scanner", and is basically an extension of that scanner with added features to find more accurate entry opportunities for day trading or refined swing trading. The most important added features are: 1) The ADRs ( Average Daily Range ) for the last 5 days would have color and +/- sign that shows the direction of each days ADR move. 2) I added RSI values for each of the trading timeframes ( 1min, 5min, 15min, 30min, 60m
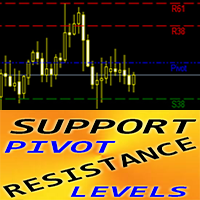
Forex Indicator "Pivot Support Resistance Levels Day Week Month" for MT4 Indicator " Pivot SR Levels D_W_M " is a very powerful auxiliary indicator for Price Action trading This particular indicator is using Fibonacci numbers in calculation. Pivot Levels are calculated as an average of significant prices from the performance of a market in the prior trading period Pivot Levels itself represent levels of highest resistance or support, depending on the overall market condition Indicator "

Description of work
The 'MA7 Clover' indicator is based on candle shapes. Shows the 'Pin Bar' candle pattern. Detailed information about the 'MA7 Clover' indicator.
Indicator settings
General settings: Min body size ; Max body size ; Min nose size ; Max nose size .
Message settings: Send message to the terminal (Alert) – permission to send messages to the terminal using the Alert function; Send message to the mobile terminal (Push) – permission to send messages to the mobile terminal using
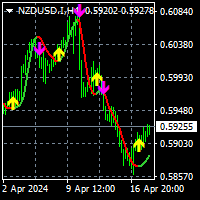
To download MT5 version please click here .
- This is the exact conversion from TradingView: " PA-Adaptive Hull Parabolic " By "Loxx".
- This is a non-repaint and light processing load indicator
- You can message in private chat for further changes you need.
- All input options are available except candle coloring.
- Buffers are available for processing within EAs.
L'indicateur RSI Pro Analyser est un outil puissant conçu pour les traders cherchant à prendre des décisions éclairées sur plusieurs unités de temps simultanément. Cet indicateur utilise le RSI pour fournir des signaux de surachat, de survente et de tendance , facilitant ainsi l'identification des opportunités d'entrée sur le marché. Son principal atout est sa facilité de lecture grâce à son code couleur clairs et distincts pour indiquer différentes conditions de marché. L'indicateur affiche le
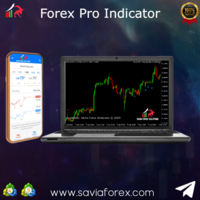
Savia Forex Pro Indicator The Savia Forex Solutions Forex Pro Indicator gives you highly accurate entries on all Forex/Currency pairs, Indices and Cryptocurrencies. The Forex Pro Indicator is dynamic and powerful and is optimized for all timeframes and ALL Currency pairs, Indices, Commodities, and Cryptocurrency pairs. Trade with improved confidence and maximize your success rate. Benefits Dynamic and Powerful FRP is fully optimized for all chart timeframes FMPL works with any asset. It can be

Avec cet outil de trading, vous pouvez analyser 15 marchés simultanément.
Présentation du nouvel indicateur de trading 2024 :
️ Tableau de bord multi-devises multi-périodes stochastiques.
Il y a au moins deux raisons pour lesquelles j'ai créé cet outil de trading :
Premièrement, j'en ai marre de n'observer qu'un seul marché. Deuxièmement, je ne veux pas perdre le moment d’entrée sur un autre marché.
C'est pourquoi je souhaite connaître en même temps les autres conditions du marché.

This Fibonacci Indicator is showing fibo retracement lines on chart same as the default tool from Metatrader's menu, except this one is fully automatic and changes along with the chart (with modes B and C, then mode A is always fixed by set levels)
AND it also offers the line levels for the Expert Advisors to read (buffers) , so you can set your trades based on crossover\crossunder on those fibo lines.
You can choose from 3 modes for selecting the max HIGH and min LOW limit,
and you can set
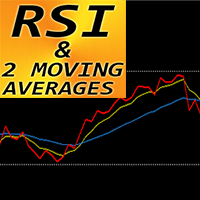
Forex Indicator "RSI and 2 Moving Averages" for MT4 This indicator is excellent for Momentum trading systems . " RSI and 2 MAs" Indicator allows you to see Fast and Slow Moving Averages of RSI itself Indicator gives opportunities to see the trend change very early " RSI and 2 MAs" can be used to catch the momentum into the trend direction It is very easy to set up this indicator via parameters (see the picture) Indicator can be used on any time-frame // More great Expert Advisors and I

The Forex Correlation Indicator is a powerful tool designed to analyze and display the correlation between different major forex pairs in the market. This indicator helps traders identify relationships and trends between currency pairs, allowing for more informed trading decisions. Key Features: Displays correlation coefficients between pairs. Visualizes correlation strength through color-coded indicators. Customizable settings for timeframes and correlation calculations. User-friendly interfac
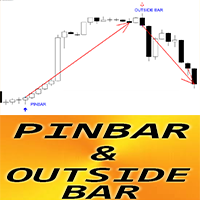
Forex Indicator " Pin Bar & Outside bar Patterns" for MT4 Indicator " Pin Bar & Outside Bar Patterns " is very powerful for Price Action trading Indicator detects Pin Bar and Outside bar Patterns on chart: Bullish pattern - Blue arrow signal on chart (see pictures) Bearish pattern - Red arrow signal on chart (see pictures) No repaint; No delays; with PC, Mobile & Email alerts Indicator "Pin Bar & Outside Bar Patterns " is excellent to combine with Support/Resistance Levels:

The Forex indicator TrendNavigator is a technical indicator. TrendNavigator is a tool that allows traders employing this strategy to better understand what is happening in the market and predict in which direction the price will continue to move. The indicator's values are calculated based on price movements of the currency pair or any other financial asset. Within the scope of technical analysis, the TrendNavigator indicator is used by traders to forecast future price values or the overall

The Trend Seeker indicator is perfectly suited for tracking long-term trends in the Forex market and can be used without restrictions on instruments or time intervals. This indicator allows attempting to forecast future values, but its main application lies in generating buy and sell signals. The AlphaTrend Seeker tracks market trends, disregarding sharp fluctuations and noise around the average price. It is based on the idea of technical analysis, asserting that the market has a cyclical n

Keltner Trend Pro - Unleash the Power of Price Action! Are you ready to transform your trading approach? Meet Keltner Trend Pro, an Expert Advisor meticulously crafted to harness the dynamic movements of the market using the renowned Keltner Channel and Average True Range (ATR) indicators. Limited-time Special Opportunity: Seize the moment! Be among the first 10 (Purchasing 9/10) to seize this unique opportunity, and not only will you acquire a top-tier trading algorithm but also enjoy an exclu
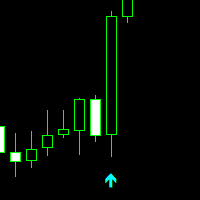
Professional Trade Arrow
Non-repaint MT4 technical indicator.
works on all timeframes 1 minute to the monthly timeframe
the trade vision buy and sell arrow is a multi currency and synthetic indicator
Aqua arrow look for selling opportunities
Crimson arrow look for buying opportunities.
wait for candle to close and arrow to appear before taking any trades.
Settings: Key value - 3.0 ( This parameter is adjusted for a better signal.) We recommend a trend indicator - Trend

The "Trend Tandem" indicator is a trend analysis tool in financial markets that helps traders determine the direction of price movement.
Options:
RISK: Determines the level of risk taken into account in the trend analysis. The higher the value, the more aggressively volatility is taken into account. SSP (SSP Period): Defines the period of the moving average used to identify a trend. The higher the value, the smoother the trend signal will be. CountBars: Determines the number of bars on whic

The "Trend Api" indicator is an innovative tool for trend analysis in the Forex market. It has unique features and a wide range of settings that will help traders make informed decisions when trading.
This indicator is based on the analysis of the market trend and helps to identify the direction of price movement. It uses various mathematical algorithms and statistical methods to determine the strength and sustainability of a trend in the market.
One of the key features of the "Trend Api" i

The indicator has 3 lines: green, blue and red.
Between the blue and green line - bullish channel. Between the blue and the red line - a bearish channel.
In addition, there is a signal line that moves inside the channel. This line changes colour from green to red and vice versa, thus indicating what the sentiment of the market is.
The strategy is easy to follow.
When you are in the bullish channel and get a green signal line it is a signal of buying. When you are in a bearish channel
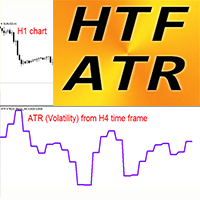
Forex Volatility Indicator HTF ATR for MT4 Average True Range itself is one of the most impotrant indicators for traders - it shows market volatility H TF ATR is a market volatility indicator used in technical analysis . HTF means - H igher Time Frame ATR is great to plan your dynamic Take Profits / SL locations: For example most optimal SL values are located in 1.2-2.5 ATR values This indicator is a useful tool to add to any trading system HTF ATR Indicator allows you t
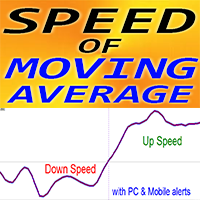
Forex Indicator "MA Speed" for MT4, No Repaint. SPEED of Moving Average - is unique trend indicator The calculation of this indicator is based on equations from physics . Speed is the 1st derivative of Moving average MA Speed indicator shows how fast MA itself changes its direction There are plenty of opportunities to upgrade even standard strategies with MA Speed . Suitable for SMA, EMA, SMMA and LWMA It is recommended to use MA Speed in trend strategies , if indic
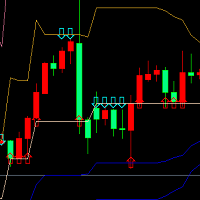
Cet indicateur est basé sur la théorie de la partition de l'or, respectivement pour obtenir les 22 derniers (par défaut) racine K - line Haut Bas, et par le calcul du coefficient de partition de l'or pour obtenir le support, la courbe de pression. Lorsque le prix se rapproche de la ligne de pression pour la première fois, ou plusieurs fois près de la ligne de pression, il y aura une flèche vers le bas pour se conformer, il y a une pression, il est approprié de faire du Short Sell; Lorsque le pr
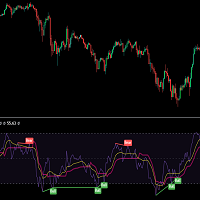
MOST is applied on this RSI moving average with an extra default option added VAR/VIDYA (Variable Index Dynamic Moving Average)
MOST added on RSI has a Moving Average of RSI and a trailing percent stop level of the Moving Average that can be adjusted by changing the length of the MA and %percent of the stop level.
BUY SIGNAL when the Moving Average Line crosses above the MOST Line
LONG CONDITION when the Moving Average is above the MOST
SELL SIGNAL when Moving Average Line crosses belo
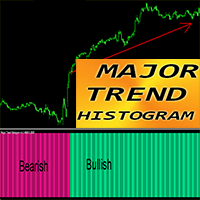
Forex Indicator "Major Trend Histogram" for MT4 Major Trend Histogram indicator designed to catch really huge trends Indicator can be in 2 colors: DeepPink for bearish trend and SpringGreen for bullish one (colors can be changed) It detects trends on the beginning stages - way more efficient than any standard MA cross M ajor Trend Histogram can be combined with any other trading methods: Price Action, VSA, other indicators Indicator has built-in Mobile and PC alerts
// More great Exper
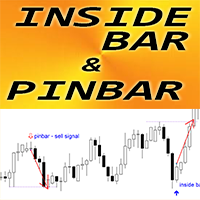
Forex Indicator " Inside Bar & PinBar Patterns" for MT4 Indicator " Inside Bar & PinBar Patterns " is very powerful for Price Action trading Indicator detects Inside Bar and PinBar Patterns on chart: Bullish pattern - Blue arrow signal on chart (see pictures) Bearish pattern - Red arrow signal on chart (see pictures) No repaint; No delays; Inside Bar itself has High R/R ratio (reward/risk) with PC, Mobile & Email alerts Indicator " Inside Bar & PinBar Patterns " is excellent t

MA Trend Following Indicator for MT4 is a simple technical analysis tool designed to follow the trend in any currency pair chosen by the trader by combining 3 moving averages on two different time frames, one long term and one short term.
It basically provides a bullish or bearish signal when the moving averages on one time frame align with the moving averages on a different time frame to have a confluence signal.
The indicator is presented as a screener with multiple currency pairs (that
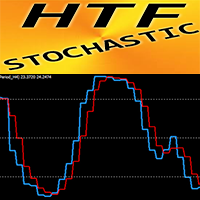
Forex Indicator HTF Stochastic for MT4 Stochastic oscillator is one of the best indicators on the market - perfect tool for many traders. H TF means - H igher Time Frame OverBought zone - above 80; OverSold one - below 20 HTF Stochastic indicator is excellent for Multi-Time Frame trading systems especially with Price Action entries. This Indicator allows you to attach Stochastic from Higher time frame to your current chart --> this is professional trading approach I n

MAXLUM SYSTEM is a Trading System that uses anti-Margin Call without using SL with a positive correlation Hedging Strategy
Simple example of BUY on EURUSD and SELL on GBPUSD at the same time This kind of trading will not occur as a Margin Call By calculating the GAP difference between the 2 pairs we can take advantage of the GAP
This indicator will be more effective if you use Data Analysis Please join the Maxlum System Telegram group for details
Recommended Pair NZDUSD - AUDUSD EURUSD -

Even when most brokers will give you a historic list of all your trading, with the time of the entry, if it was a sell, or a buy, the profit or loss, which is good.
It won't tell you:
Why did you enter the market? so you won't be able to determine if you followed your trading rules, or if you break all your rules and entered the market in a whim or feeling.
Trading is a learning skill, so you have to evaluate your trading performance at the end of your day.
In order to learn what things
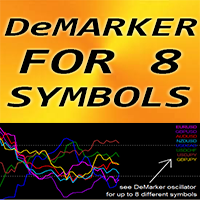
Forex Indicator "DeMarker for 8 Symbols" for MT4, No repaint DeMarker oscillator curve indicates the current price position relative to previous highs and lows during the indicator calculation period DeMarker provides the most efficient regular divergence signals among other oscillators It is great to take Sell entries with regular divergence in OverBought zone (above 0.7) and Buy entries with regular divergence in OverSold zone (below 0.3) "DeMarker for 8 Symbols" gives oppo

The Forex Trend Scanne r is a powerful tool designed to revolutionize currency strength analysis. It caters to traders of all levels, offering guidance on what to trade and in which direction. This versatile model allows users to include any currency-related symbol, such as Gold (XAU/USD), Silver (XAG/USD), and even Bitcoin (BTC/USD). With compatibility across all time frames and default settings covering 28 major pairs, it provides comprehensive insights for informed trading decisions. Whether
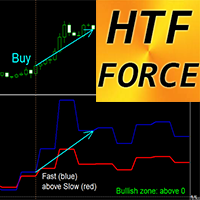
Forex Indicator HTF Force Oscillator for MT4 HTF Force is powerful indicator for Multi-Time Frame trading . HTF means - H igher Time Frame Force index is one of the top indicators that combines price and volume data into a single value Values from High time frame can show you the trend direction (downtrend - below 0; uptrend - above 0) Fast Force - Blue line, Slow Force - Red line Buy signal - Fast line crosses Slow line upward and both - above 0 (see picture) Sell signal - Fast line cr
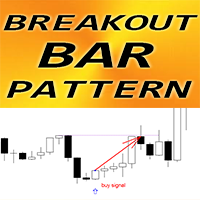
Forex Indicator " Breakout Bar pattern" for MT4 Indicator "Breakout Bar pattern" is very powerful indicator for Price Action trading: No repaint, No delays; Indicator detects Breakout Bar patterns on chart: Bullish Breakout Bar pattern - Blue arrow signal on chart (see pictures) Bearish Breakout Bar pattern - Red arrow signal on chart (see pictures) with P C, Mobile & Email alerts Indicator " Breakout Bar pattern" is excellent to combine with Support/Resistance Levels : htt

Direct translation of blackcat's L3 Banker Fund Flow Trend Oscillator. Get push notifications on your phone app when a signal bar has formed. Historical signals are shown with a red checkmark right on the main chart. Indicators uses two data calculations to check for a positive cross below 25% level. Long signals only! For any further questions feel free to contact me directly. Including requests for product improvements.
Working with the Channel Motion Tracker indicator is as simple as possible. Just react to the arrows that the indicator displays. Each arrow represents an explicit command to action. The signals generated by this indicator are accurate enough to allow you to trade based on this information.
One of the main advantages of the indicator is its ability to build high-quality channels and generate signals for entering the market. This is great for the trader who always finds it difficult to choose

The Tripl indicator is designed to visually display the current trend in the market. One of the key aspects of currency market analysis is identifying a trend, which is a stable direction in which prices are moving. For this purpose, the Tripl indicator uses calculations that smooth out sharp fluctuations that do not have a significant impact on the overall trend of price movements.
A trend can be either upward (bullish) or downward (bearish). Most often, a trend develops for a long time befo

With the growth of information technology and the increasing number of participants in financial markets, traditional analysis tools are becoming less effective. Conventional technical indicators, such as the moving average or stochastic, in their pure form are unable to accurately determine the direction of the trend or its reversal. Is it possible to find an indicator that remains effective for 14 years without changing its parameters, and at the same time adapts to market changes? Yes, such
Le Smart Volume Tracker est un indicateur conçu pour fournir un aperçu du sentiment du marché en présentant visuellement les données de volume acheteur et vendeur dans une fenêtre dédiée. Cet outil intuitif aide les traders à identifier rapidement où se concentre l'activité d'achat et de vente, leur permettant ainsi de prendre des décisions de trading plus éclairées.
Avec Smart Volume Tracker, vous pouvez facilement évaluer si le marché penche vers une tendance haussière ou baissière. Il mont
Dynamic Arc is a non-redrawing channel indicator based on the use of double smoothing moving averages. The difference between the Dynamic Arc indicator and other channel indicators such as Bollinger Band is that it uses double smoothed moving averages. This allows you to more accurately determine the direction of market movement, but makes the indicator less sensitive. However, thanks to double smoothing, it provides a clearer and more stable representation of channels on the chart, which helps

The PERFECT TREND HIT creates BUY and SELL perfect trend arrow signals based on ADX EMA AND RSI And all filters inbuilt with accurate trend entries. Furthermore, the indicator and template display the trend direction, strength, and trade recommendation for independent price charts. ROCK WITH THE TREND Moreover, it shows the final trade recommendation to BUY or SELL with all filters and displays that information as arrow signals and pop up in the chart. The indicator works well for new and
Le MetaTrader Market offre un lieu pratique et sécurisé pour acheter des applications pour la plateforme MetaTrader. Téléchargez des versions démo gratuites de Expert Advisors et des indicateurs directement depuis votre terminal pour les tester dans le testeur de stratégie.
Testez les applications dans différents modes pour surveiller les performances et effectuez un paiement pour le produit que vous souhaitez en utilisant le système de paiement MQL5.community.
Vous manquez des opportunités de trading :
- Applications de trading gratuites
- Plus de 8 000 signaux à copier
- Actualités économiques pour explorer les marchés financiers
Inscription
Se connecter
Si vous n'avez pas de compte, veuillez vous inscrire
Autorisez l'utilisation de cookies pour vous connecter au site Web MQL5.com.
Veuillez activer les paramètres nécessaires dans votre navigateur, sinon vous ne pourrez pas vous connecter.