Fancy Linreg Candles

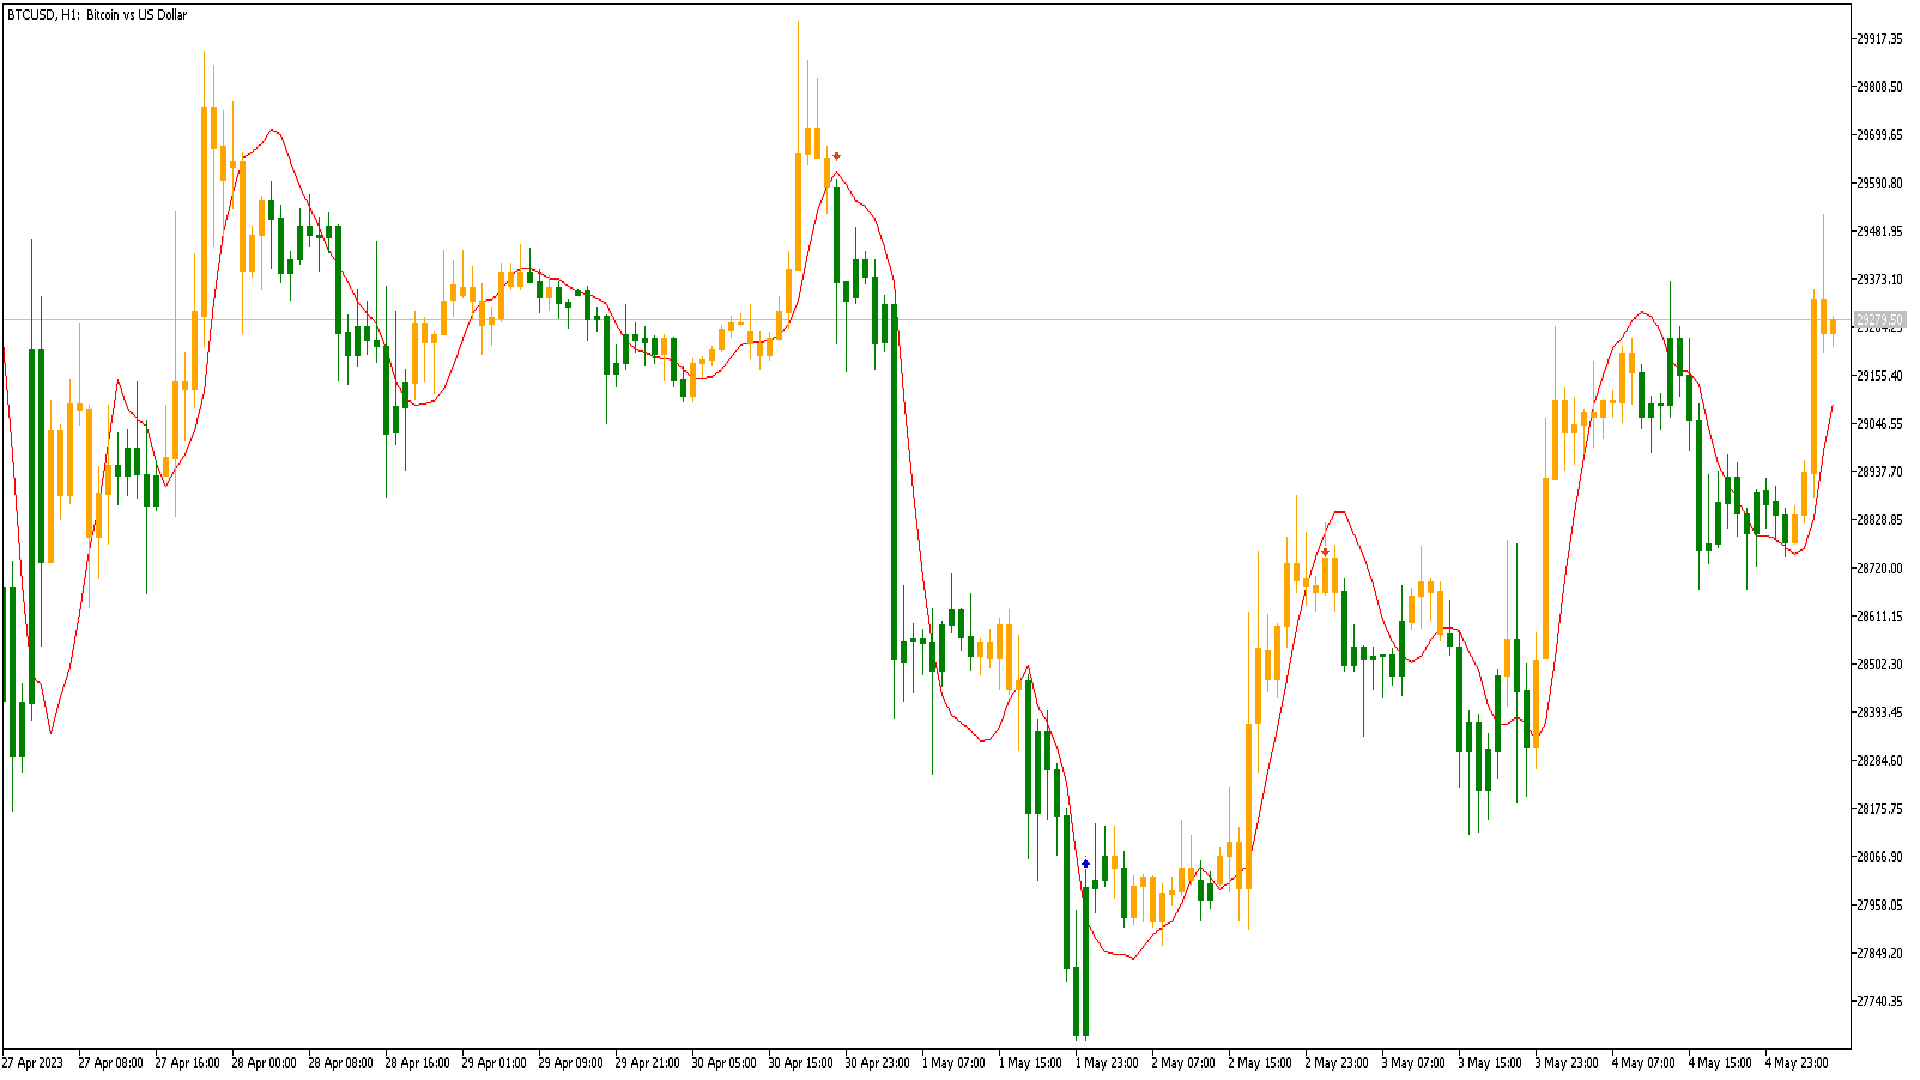
There are many linear regression indicators out there, most of them draw lines or channels, but this one actually draws a chart.
The beauty of the indicator like Heiken Ashi is it removes a lot of market noise.
4 (OHLC) arrays are filled with Linear Regression(LR) values of each price for the LR period (default=14).
The period of the Linear Regression is adjustable dependant on the market conditions. The SMA (default=14) also has period adjustment.
Candles are generated with Green for 'Up' candles (with wicks) and Red for 'Down' candles. An SMA of the LR Close is included because the way this indicator is supposed to be used is as follows;
If the green candles are above the SMA, go long. If the red candles are below the blue SMA, go short. In my opinion, I would use some other exit signal but entries look good for a lagging trend indicator.
Definitely has a Heiken Ashi feel about it.
On the Demo version, just press "start" on the Strategy Tester. 
Try and set the MA to a lower value to closely match the candles. You may need to hide the background bars/candles(use properties) to see it perform better
Рекомендуем также
Простая, но эффектиная система для определения форекс-тренда. Представляет собой два индикатора в одном: Heiken Ashi и Heiken Ashi Smoothed Moving Average (сглаженная скользящая средняя). Heiken Ashi (HA) и Heiken Ashi Smoothed (HAS) рассчитываются в рамках одного события с необходимыми буферами и циклом, повышая скорость их работы, улучшая оптимизацию и эффективность . По вашему выбору на графике могут отображаться одновременно оба индикатра или только один. Входные параметры Display Heiken As
Syntetic Mean Reversion
Danny Giovanni Romero Lozano
Synthetic Mean Reversion The Synthetic Mean Reversion is a technical indicator designed to analyze price momentum and its distance from dynamic equilibrium. It operates in a separate sub-window, offering a normalized view of market extensions and potential exhaustion zones based on price volatility. The indicator measures the difference between the current price and its mean, transforming market data into a visual scale of 0 to 100. This calculation helps identify periods when the price has de
Усовершенствованная версия бесплатного индикатора HMA Trend (для MetaTrader 4), с возможностью статистического анализа HMA Trend - трендовый индикатор, базирующийся на скользящей средней Хала (Hull Moving Average - HMA) с двумя периодами. HMA с медленным периодом определяет тренд, HMA с быстрым периодом - краткосрочные движения и сигналы в сторону тренда Главные отличия от бесплатного варианта: Возможность предсказать вероятность разворота тренда с помощью анализа исторических данных Построение
SMT DIVERGENCE - GOLD vs SILVER (XAUUSD / XAGUSD) All Timeframe MQL5 Market Product Description ==================================================================== PRODUCT NAME: SMT Divergence Gold vs Silver | Smart Money Scalping Tool SHORT DESCRIPTION (max 63 chars): Catch Gold reversals before they happen using SMT Divergence ---------------------------------------------------------------------- FULL DESCRIPTION ---------------------------------------------------------------------- W
FREE
RBreaker Gold Indicators — это краткосрочная внутридневная торговая стратегия для фьючерсов на золото, которая сочетает в себе два подхода: трендовое следование и внутридневные развороты. Она позволяет не только получать прибыль при трендовом движении, но и своевременно фиксировать прибыль при развороте рынка, открывая позиции в новом направлении. Данная стратегия на протяжении 15 лет подряд входила в десятку самых прибыльных торговых стратегий по версии американского журнала Futures Truth. Она
Индикатор Crypto_Forex HTF ADX для MT5. - Улучшите свои методы торговли с помощью профессионального индикатора HTF ADX для MT5. HTF означает «старший таймфрейм». - ADX (красная линия) используется для измерения силы тренда. Если значение ADX выше 20 и имеет восходящую форму, тренд сильный. - Если +DMI (синяя линия) выше -DMI (зелёная): цена движется вверх, а ADX измеряет силу восходящего тренда. - Если -DMI (зелёная линия) выше +DMI (синяя линия): цена движется вниз, а ADX измеряет силу нисход
Directional Force Histogram DFH — это индикатор в виде гистограммы, разработанный для отражения состояния рынка и помощи трейдеру в немедленной интерпретации направленного давления, силы движения и фаз замедления или перехода. DFH не предоставляет автоматических сигналов покупки или продажи. Его цель — предоставить операционный контекст, улучшая качество решений и управление позицией. Что измеряет DFH Бычье и медвежье давление Интенсивность движения Замедления и потеря импульса Фазы перехода и н
CosmiCLab SMC FIBO CosmiCLab SMC FIBO — это профессиональный торговый индикатор, основанный на концепциях Smart Money Concepts (SMC), анализе структуры рынка и уровнях Fibonacci. Индикатор автоматически определяет свинги рынка и строит уровни Fibonacci по последнему импульсному движению. Также индикатор определяет ключевые изменения структуры рынка: BOS — Break Of Structure CHOCH — Change Of Character Дополнительно отображаются сигнальные стрелки BUY / SELL при пробое структуры. Индикатор подход
Noize Absorption Index - is the manual trading system that measures the difference of pressure between bears forces and bulls forces. Green line - is a noize free index that showing curent situation. Zero value of index shows totally choppy/flat market.Values above zero level shows how powerfull bullish wave is and values below zero measures bearish forces.Up arrow appears on bearish market when it's ready to reverse, dn arrow appears on weak bullish market, as a result of reverse expectation.
What Is Trend Master Pro? Trend Master Pro   is a professional-grade trend trading indicator built for MetaTrader 5. It was designed with one goal in mind — to keep you on the right side of the market at all times by combining three powerful technical tools into a single, clean, easy-to-read display directly on your price chart. Instead of cluttering your screen with multiple separate indicators, Trend Master Pro fuses an   EMA Ribbon trend filter , a   ZigZag swing point engine , and a   breako
up down v6 for mt5 is no repaint all timeframe and all pairs indicator. red histogram cros trigger that is up point,and put a red point on histogram. and blue histogram cros trigger that is deep point.and put blue point on histogram. this indicator need to sometimes zoom out .for thise pres + button. if newly comes signal is too high makes before invisible.red and blue points are there.to see the signals. indicator is no repaint and can use all time frame and all pairs. only need minimum 500 bar
Caicai L&S Yield Histogram Important Notice: This indicator is an integral tool of the automated EA Caicai Long and Short Pair Trading . This indicator visually displays the percentage deviation (Yield %) of a pair's current spread relative to its own historical mean. It is an excellent tool for quickly visualizing the gross financial potential of a market distortion in Long & Short operations. Main Features: Percentage Visualization: Understand the size of the distortion in palpable percentage
Gobbo è un indicatore professionale che evidenzia il trend del mercato con un aspetto grafico chiaro e comprensibile, è basato sulla Moving Average e può essere impostato su qualsiasi periodo di intervallo, di default impostato sul periodo 14, scegliendo un periodo più alto evidenzierà meno cambi di tendenza per un approccio sul medio o lungo periodo, con un periodo più basso più cambi di tendenza per un approccio sul breve termine L'aggiornamento e l'adattamento al time frame scelto avviene in
KasTon Trend System: The Complete 2-in-1 Trading Strategy Identify the Trend, Confirm the Signal, and Trade with Confidence! Do you suffer from confusion while trading? Do you find it difficult to determine the market's direction? Are you tired of losing money on false signals? The KasTon Trend System is here as an integrated solution to all these problems. This is not just an indicator; it is a complete trading strategy built on the synergy of two powerful, custom-built indicators. Our main g
Bollinger Trend Lines – MT4 & MT5 Bollinger Trend Lines is a professional volatility-based trend indicator designed to clearly identify trend direction and dynamic stop levels using Bollinger Bands. Fuses on one core principle: follow the trend, ignore noise, and let volatility define the stop. How it works The indicator builds trailing trend lines using Bollinger Bands: In an uptrend , the lower band trails price and can only rise In a downtrend , the upper band trails price and can only
Advanced Stochastic Scalper MT5 - это профессиональный индикатор на базе известного индикатора Stochastic Oscillator. Advanced Stochastic Scalper представляет из себя осциллятор с динамическими уровнями перекупленности и перепроданности, у стандартного Stochastic Oscillator эти уровни статические и никогда не изменяются. Это позволяет Advanced Stochastic Scalper адаптироваться под постоянно меняющийся рынок. При появлении сигнала на покупку или продажу на графике рисуется стрелка и появляется ал
Это уникальный инструмент, конструктор который объединяет сигналы стандартных индикаторов встроенных в MT5 в одну общую стрелку. Стрелки не перерисовываются, и имеют буфера 0 и 1 для передачи на разный софт. Этот стрелочный индикатор позволит вам легко комбинировать сигналы от разных индикаторов, создавая десятки и сотни различный вариаций для ваших идей из которых можно получить мощные торговые стратегии. Используя встроенную функцию анализа прибыли, м ожно мгновенно оценить потенциал любой стр
Your Trend Friend
Luigi Nunes Labigalini
5 (1)
The trend is your friend! Look at the color of the indicator and trade on that direction. It does not  repaint. After each candle is closed, that's the color of the trend. You can focus on shorter faster trends or major trends, just test what's most suitable for the symbol and timeframe you trade. Simply change the "Length" parameter and the indicator will automatically adapt. You can also change the color, thickness and style of the lines. Download and give it a try! There are big movements w
Universal Soul Reaper is an atmospheric market-flow oscillator designed to interpret price behavior as a cycle of spiritual energy. Instead of reacting to raw price alone, it visualizes the state of the market’s soul —revealing when momentum is awakening, stabilizing, or fading. The indicator operates in a separate window and presents three interwoven entities: the Ectoplasmic Veil , the Spirit Boundary , and the Soul Core . Together, they form a living framework that helps traders sense pressu
Liquidity Channels Pro  MT4 HERE  is a sophisticated Smart Money Concepts (SMC) tool designed to automate the identification of   Buy Side Liquidity (BSL)   and   Sell Side Liquidity (SSL) . Unlike standard support and resistance indicators, this tool doesn't just draw lines; it projects   dynamic expanding channels   based on volatility (ATR) from key pivot points. Crucially, it follows the "Mitigation" logic used by institutional traders:   once liquidity is taken (price touches the level), th
STRICTLY FOR BOOM INDEX ONLY!!!!! Here I bring the Maximum Trend Arrows OT1.0 MT5 indicator. This indicator is made up of a combination of different trend indicators for entries and exits, for entries an orange arrow will paint on the chart below the current market and a red flag for closing of trades and it produces buy arrows only. When the orange arrow appears, it will appear along with it's sound to notify you. The 1H timeframe is recommended, don't use it anywhere else than on the 1H timefr
Индикатор Crypto_Forex «Гистограмма коррекции тренда» для MT5. - Гистограмма коррекции тренда может быть двух цветов: красного для медвежьего тренда и синего для бычьего. - 7 последовательных столбцов гистограммы одного цвета означают начало нового тренда. - Индикатор гистограммы коррекции тренда разработан с главной целью - минимизировать убытки и максимизировать прибыль. - Имеет параметр - "Период", отвечающий за чувствительность индикатора. - Встроенные оповещения для мобильных устройств и П
Этот индикатор находит AB = шаблоны восстановления CD. Паттерн AB = CD Retracement представляет собой 4-точечную ценовую структуру, в которой начальный ценовой сегмент частично восстановлен и сопровождается равноудаленным движением от завершения отката, и является базовой основой для всех гармонических паттернов. [ Руководство по установке | Руководство по обновлению | Устранение неполадок | FAQ | Все продукты ] Настраиваемые размеры рисунков Настраиваемые соотношения AC и BD Настраиваемые п
Индикатор Crypto_Forex "HTF Moving Averages Cross" для MT5. - Улучшите свои методы торговли с помощью мощного индикатора HTF Moving Averages Cross для MT5. HTF означает "старший таймфрейм". - Этот индикатор отлично подходит для трендовых трейдеров, использующих входы по ценовому действию. - Он позволяет прикреплять быстрые и медленные скользящие средние с более старшего таймфрейма к текущему графику --> это профессиональный метод. - HTF MAs Cross имеет встроенные оповещения для мобильных устро
Multi Anchor VWAP Pro MT5 – Pure Anchored VWAP | Adaptive σ-Bands | Smart Alerts Precision VWAP anchoring, no clutter. One-click anchors, dynamic σ-bands or %-bands, and instant multi-channel alerts—built for scalpers, intraday and swing traders who demand institutional-grade fair-value mapping. Public channel:   CLICK HERE Full User Guide  –  Need MT4? Click here WHY PROFESSIONAL TRADERS CHOOSE MULTI ANCHOR VWAP PRO VWAP is the institutional benchmark for fair value. Multi Anchor VWAP Pro stri
Range Volume Hybrid Generator
Trade The Volume Waves Single Member P.C.
1. Introduction Range Volume Hybrid (RVH) is a MetaTrader 5 Expert Advisor that creates custom chart symbols using a unique dual-condition bar formation method. Unlike traditional charts where bars close based on a single criterion (time, range, or volume), RVH bars close only when BOTH a minimum price range AND a minimum volume threshold are met simultaneously.  Download also and install RVH Monito r Indicator - to control the EA from the custom charts (it's Free)  https://www.mql5.com/en/marke
The Breakaway Fair Value Gap (FVG) is a typical FVG located at a point where the price is breaking new Highs or Lows.   USAGE Figure 1 In the figure 1, the price range is visualized by Donchian Channels. In theory, the Breakaway FVGs should generally be a good indication of market participation, showing favor in the FVG's breaking direction. This is a combination of buyers or sellers pushing markets quickly while   already   at the highest high or lowest low in recent history. Figure 2 Whi
ElliottWave Circles: Освойте рыночный импульс с абсолютной ясностью Раскройте истинную силу рыночных циклов с помощью ElliottWave Circles — упрощенного, визуально привлекательного индикатора импульса, разработанного для того, чтобы отсеять лишнюю информацию и предоставлять кристально чистые торговые сигналы. Созданный на основе проверенной логики осциллятора волн Эллиотта (EWO), этот инструмент преобразует сложные рыночные данные в простую, интуитивно понятную систему с цветовой кодировкой. Н
The Hull Moving Average (HMA) attempts to minimize the lag of a traditional moving average while retaining the smoothness of the moving average line. Developed by Alan Hull in 2005, this indicator makes use of weighted moving averages to prioritize more recent values and greatly reduce lag. The resulting average is more responsive and well-suited for identifying entry points. For more information, welcome to our Telegram Group.  https://t.me/InfinXx
Indicador visual que mostra a direção de um ativo em diferentes times frames. Acompanhe em tempo real a variação de direção dos preços nos últimos 3 candles. É possível escolher o ativo a ser mostrado e quais times frames deseja acompanhar. Excelente para operações Day Trade. Facilita a visualização de vários times frames auxiliando assim na tomada de decisão rápida. Parâmetros de fácil configuração.
С этим продуктом покупают
ARIBot is a powerful trading companion designed to generate high-probability entry signals with dynamic TP/SL/DP levels based on volatility. Built-in performance tracking shows win/loss stats, PP1/PP2 hits, and success rates — all updated live. Key Features: Buy/Sell signals with adaptive volatility bands Real-time TP/SL/DP levels based on ATR Built-in MA Filter with optional ATR/StdDev volatility Performance stats panel (Success, Profit/Loss, PP1/PP2) Alerts via popup, sound, push, or email Cus
SuperScalp Pro
Van Minh Nguyen
4.63 (24)
SuperScalp Pro – Продвинутая скальпинговая индикаторная система с множественными фильтрами SuperScalp Pro — это продвинутый скальпинговый индикатор, который сочетает классический Supertrend с несколькими интеллектуальными фильтрами подтверждения для поиска торговых возможностей. Он эффективно работает на различных таймфреймах от M1 до H4, с оптимизированной производительностью на XAUUSD, BTCUSD и основных валютных парах Forex. Индикатор предоставляет четкие сигналы Buy и Sell, а также автоматиче
Каждый покупатель этого индикатора получает дополнительно Бесплатно: Авторскую утилиту "Bomber Utility", которая автоматически сопровождает каждю торговую операцию, устанавливает уровни Стоп Лосс и Тейк профит и закрывает сделки согласно правилам этой стратегии, Сет-файлы для настройки этого индикатора на различных активах, Сет-файлы для настройки Bomber Utility в режимы: "Минимум Риска", "Взвешенный Риск" и "Стратегия Выжидания", Пошаговый видео-мануал, который поможет вам быстро установить, на
Entry In The Zone and SMC Multi Timeframe is a real-time 2-in-1 market analysis tool that combines market structure analysis and a No Repaint BUY / SELL signal system into a single indicator, built on Smart Money Concepts (SMC) — a widely adopted framework used by professional traders to understand market structure. This indicator helps you see the market more clearly, make decisions based on structure rather than guesswork, and focus on high-probability zones where price is more likely to react
Power Candles V3 — самооптимизирующийся индикатор силы Power Candles V3 преобразует силу валюты и инструмента в готовый к использованию торговый план на каждом графике, к которому он прикреплен. Вместо того, чтобы просто раскрашивать свечи, он выполняет автоматическую оптимизацию в режиме реального времени в фоновом режиме и предоставляет вам оптимальные значения Stop Loss, Take Profit и порог сигнала для выбранного вами символа. Один клик — и все готово для реальной торговли: на графике появляю
SignalTech MT5 is a fully rule based trading system for EURUSD, USDCHF, USDJPY, AUDUSD, NZDUSD, EURJPY, AUDJPY, NZDJPY, CADJPY.  All the winning trades with chart setups are published on the comments page. 2025-12 1174 Pips 2026-01 2624 Pips 2026-02 2937 Pips 2026-03 2165 Pips 2026-04 2243 Pips It can generate signals with Buy/Sell Arrows and Pop-Up/Sound Alerts. Each signal has clear Entry and Stop Loss levels, which should be automatically flagged on the chart, as well as potential Targets 1,
Gann Made Easy   - это профессиональная, но при этом очень простая в применении Форекс система, основанная на лучших принципах торговли по методам господина У.Д. Ганна. Индикатор дает точные BUY/SELL сигналы, включающие в себя уровни Stop Loss и Take Profit. ПОЖАЛУЙСТА, СВЯЖИТЕСЬ СО МНОЙ ПОСЛЕ ПОКУПКИ, ЧТОБЫ ПОЛУЧИТЬ ТОРГОВЫЕ ИНСТРУКЦИИ И ОТЛИЧНЫЕ ДОПОЛНИТЕЛЬНЫЕ ИНДИКАТОРЫ БЕСПЛАТНО! Вероятно вы уже не раз слышали о торговли по методам Ганна. Как правило теория Ганна отпугивает от себя не только
Представляем       Quantum Breakout PRO   , новаторский индикатор MQL5, который меняет ваш способ торговли в зонах прорыва! Разработан командой опытных трейдеров со стажем торговли более 13 лет,       Квантовый прорыв PRO       разработан, чтобы поднять ваше торговое путешествие к новым высотам с его инновационной и динамичной стратегией зоны прорыва. Quantum Breakout Indicator покажет вам сигнальные стрелки на зонах прорыва с 5 целевыми зонами прибыли и предложением стоп-лосса на основе поля
Если вы покупаете этот индикатор, вы получите мой профессиональный Trade Manager + EA БЕСПЛАТНО. Прежде всего стоит подчеркнуть, что эта торговая система является индикатором без перерисовки, без повторной отрисовки и без задержки, что делает ее идеальной как для ручной, так и для роботизированной торговли. Онлайн курс, руководство и загрузка пресетов. «Smart Trend Trading System MT5» - это комплексное торговое решение, созданное для новичков и опытных трейдеров. Он объединяет более 10 премиаль
Давайте сначала будем честны. Ни один индикатор сам по себе не сделает вас прибыльным. Если кто-то говорит вам обратное — он продаёт вам мечту. Любой индикатор, который показывает идеальные стрелки покупки/продажи, можно сделать безупречным — просто увеличьте нужный участок истории и сделайте скриншот успешных сделок. Мы так делать не будем. SMC Intraday Formula — это инструмент. Он считывает структуру рынка за вас, определяет зоны с наивысшей вероятностью движения цены и точно показывает, как
Azimuth Pro
Ottaviano De Cicco
5 (7)
Azimuth Pro V2: Синтетический фрактальный структурный анализ и подтверждённые входы для MT5 Обзор Azimuth Pro — многоуровневый индикатор свинговой структуры от Merkava Labs . Четыре вложенных уровня свингов, привязанный к свингам VWAP, определение ABC-паттернов, трёхтаймфреймная структурная фильтрация и подтверждённые входы на закрытой свече — один график, один рабочий процесс от микро-свингов до макро-циклов. Это не слепой сигнальный продукт. Это рабочий процесс, основанный на структуре, для т
Meridian Pro
Ottaviano De Cicco
5 (2)
Meridian Pro 2.00: профессиональная multi-timeframe матрица тренда для MT5 Meridian Pro 2.00 - профессиональная адаптивная матрица тренда для MetaTrader 5. Она объединяет оригинальный трендовый движок Meridian, чистый chart ribbon, сигнальные стрелки по закрытому бару, dashboard на 8 таймфреймов, Fuel momentum, weighted consensus, synthetic HTF processing и chart-native линии контекста старших таймфреймов. Цель простая: читать текущий тренд, multi-timeframe структуру, силу, momentum и EA-ready с
Quantum TrendPulse
Bogdan Ion Puscasu
5 (25)
Представляем   Quantum TrendPulse   , совершенный торговый инструмент, который объединяет мощь   SuperTrend   ,   RSI   и   Stochastic   в один комплексный индикатор, чтобы максимизировать ваш торговый потенциал. Разработанный для трейдеров, которые ищут точность и эффективность, этот индикатор помогает вам уверенно определять рыночные тренды, сдвиги импульса и оптимальные точки входа и выхода. Основные характеристики: Интеграция SuperTrend:   легко следуйте преобладающим рыночным тенденциям и п
FX Trend NG: Следующее поколение интеллектуального анализа трендов на разных рынках Обзор FX Trend NG — это профессиональный инструмент анализа трендов и мониторинга рынка с поддержкой нескольких таймфреймов. Он позволяет за секунды получить полное структурное понимание текущего состояния рынка. Вместо переключения между десятками графиков вы мгновенно видите, какие инструменты находятся в тренде, где импульс ослабевает и где наблюдается сильная синхронизация между таймфреймами. Специальное пр
Прежде всего стоит подчеркнуть, что этот Торговый Инструмент является Неперерисовывающимся Нерепейнтинговым Индикатором, что делает его идеальным для профессиональной торговли. Онлайн-курс, руководство пользователя и демонстрация. Индикатор Концепций Умного Действия Цены - очень мощный инструмент как для новичков, так и для опытных трейдеров. Он объединяет более 20 полезных индикаторов в одном, комбинируя передовые торговые идеи, такие как анализ Inner Circle Trader и стратегии торговли концеп
Эта панель показывает последние доступные   гармонические паттерны   для выбранных символов, так что вы сэкономите время и будете более эффективны /   MT4 версия . Бесплатный индикатор:   Basic Harmonic Pattern Колонки индикатора Symbol:   отображаются выбранные символы Trend   :   бычий или медвежий Pattern   :   тип паттерна (Гартли, бабочка, летучая мышь, краб, акула, шифр или ABCD) Entry   :   цена входа SL:   цена стоп-лосса TP1:   цена первого тейк-профита TP2:   цена второго тейк-профи
Прежде всего стоит подчеркнуть, что этот торговый индикатор не перерисовывается, не перерисовывает и не отставает, что делает его идеальным как для ручной, так и для роботизированной торговли. Руководство пользователя: настройки, вводы и стратегия. Атомный аналитик - это индикатор ценового действия PA, который использует силу и импульс цены, чтобы найти лучший край на рынке. Оборудованный расширенными фильтрами, которые помогают убирать шумы и ложные сигналы, и повышают торговый потенциал. Испо
Большинство стрелочных индикаторов дают сигнал и оставляют вас самостоятельно разбираться со всем остальным. KT Alpha Hunter Arrows дает вам полный торговый план. Каждая сигнальная стрелка появляется вместе с уже готовым планом: линия входа, стоп-лосс, четыре уровня тейк-профита и живой вердикт по преимуществу, который показывает, стоит ли сейчас торговать данный символ и таймфрейм. В комплект входит Trade Manager EA, который берет на себя сопровождение сделки после вашего входа, помогая сохраня
FX Power: Анализируйте силу валют для более эффективной торговли Обзор FX Power — это ваш незаменимый инструмент для понимания реальной силы валют и золота в любых рыночных условиях. Определяя сильные валюты для покупки и слабые для продажи, FX Power упрощает принятие торговых решений и выявляет высоковероятные возможности. Независимо от того, хотите ли вы следовать за трендами или предсказывать развороты с использованием экстремальных значений дельты, этот инструмент идеально адаптируется под
Раскройте силу торговли трендами с помощью индикатора Trend Screener: вашего идеального решения для торговли трендами, основанного на нечеткой логике и мультивалютной системе! Повысьте уровень своей торговли по тренду с помощью Trend Screener, революционного индикатора тренда, основанного на нечеткой логике. Это мощный индикатор отслеживания тренда, который сочетает в себе более 13 инструментов и функций премиум-класса и 3 торговые стратегии, что делает его универсальным выбором для превращения
Представляю Вам отличный технический индикатор GRABBER, который работает, как готовая торговая стратегия "Все включено"! В одном программном коде интегрированы мощные инструменты для технического анализа рынка, торговые сигналы (стрелки), функции алертов и Push уведомлений.  Каждый покупатель этого индикатора получает дополнительно БЕСПЛАТНО:  Grabber Утилиту для автоматического управления открытыми ордерами, Пошаговый видео-мануал : как установить, настроить и торговать, Авторские сет-файлы дл
Топовый индикатор МТ5, дающий сигналы для входа в сделки без перерисовки! Идеальные точки входа в сделки для  валют, крипты, металлов, акций, индексов !  Смотрите  видео  (6:22) с примером отработки всего одного сигнала, окупившего индикатор. Версия индикатора для MT4 Преимущества индикатора Сигналы на вход без перерисовки Если сигнал появился, он никуда НЕ исчезает! В отличие от индикаторов с перерисовкой, которые ведут к потере депозита, потому что могут показать сигнал, а потом убрать его. Б
Market Structure Order Block Dashboard MT5 — это индикатор MT5, разработанный для трейдеров, которые хотят читать рыночную структуру и основные зоны реакции цены прямо на графике. Он объединяет BOS, ChoCH, Order Blocks, Fair Value Gaps (FVG), Ликвидность, Kill Zones, Volume Profile и компактную панель для быстрого анализа. Индикатор предназначен для трейдеров, использующих рыночную структуру, концепции ICT и Smart Money как основу для принятия решений. Он помогает выявлять продолжения тренда, во
RelicusRoad Pro: Квантовая Рыночная Операционная Система СКИДКА 70% ПОЖИЗНЕННЫЙ ДОСТУП (ОГРАНИЧЕНО) - ПРИСОЕДИНЯЙТЕСЬ К 2000+ ТРЕЙДЕРАМ Почему большинство трейдеров теряют деньги даже с «идеальными» индикаторами? Потому что они торгуют Единичными Концепциями в вакууме. Сигнал без контекста — это лотерея. Чтобы выигрывать стабильно, вам нужна КОНФЛЮЭНЦИЯ . RelicusRoad Pro — это не простой стрелочный индикатор. Это полная Количественная Рыночная Экосистема . Она отображает «Дорогу Справедливой Сто
Индикатор Trend Forecaster использует уникальный авторский алгоритм для определения точек входа в сделку по пробойной стратегии. Индикатор определяет ценовые скопления и анализирует движение цены возле уровней и показывает сигнал, когда цена пробивает уровень. Индикатор Trend Forecaster подходит для любых финансовых активов: валюты (Форекс), металлы, акции, индексы, криптовалюты. Также индикатор можно настроить для работы на любых тайм-фреймах, однако в качестве рабочего тайм-фрейма все же реком
Btmm state engine pro
Garry James Goodchild
5 (4)
BTMM State Engine Pro is a MetaTrader 5 indicator for traders who use the Beat The Market Maker approach: Asian session context, kill zone timing, level progression, peak formation detection, and a multi-pair scanner from a single chart. It combines cycle state logic with a built-in scanner dashboard so you do not need the same tool on many charts at once. What it does Draws the Asian session range; session times can follow broker server offset or be set in inputs. Tracks level progression (L
TREND LINES PRO   помогает понять, где рынок действительно меняет направление. Индикатор показывает реальные развороты тренда и места, где крупные участники входят повторно. Вы видите   BOS-линии   смены тренда и ключевые уровни старших таймфреймов — без сложных настроек и лишнего шума. Сигналы не перерисовываются и остаются на графике после закрытия бара. VERSION MT4     -     Раскрывает свой максимальный потенциал в связке с индикатором  RFI LEVELS PRO Что показывает индикатор: Реальные смены
Introducing Indicator for PainX and GainX Indices Traders on Weltrade Get ready to experience the power of trading with our indicator, specifically designed for Weltrade   broker's PainX and GainX Indices.  Advanced Strategies for Unbeatable Insights Our indicator employs sophisticated strategies to analyze market trends, pinpointing optimal entry and exit points.  Optimized for Maximum Performance To ensure optimal results, our indicator is carefully calibrated for 5-minute timeframe charts on
Индикатор точно показывает точки разворота и зоны возврата цены, где входят   крупные игроки . Вы видите, где формируется новый тренд, и принимаете решения с максимальной точностью, держа контроль над каждой сделкой. VERSION MT4     -    Раскрывает свой максимальный потенциал в связке с индикатором  TREND LINES PRO Что показывает индикатор: Разворотные конструкции и разворотные уровни с активацией в начале нового тренда. Отображение уровней  TAKE PROFIT  и  STOP LOSS  с минимальным соотношением
Super Signal Market Slayer Без перерисовки | Высокая точность | Интеллектуальный мульти-рыночный трендовый индикатор В трейдинге самое сложное — не открыть сделку, а вовремя распознать начало тренда среди рыночного шума. Именно для этого был создан Market Slayer. Это интеллектуальный индикатор без перерисовки, разработанный для внутридневной торговли. Благодаря многоуровневому подтверждению и фильтрации тренда он показывает чёткие и надёжные сигналы Buy / Sell только в ключевые моменты. Ключевы
Другие продукты этого автора
The Breaker Blocks with Signals indicator aims to highlight a complete methodology based on breaker blocks. Breakout signals between the price and breaker blocks are highlighted and premium/discount swing levels are included to provide potential take profit/stop loss levels. This script also includes alerts for each signal highlighted.   SETTINGS   Breaker Blocks Length: Sensitivity of the detected swings used to construct breaker blocks. Higher values will return longer term break
Multiple Wicks forming at OverSold & OverBought levels create Buying and Selling Pressure. This indicator tries to capture the essence of the buy and sell pressure created by those wicks. Wick pressure shows that the trend is Exhausted. Order block should display when buying or selling pressure wick. When price go inside buy order block and up to outside order block, trader should consider a buy order. If price go inside buy order block and down to outside order block, trader should consider a s
This indicator shows when user set sessions are active and returns various tools + metrics using the closing price within active sessions as an input. Users have the option to change up to 4 session times. The indicator will increasingly lack accuracy when the chart timeframe is higher than 1 hour. Settings Sessions Enable Session: Allows to enable or disable all associated elements with a specific user set session. Session Time: Opening and closing times of the user set session in the  
This is a Forex Scalping Trading Sytem based on the Bollinger Bands.  Pairs:Major Time frame: 1M or higher. Spread max:0,0001.  Indicators (just suggestion) Bollinger bands (20, 2); ADX (14 period); RSI   (7 period ). Y ou should only trade this system between 2am to 5am EST, 8am to 12am EST and 7.30pm to 10pm EST. Do not scalp 30 minutes before a orange or red news  report and not for a hour afterwards.   Setup: is for price to move above the lower or lower Bollinger Bands, RSI raise above the
FREE
The indicator returning pivot point based trendlines with highlighted breakouts . Trendline caculated by pivot point and other clue are ATR, Stdev. The indicator also includes integrated alerts for  trendlines  breakouts and foward message to Telegram channel or group if you want. Settings ·          Lookback bar: Default 200 is number of bar caculate when init indicator. ·          Length:  Pivot points  period ·          Slope Calculation Method: Determines how this lope is calculated. We supp
This is addition of  Effective SV squeeze momentum  that add bolliger band and Keltner channel to chart window.  Squeeze momentum introduced by “John Carter”, the squeeze indicator for MT5 represents a volatility-based tool. Regardless, we can also consider the squeeze indicator as a momentum indicator, as many traders use it to identify the direction and strength of price moves. In fact, the Tradingview  squeeze indicator shows when a financial instrument is willing to change from a trending ma
FREE
ICT Concepts
Minh Truong Pham
5 (2)
The ICT Concepts indicator regroups core concepts highlighted by trader and educator "The Inner Circle Trader" (ICT) into an all-in-one toolkit. Features include Market Structure (MSS & BOS), Order Blocks, Imbalances, Buyside/Sellside Liquidity, Displacements, ICT Killzones, and New Week/Day Opening Gaps. It’s one kind of Smart money concepts. USAGE: Please read this document  !    DETAILS Market Structure Market structure labels are constructed from price breaking a prior extreme point. T
The Inversion Fair Value Gaps (IFVG) indicator is based on the inversion FVG concept by ICT and provides support and resistance zones based on mitigated Fair Value Gaps (FVGs). Image 1   USAGE Once mitigation of an FVG occurs, we detect the zone as an "Inverted FVG". This would now be looked upon for potential support or resistance. Mitigation occurs when the price closes above or below the FVG area in the opposite direction of its bias. (Image 2) Inverted Bullish FVGs Turn into Potenti
Introduction One of the patterns in "RTM" is the "QM" pattern, also known as "Quasimodo". Its name is derived from the appearance of "Hunchback of Notre-Dame" from Victor Hugo's novel. It is a type of "Head and Shoulders" pattern.   Formation Method   Upward Trend In an upward trend, the left shoulder is formed, and the price creates a new peak higher than the left shoulder peak . After a decline, it manages to break the previous low and move upward again. We expect the price to
All about Smart Money Concepts Strategy: Market struture: internal or swing BOS, CHoCH; Orderblock; Liquity equal; Fair Value Gap with Consequent encroachment, Balanced price range; Level with Previous month, week, day level or in day level (PMH, PWH, PDH, HOD); BuySell Stops Liquidity (BSL, SSL); Liquidity Void Long Wicks; Premium and Discount; Candle pattern ... "Smart Money Concepts" ( SMC ) is a fairly new yet widely used term amongst price action traders looking to more accurately navigate
The indicator   returning pivot point based trendlines with highlighted breakouts . Trendline caculated by pivot point and other clue are ATR, Stdev.   The indicator also includes integrated alerts for  trendlines  breakouts   and foward message to Telegram channel or group if you want. Settings ·            Lookback bar: Default 200 is number of bar caculate when init indicator. ·            Length:  Pivot points  period ·            Slope Calculation Method: Determines how this lope is calcula
This all-in-one indicator displays real-time market structure (internal & swing BOS / CHoCH), order blocks, premium & discount zones, equal highs & lows, and much more...allowing traders to automatically mark up their charts with widely used price action methodologies. Following the release of our Fair Value Gap script, we received numerous requests from our community to release more features in the same category. //------------------------------------// Version 1.x has missing functions + PDAr
The Breaker Blocks with Signals indicator aims to highlight a complete methodology based on breaker blocks. Breakout signals between the price and breaker blocks are highlighted and premium/discount swing levels are included to provide potential take profit/stop loss levels. This script also includes alerts for each signal highlighted.   SETTINGS   Breaker Blocks Length: Sensitivity of the detected swings used to construct breaker blocks. Higher values will return longer term break
The ICT Concepts indicator regroups core concepts highlighted by trader and educator "The Inner Circle Trader" (ICT) into an all-in-one toolkit. Features include Market Structure (MSS & BOS), Order Blocks, Imbalances, Buyside/Sellside Liquidity, Displacements, ICT Killzones, and New Week/Day Opening Gaps. It’s one kind of Smart money concepts.   USAGE:   Please read this   document  !      DETAILS Market Structure Market structure labels are constructed from price breaking a prior extreme
The FollowLine indicator is a trend following indicator. The blue/red lines are activated when the price closes above the upper Bollinger band or below the lower one. Once the trigger of the trend direction is made, the FollowLine will be placed at High or Low (depending of the trend). An ATR filter can be selected to place the line at a more distance level than the normal mode settled at candles Highs/Lows. Some features: + Trend detech + Reversal signal + Alert teminar / mobile app
The ICT Silver Bullet indicator is inspired from the lectures of "The Inner Circle Trader" (ICT) and highlights the Silver Bullet (SB) window which is a specific 1-hour interval where a Fair Value Gap (FVG) pattern can be formed. A detail document about ICT Silver Bullet here . There are 3 different Silver Bullet windows (New York local time): The London Open Silver Bullet (3 AM — 4 AM ~ 03:00 — 04:00) The AM Session Silver Bullet (10 AM — 11 AM ~ 10:00 — 11:00) The PM Session Silver Bullet (2
This indicator shows when user set sessions are active and returns various tools + metrics using the closing price within active sessions as an input. Users have the option to change up to 4 session times. The indicator will increasingly lack accuracy when the chart timeframe is higher than 1 hour. Settings Sessions Enable Session: Allows to enable or disable all associated elements with a specific user set session. Session Time: Opening and closing times of the user set session in the  
The liquidity swings indicator highlights swing areas with existent trading activity. The number of times price revisited a swing area is highlighted by a zone delimiting the swing areas. Additionally, the accumulated volume within swing areas is highlighted by labels on the chart. An option to filter out swing areas with volume/counts not reaching a user-set threshold is also included. This indicator by its very nature is not real-time and is meant for descriptive analysis alongside other com
The SuperTrend AI indicator is a novel take on bridging the gap between the K-means clustering machine learning method & technical indicators. In this case, we apply K-Means clustering to the famous SuperTrend indicator.   USAGE Users can interpret the SuperTrend AI trailing stop similarly to the regular SuperTrend indicator. Using higher minimum/maximum factors will return longer-term signals. (image 1) The displayed performance metrics displayed on each signal allow for a deeper interpretat
OVERVIEW A Lorentzian Distance Classifier (LDC) is a Machine Learning classification algorithm capable of categorizing historical data from a multi-dimensional feature space. This indicator demonstrates how Lorentzian Classification can also be used to predict the direction of future price movements when used as the distance metric for a novel implementation of an Approximate Nearest Neighbors (ANN) algorithm. This indicator provide signal as buffer, so very easy for create EA from this indi
This script automatically calculates and updates ICT's daily IPDA look back time intervals and their respective discount / equilibrium / premium, so you don't have to :) IPDA stands for Interbank Price Delivery Algorithm. Said algorithm appears to be referencing the past 20, 40, and 60 days intervals as points of reference to define ranges and related PD arrays. Intraday traders can find most value in the 20 Day Look Back box, by observing imbalances and points of interest. Longer term traders c
An Implied Fair Value Gap (IFVG) is a three candles imbalance formation conceptualized by ICT that is based on detecting a larger candle body & then measuring the average between the two adjacent candle shadows. This indicator automatically detects this imbalance formation on your charts and can be extended by a user set number of bars. The IFVG average can also be extended until a new respective IFVG is detected, serving as a support/resistance line. Alerts for the detection of bullish/be
Consolidation is when price is moving inside a clear trading range. When prices are consolidated it shows the market maker placing orders on both sides of the market. This is mainly due to manipulate the un informed money. This indicator automatically identifies consolidation zones and plots them on the chart. The method of determining consolidation zones is based on pivot points and ATR, ensuring precise identification. The indicator also sends alert notifications to users when a new consolida
This indicator presents an alternative approach to identify Market Structure. The logic used is derived from learning material created by   DaveTeaches (on X) Upgrade v1.10: add option to put protected high/low value to buffer (figure 11, 12) When quantifying Market Structure, it is common to use fractal highs and lows to identify "significant" swing pivots. When price closes through these pivots, we may identify a Market Structure Shift (MSS) for reversals or a Break of Structure (BOS) for co
This indicator provides the ability to recognize the SMC pattern, essentially a condensed version of the Wyckoff model. Once the pattern is confirmed by RTO, it represents a significant investment opportunity.    There are numerous indicators related to SMC beyond the market, but this is the first indicator to leverage patterns to identify specific actions of BigBoy to  navigate the market. Upgrade 2024-03-08: Add TP by RR feature. The SMC (Smart Money Concept)   pattern   is a market analysis m
Created by imjesstwoone and mickey1984, this trade model attempts to capture the expansion from the 10:00-14:00 EST 4h candle using just 3 simple steps. All of the information presented in this description has been outlined by its creators, all I did was translate it to MQL4. All core settings of the trade model may be edited so that users can test several variations, however this description will cover its default, intended behavior using NQ 5m as an example. Step 1 is to identify our Price Ra
The Buyside & Sellside Liquidity indicator aims to detect & highlight the first and arguably most important concept within the ICT trading methodology,   Liquidity   levels. SETTINGS Liquidity Levels Detection Length: Lookback period Margin: Sets margin/sensitivity for a liquidity level detection Liquidity Zones Buyside Liquidity Zones: Enables display of the buyside liquidity zones. Margin: Sets margin/sensitivity for the liquidity zone boundaries. Color: Color option for buysid
The   Liquidation Estimates (Real-Time)   experimental indicator attempts to highlight real-time long and short liquidations on all timeframes. Here with liquidations, we refer to the process of forcibly closing a trader's position in the market. By analyzing liquidation data, traders can gauge market sentiment, identify potential support and resistance levels, identify potential trend reversals, and make informed decisions about entry and exit points. USAGE (Img 1)    Liquidation refers
The   ICT Unicorn Model   indicator highlights the presence of "unicorn" patterns on the user's chart which is derived from the lectures of   "The Inner Circle Trader" (ICT) . Detected patterns are followed by targets with a distance controlled by the user.   USAGE (image 2) At its core, the ICT Unicorn Model relies on two popular concepts, Fair Value Gaps and Breaker Blocks. This combination highlights a future area of support/resistance. A   Bullish Unicorn Pattern   consists out of:
Overview The   Volume SuperTrend AI   is an advanced technical indicator used to predict trends in price movements by utilizing a combination of traditional SuperTrend calculation and AI techniques, particularly the k-nearest neighbors (KNN) algorithm. The Volume SuperTrend AI is designed to provide traders with insights into potential market trends, using both volume-weighted moving averages (VWMA) and the k-nearest neighbors (KNN) algorithm. By combining these approaches, the indicator
Фильтр:
Нет отзывов
Ответ на отзыв