Breaker Blocks with Signals MT5
- Индикаторы
-
Minh Truong Pham
 Hello, my name is Pham and I am a programmer and trader! At here, I create amazing forex indicators and expert advisors for Metatrader.
I will try:
+ Provide best tools base on my 5 years experience as a trader and 10 years as a programmer. - Версия: 1.10
- Обновлено: 14 октября 2023
- Активации: 5
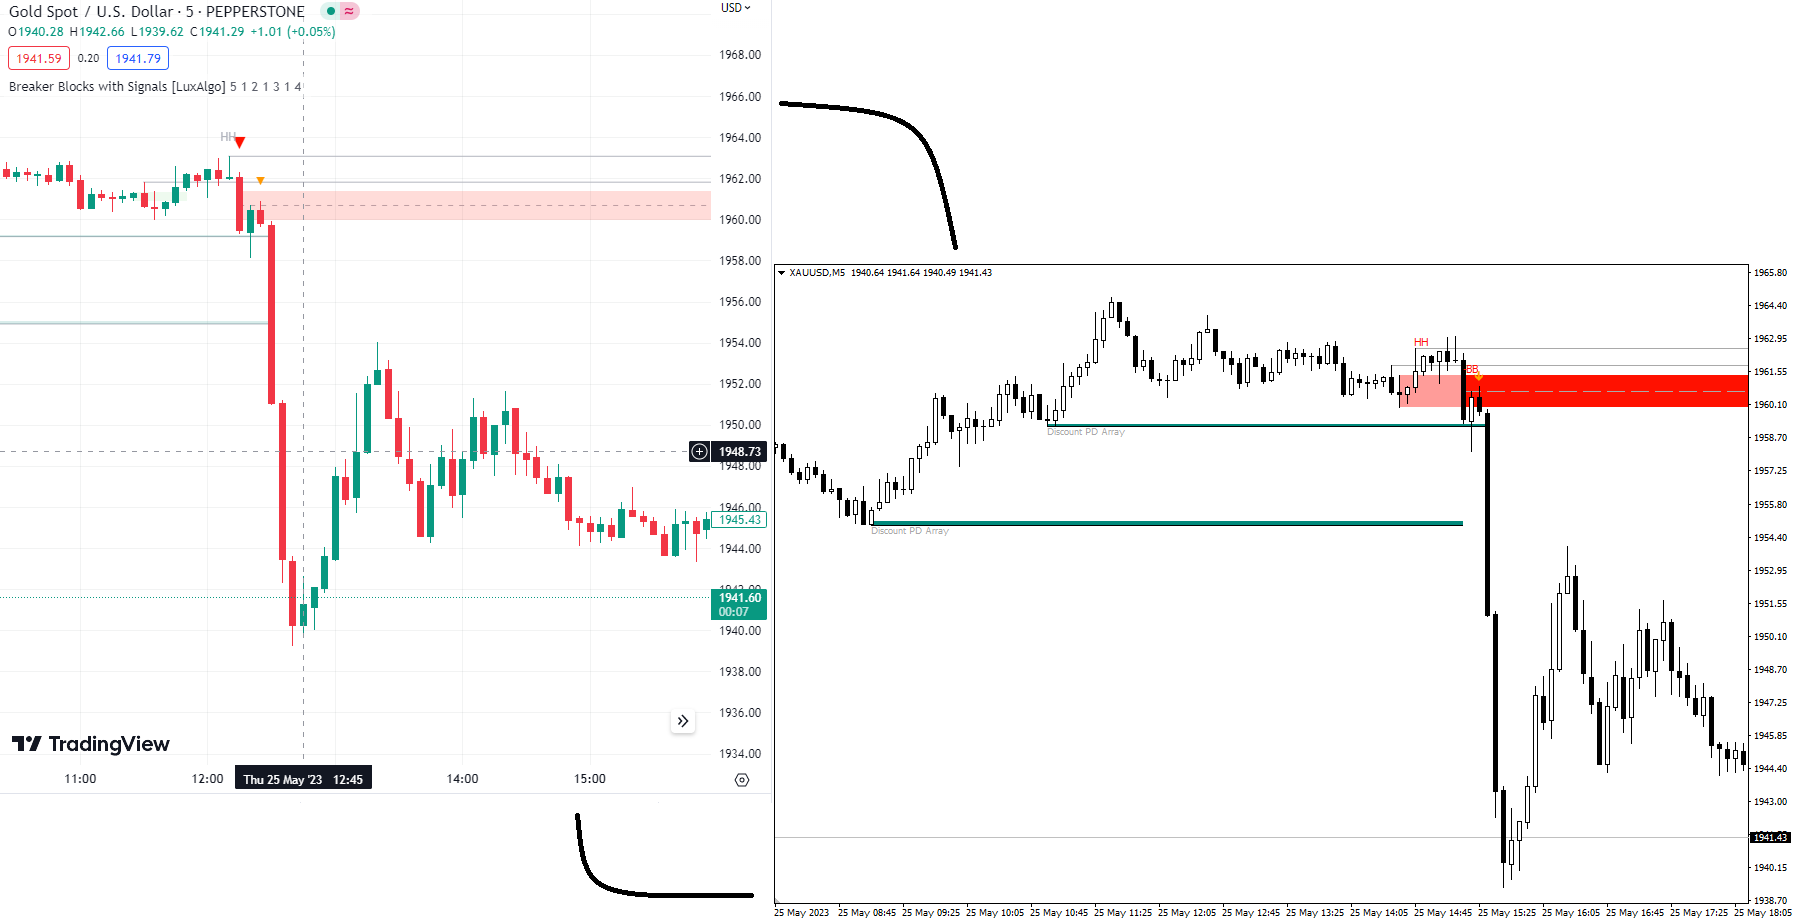
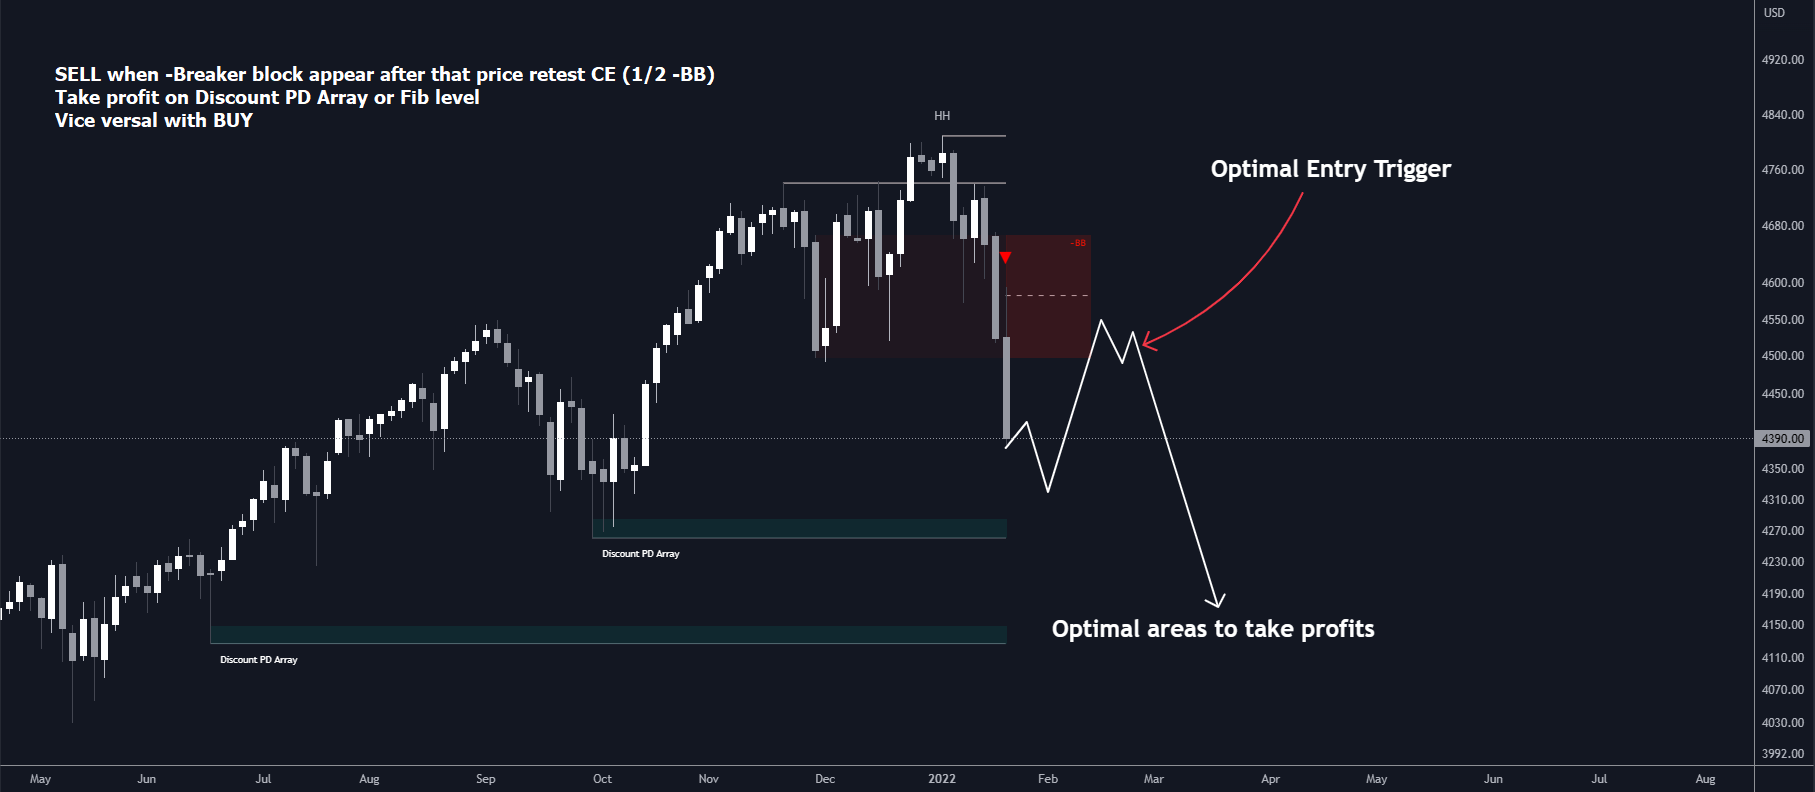
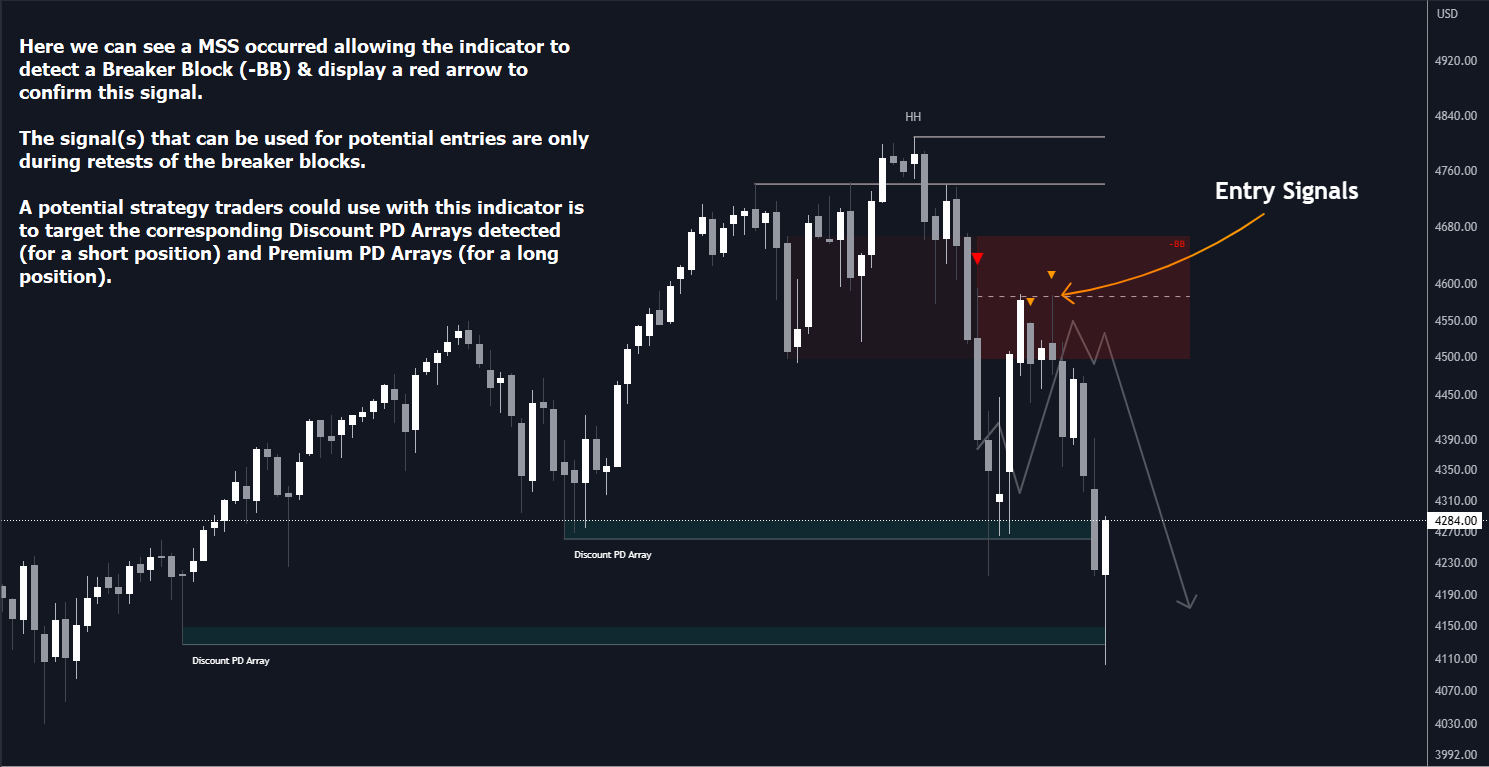
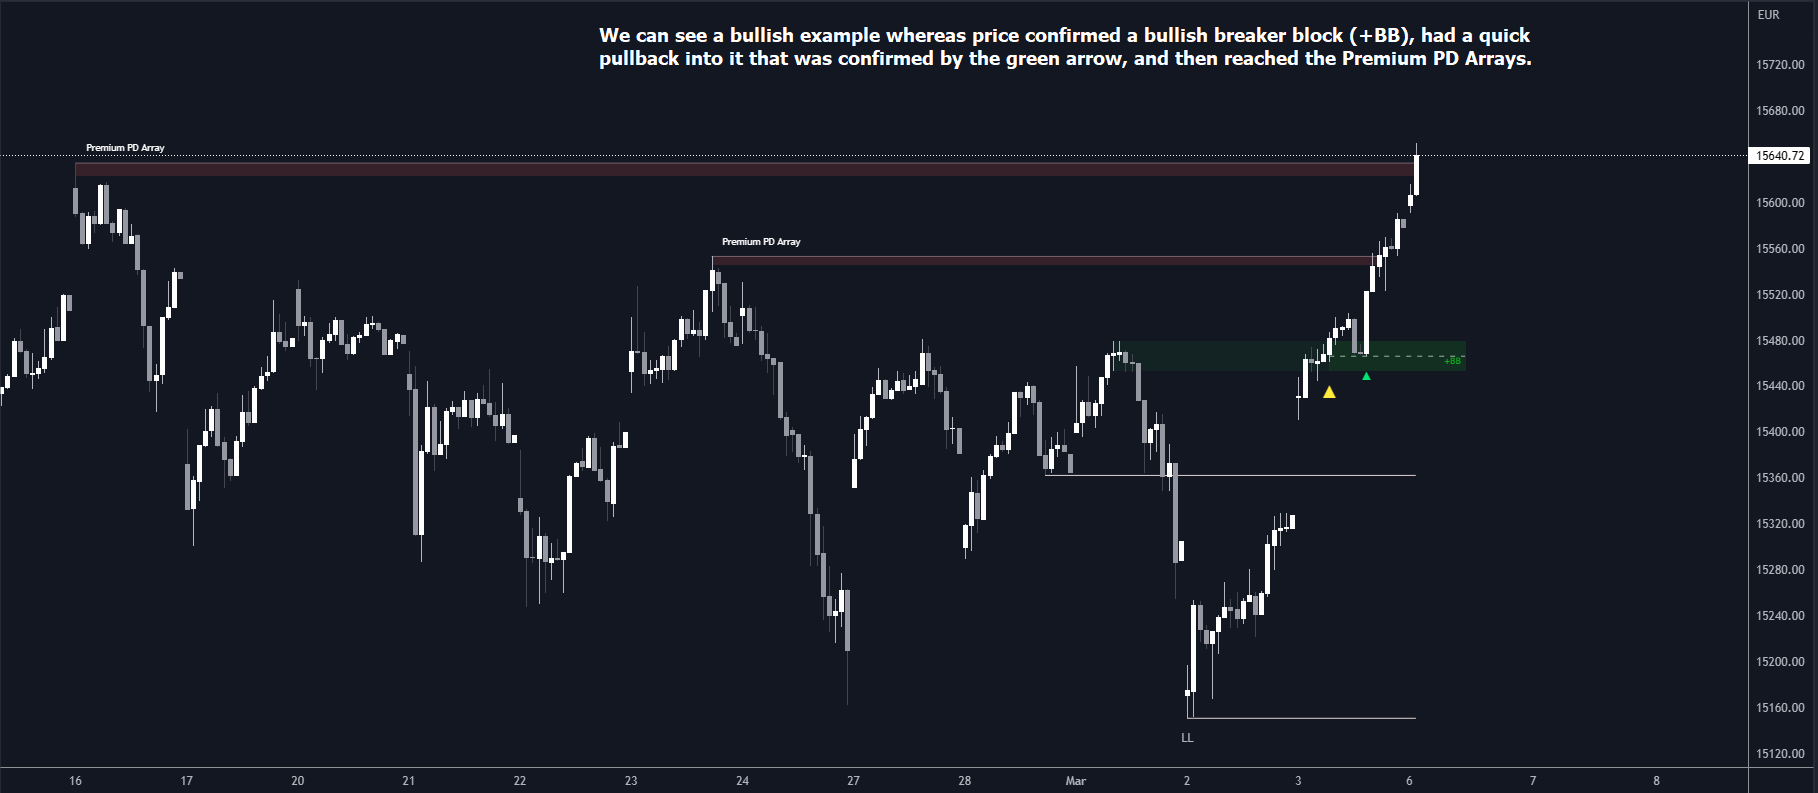
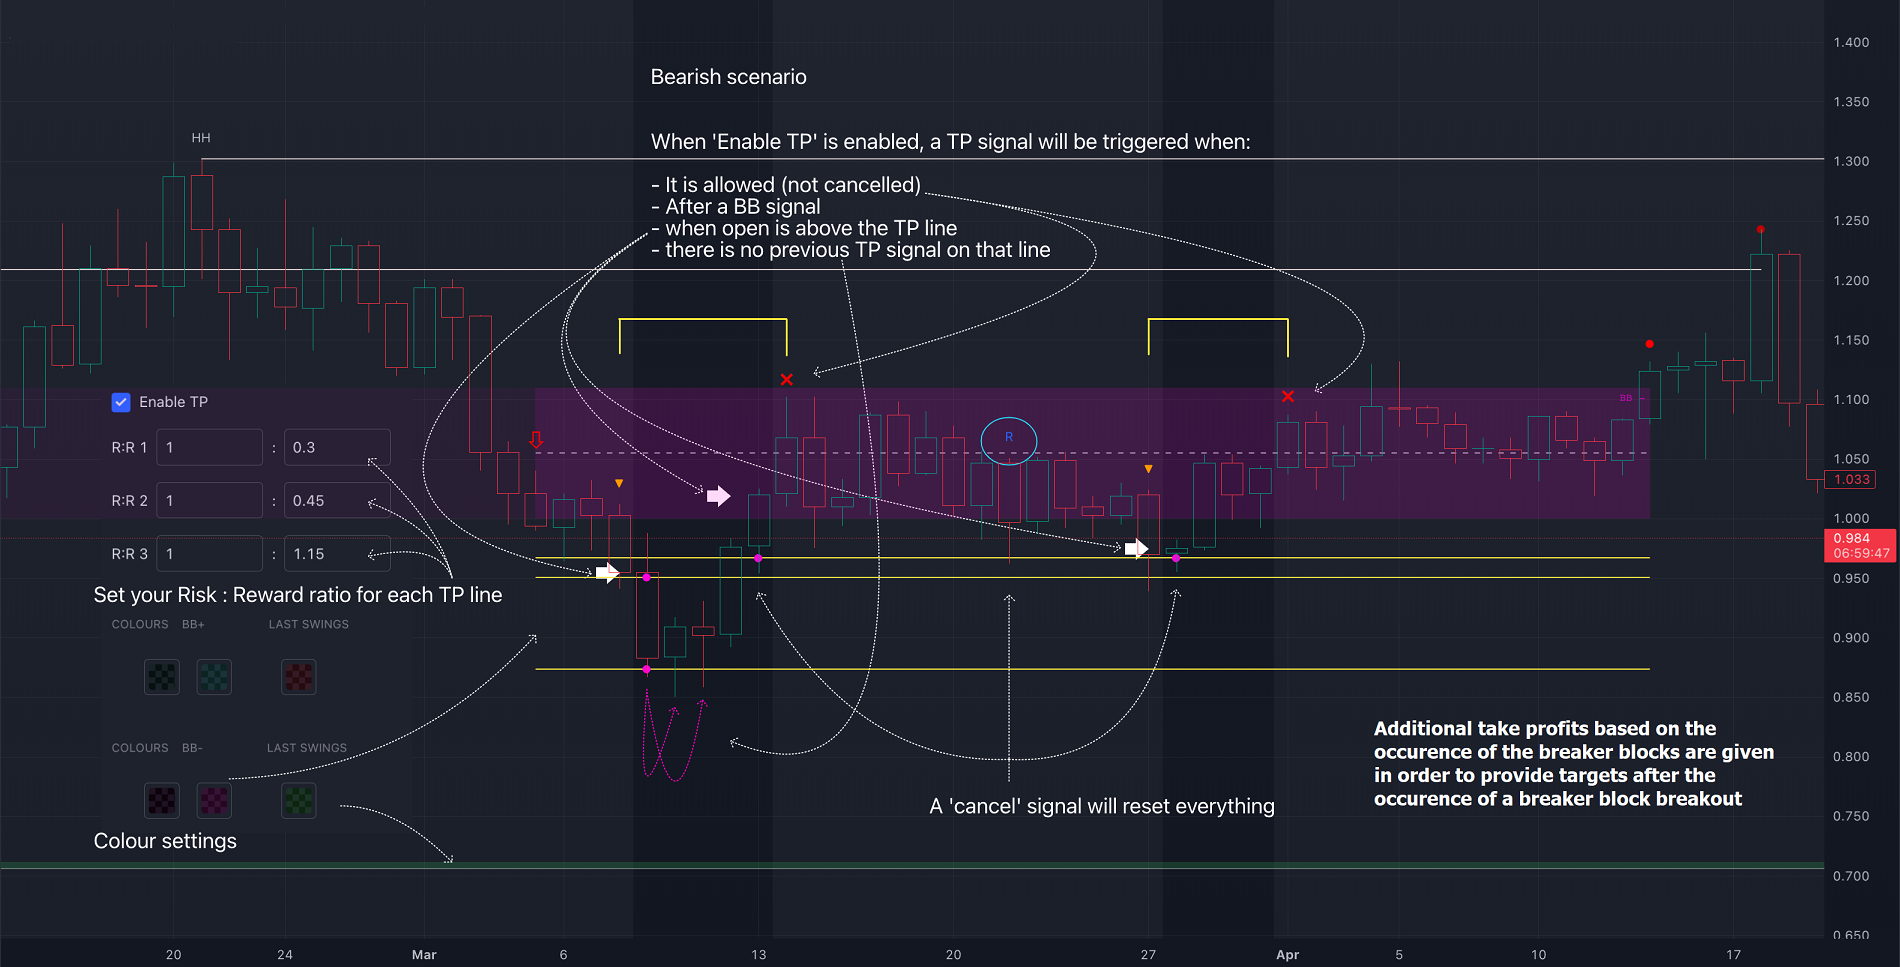
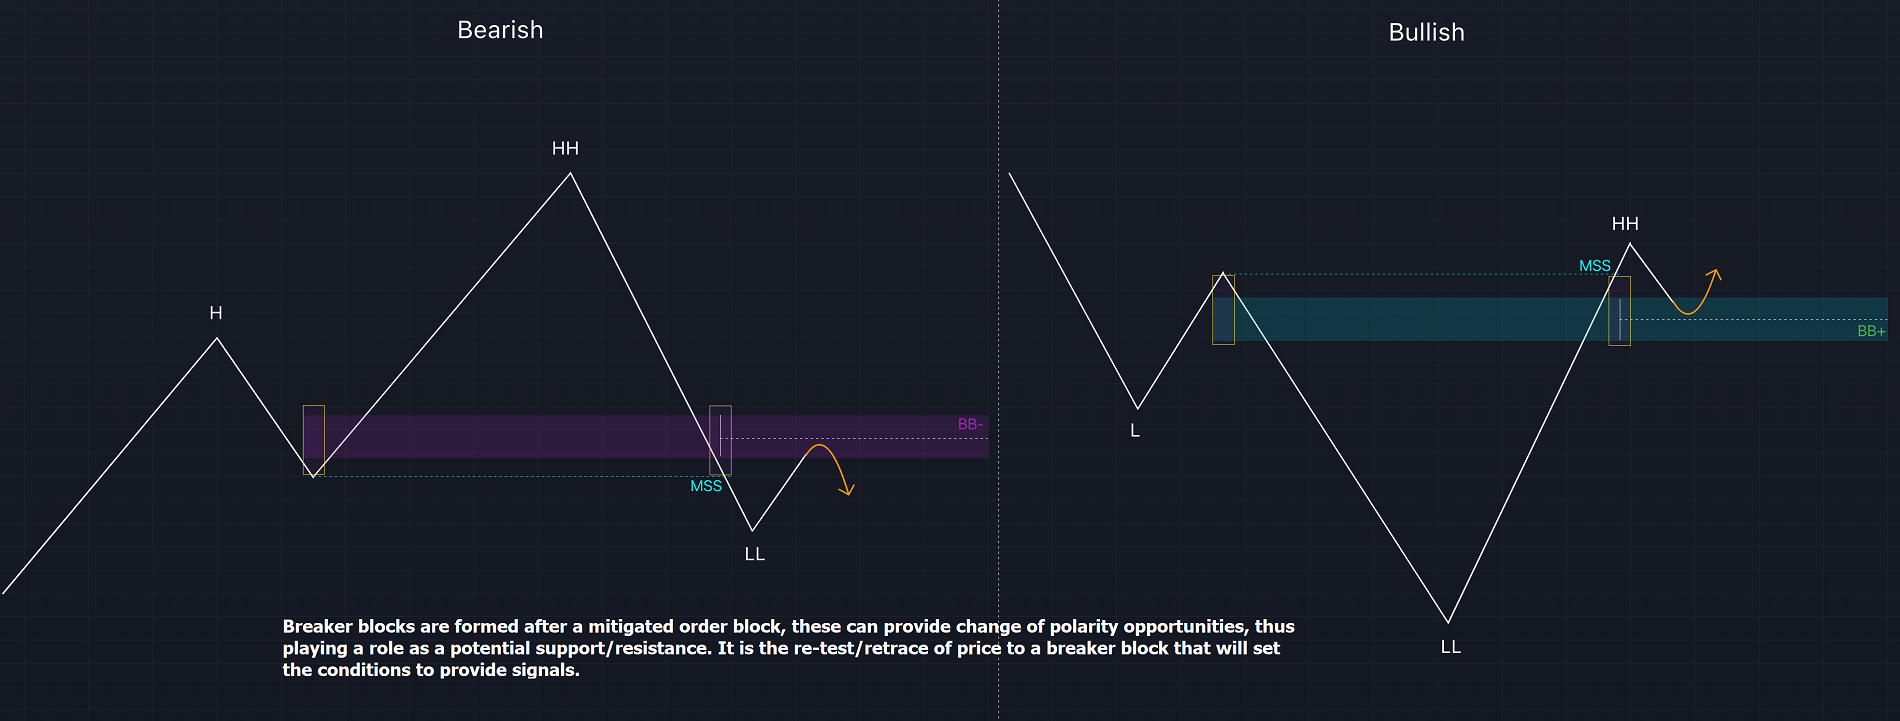
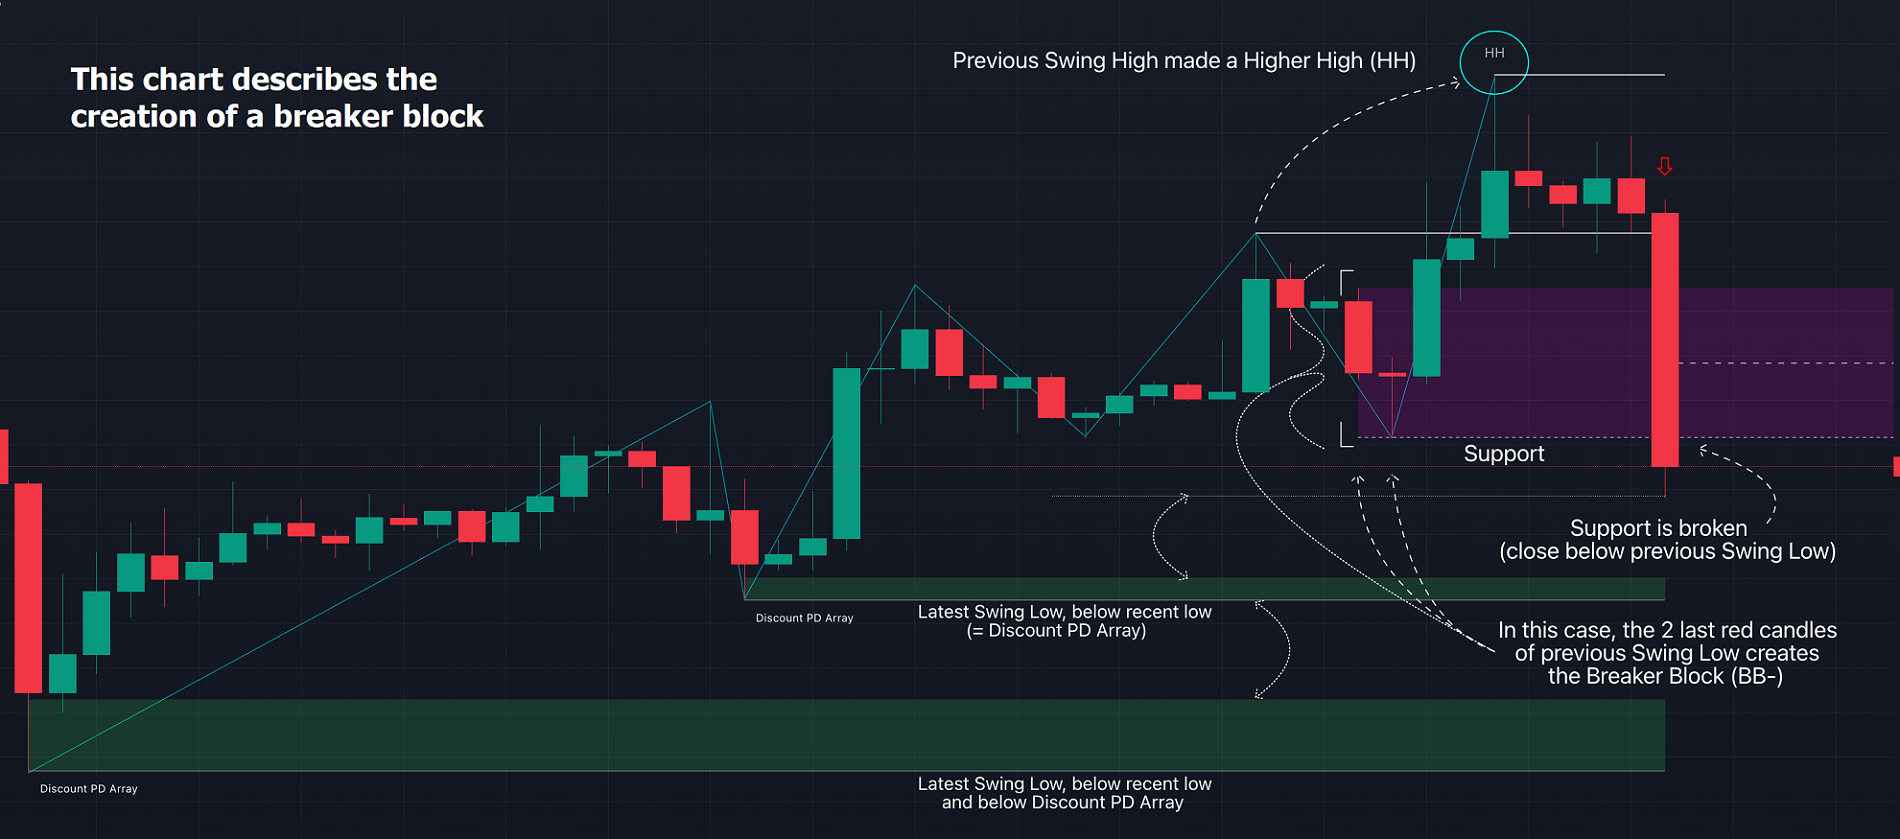
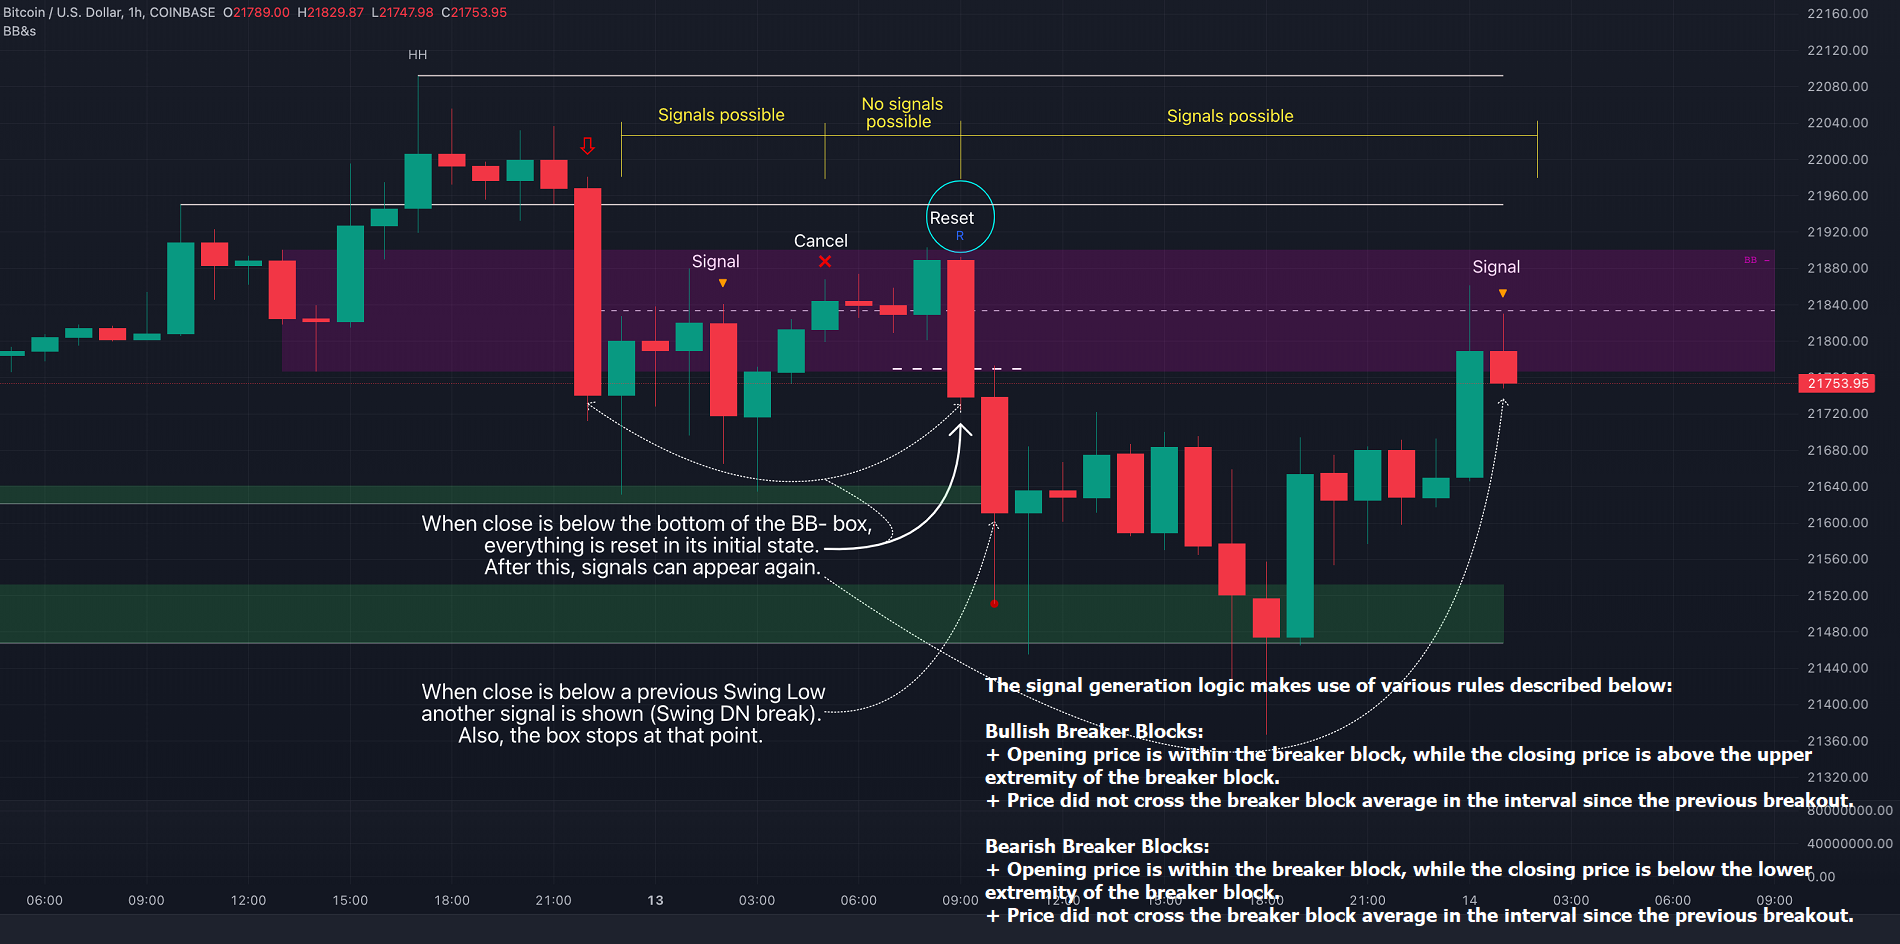
The Breaker Blocks with Signals indicator aims to highlight a complete methodology based on breaker blocks. Breakout signals between the price and breaker blocks are highlighted and premium/discount swing levels are included to provide potential take profit/stop loss levels.
This script also includes alerts for each signal highlighted.
🔶 SETTINGS
🔹 Breaker Blocks
🔹 PD Array
This script also includes alerts for each signal highlighted.
🔶 SETTINGS
🔹 Breaker Blocks
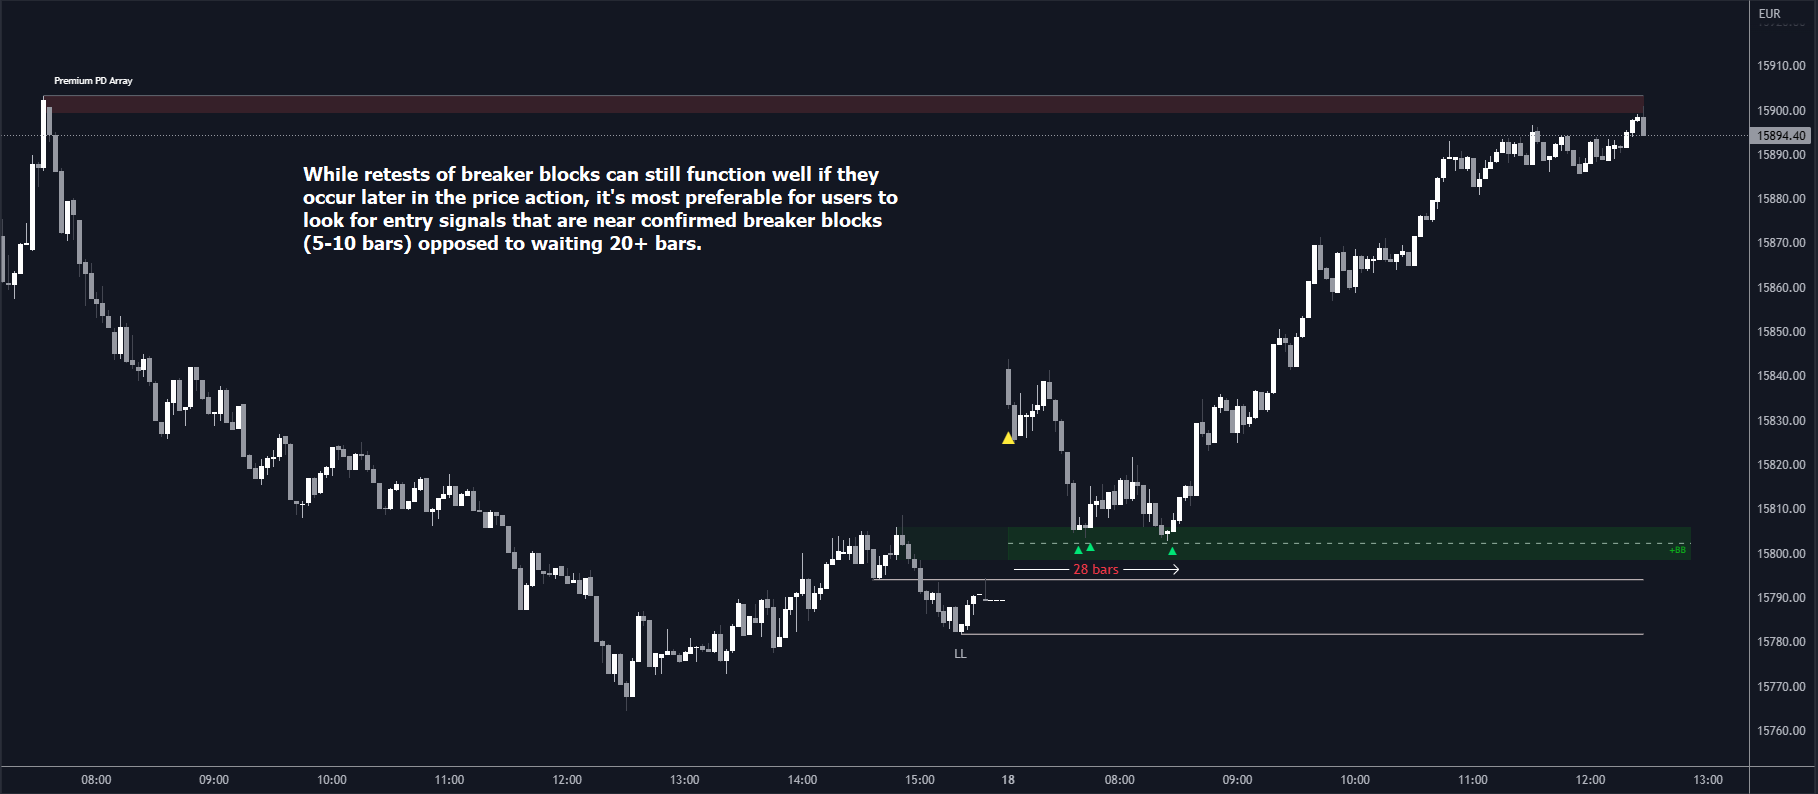
- Length: Sensitivity of the detected swings used to construct breaker blocks. Higher values will return longer term breaker blocks.
- Use only candle body: Only use the candle body when determining the maximum/minimum extremities of the order blocks.
- Use 2 candles instead of 1: Use two candles to confirm the occurrence of a breaker block.
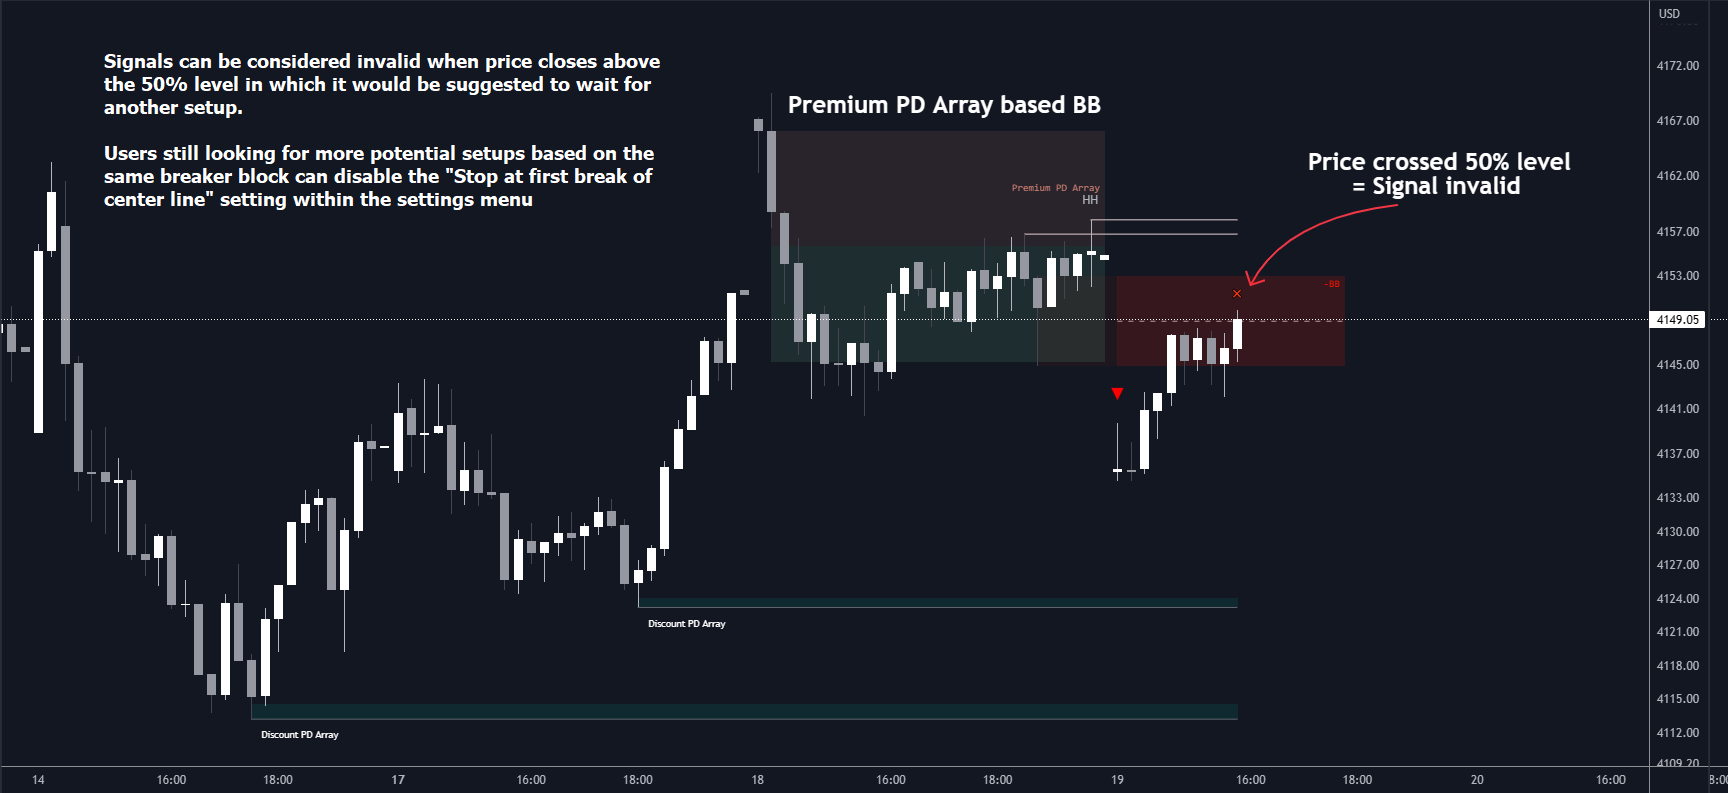
- Stop at first break of center line: Do not highlight breakout signals after invalidation until reset.
🔹 PD Array
- Only when E is in premium/discount zone: Only set breaker block if point E of wave ABCDE is within the corresponding zone.
- Show premium discount zone: Show premium/discount zone.
- Highlight Swing Break: Highlight occurrences of price breaking a previous swing level.
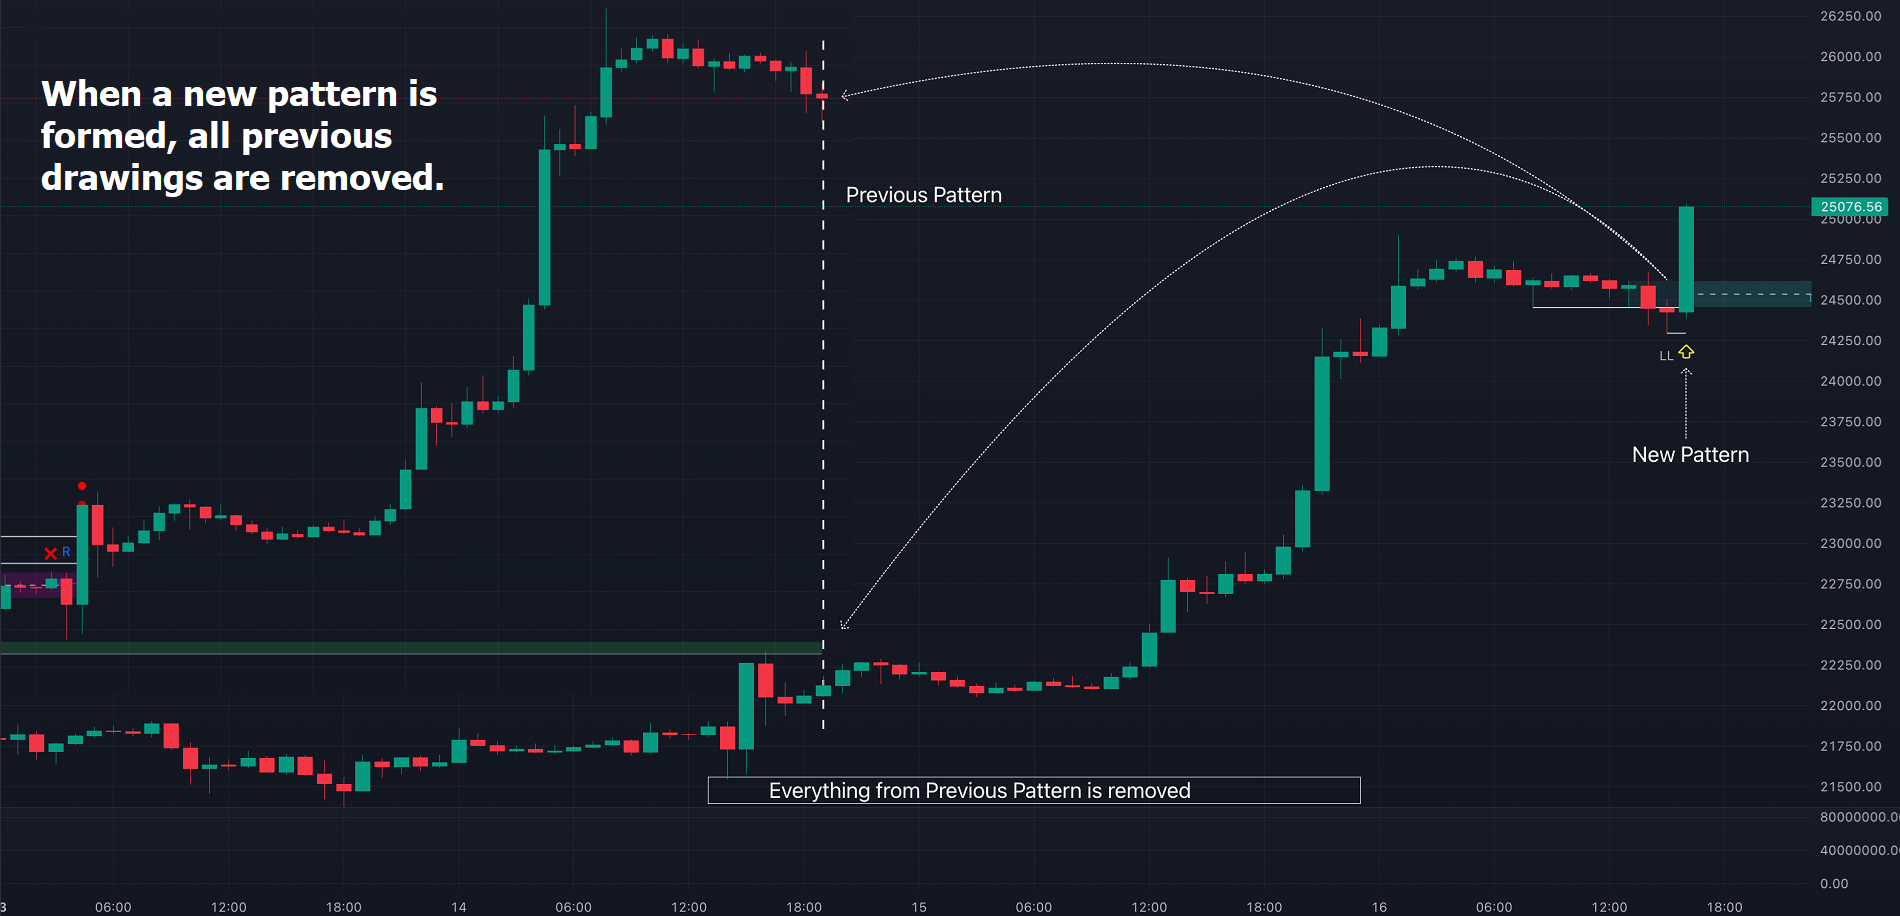
- Show Swings/PD Arrays: Show swing levels/labels and pd areas.
🔶 USAGE
See images.
Frequently Asked Questions
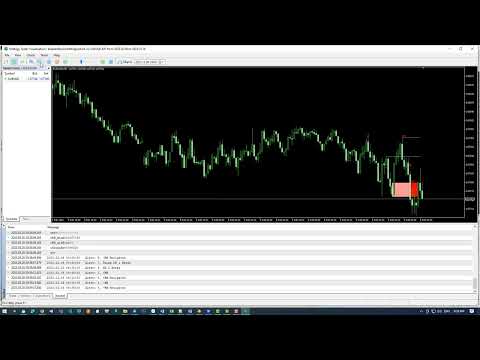
Why nothing show on chart when i load inidicator?
https://www.youtube.com/watch?v=hW-KHHvUCWI
How i build signal scan system with this indicator?