Quantum Live Renko Charts Indicator for MT5
- Индикаторы
- Версия: 2.1
- Обновлено: 17 января 2025
- Активации: 5

Renko is a well-known Japanese charting technique that removes time from the chart. Instead of drawing bars in constant intervals (time) as a normal chart would, a Renko chart does so only when price moves beyond a predefined amount.
In a Renko chart, a bar is created when price exceeds the previous bar’s high or low by a predefined amount or what we call the Box Size. The result is a chart with equally sized bars running up or down in 45 degree angles. Such a chart offers the following advantages:
This filters out the noise that you would see on a normal chart, as the chart is then based solely on price action. This makes key support and resistance levels more apparent and more clearly defined. Formation of trends are also more distinct in a Renko chart as market noise has been removed delivering smoother trading opportunities as trends develop in waterfalls and steep slopes.
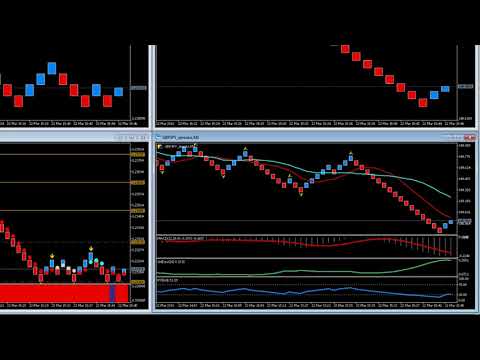
The MT5 platform does not offer a facility for generating Renko charts out of the box. The Quantum Trading Live Renko Charts indicator delivers the perfect chart for the intraday scalping trader, smoothly, efficiently, simply and intuitively, and brings all the advantages of Renko charts to your trading toolkit.
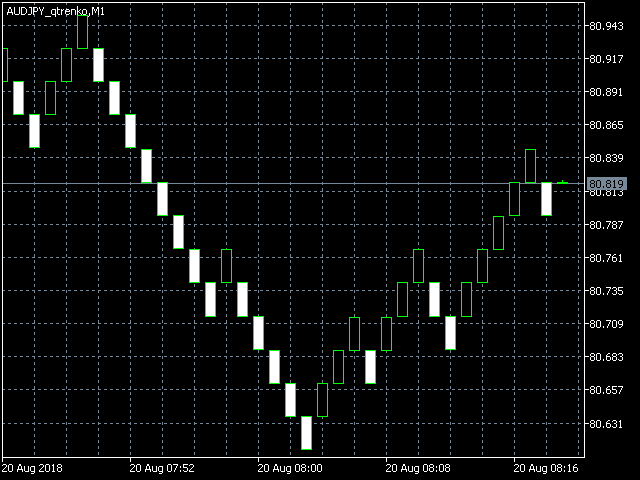
Live, Moving Charts
Unlike its predecessor, the MT5 platform no longer supports Offline Charts but it has recently introduced a new feature called Custom Symbols. This enables the user to create new symbols from existing ones in your terminal and opens up new possibilities for us to develop new ways to present to you other chart types such as Renko.
The Quantum Live Renko Charts indicator still generates live and ticking Renko charts, but it displays them using MT5’s candlestick chart plot. That’s not all. We have extended its feature to take advantage of Custom Symbols which allows you to create a new chart in a window of its own. Its main advantage is it allows you to add other Quantum Trading indicators and even indicators of your own to further your analysis on the Renko chart.
Dual Mode
The Quantum Live Renko Charts indicator for MT5 features two modes:
- Compute Best Box Size
- Fixed Box Size
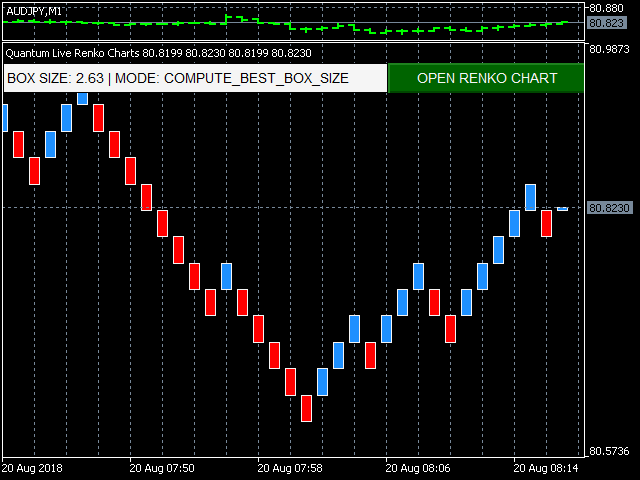
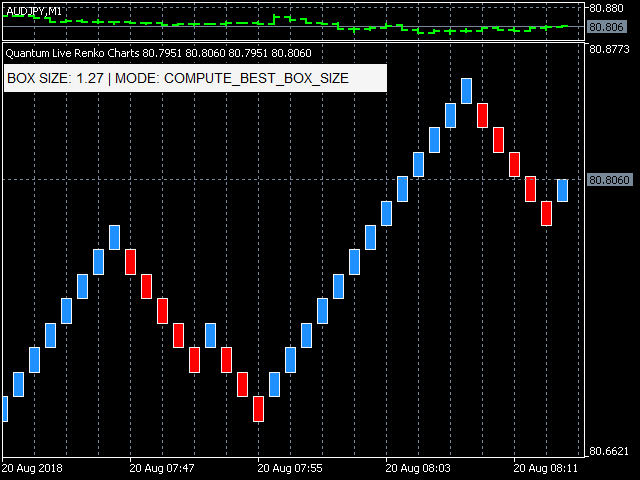
Compute Best Box Size
Using the indicator in this mode allows you to “convert” a normal candlestick chart to a Renko bar chart by computing the best box size for a particular timeframe. This is computed by calculating the average true range (ATR) of the current symbol within a given period on a specific timeframe.
Fixed Box Size
Using the indicator in this mode allows you to set a constant box size for generating Renko bars. The box size can accept floating point numbers with a precision of up to 2 decimal places.
Settings Label
The indicator displays a label at the top right hand side of its own indicator window containing information about the parameters currently in effect. This allows you to manage all instances of the Quantum Live Renko Chart with ease.