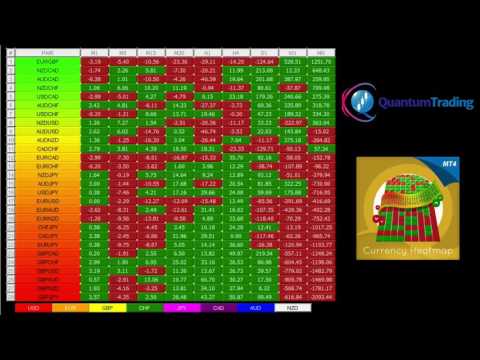
Quantum Currency Heatmap Indicator

Trading the currency markets is a complex business, not least since we are dealing with pairs of currencies, and by inference, pairs of economies. All economies around the world are interlinked, and reflected in the constant ebb and flow of currency strength and weakness. The problem for us as traders is monitoring so many pairs simultaneously, since every pair does not move independently, but reflects the interrelated nature of this market.

The Quantum Currency Heatmap delivers the information you need to base your trading decisions on the data of an entire spectrum of currency pairs derived from the 8 major currencies. Namely USD, EUR, GBP, CHF, JPY, CAD, AUD and finally NZD. In one clear, simple and intuitive table, you can see instantly the entire weight of market sentiment across all 28 pairs, and across all the timeframes.

A global view of risk and sentiment on one chart in two dimensions! Vertically in the ranking table, and then horizontally across the horizon of time. Instant, simple and powerful.

No multiple monitors, no multiple PCs, no crowded screens, no chasing from one timeframe to another and back again. It is all here allowing you to make instant decisions in seconds.

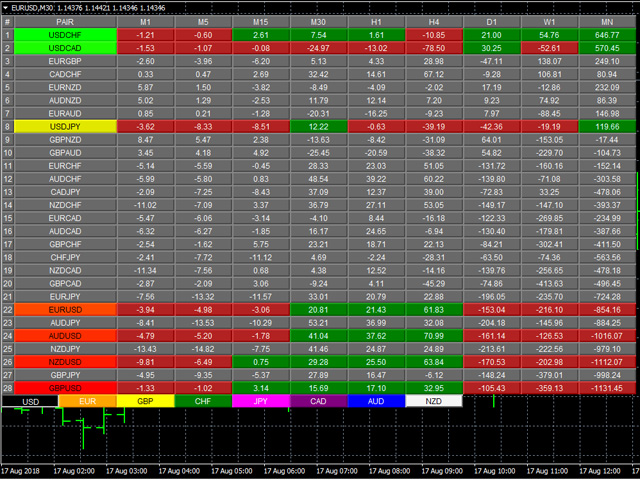
The Quantum Currency Heatmap instantly displays the “hottest” and “coldest” areas of the forex landscape. Vertically, 28 currency pairs are listed which are ranked from the most bullish pair (top) to the most bearish pair (bottom) and which pull the data from the Quantum Currency Matrix. And this is where it gets interesting: horizontally, the performance scores of each currency pair are displayed in 9 timeframes which are 1 minute, 5 minutes, 15 minutes, 30 minutes, hourly, 4 hours, daily, weekly, and monthly.

Each cell of the Quantum Currency Heatmap is color coded which makes it possible to interpret it instantly with just a glance, much like looking at a sophisticated thermal imagery scanner, but for forex. If you check out the indicator, you’ll see how easy and intuitive the layout is, but let’s just expand on it here.

If we start with the performance scores. This is the value the indicator assigns to each currency pair representing how positively or negatively its price moved over a certain period. It can be either of the two colors depending on its value, and this is the color coding used when viewing the currency pairs ACROSS the time horizon – the horizontal!
  • Green – if the currency pair’s performance score is positive.
  • Red – if the currency pair’s performance score is negative
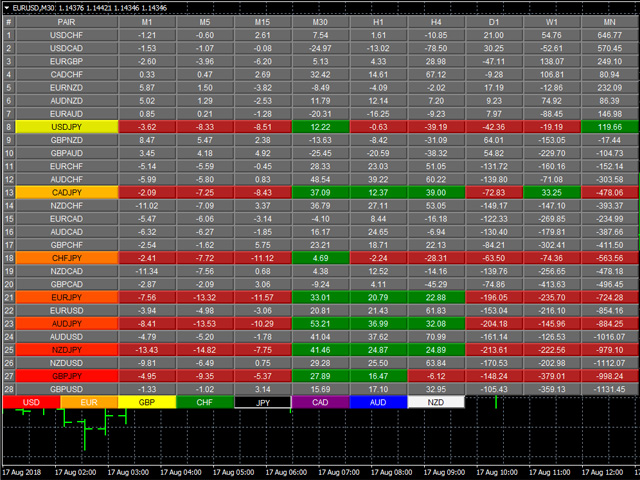
However, the pairs are then ranked VERTICALLY using a dynamic graded color code, transitioning from green, to yellow and to red in that order. The performance scores of the currency pairs in 9 timeframes are added together. The currency pairs are then ranked by their sum from the most positive to the most negative, and are color coded as follows:
  • Green shades – the sum of the currency pair’s performance scores in 9 timeframes, and weighted accordingly, is well above the fulcrum of zero.
  • Yellow shades – the sum of the currency pair’s performance scores in 9 timeframes, and weighted accordingly, is relatively flat and around the fulcrum of 0. It can either be positive or negative but trails the numbers closest to 0.
  • Red shades – the sum of the currency pair’s performance scores in 9 timeframes, and weighted accordingly, is well below the fulcrum of zero.
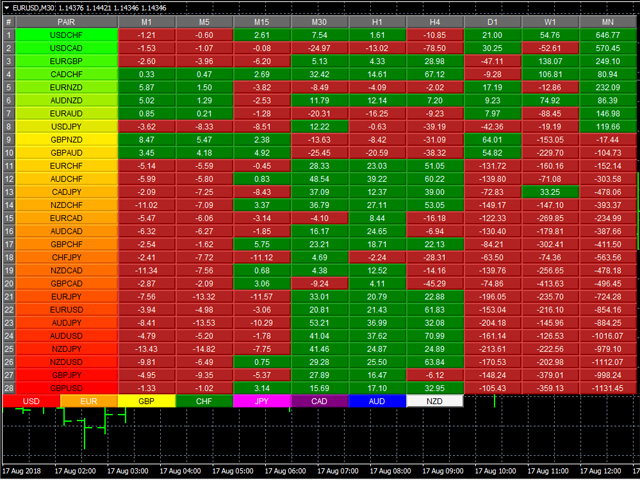
The gradation of color is dynamic. Hence the transition of colors will depend entirely on the sum of the currency pair’s performance scores in the 9 timeframes as explained above. As with all our other indicators, this is dynamic and is constantly shifting in real time to reflect the ebb and flow of sentiment across the timeframes.

The indicator applies a weighting in the ranking ladder to reflect the fact that a trend in a slower timeframe has a greater significance than one in a faster timeframe.

Stepping back, the changing colors deliver a heatmap reflecting the relative performance of the 28 currency pairs across ALL timeframes in realtime. This gives a horizontal analysis of the currency pairs across time. This is immensely powerful and empowering you as a trader to make clear, logical and fast decisions. The heatmap makes the complex world of forex, simple and clear. One workspace delivering information from 252 charts!
Рекомендуем также
Daily Candle Predictor - это индикатор, который предсказывает цену закрытия свечи. Прежде всего индикатор предназначен для использования на графиках D1. Данный индикатор подходит как для традиционной форекс торговли, так и для торговли бинарными опционами. Индикатор может использоваться как самостоятельная торговая система, так может выступать в качестве дополнения к вашей уже имеющейся торговой системе. Данный индикатор производит анализ текущей свечи, рассчитывая определенные факторы силы внут
Профиль Рынка (Market Profile) определяет ряд типов дней, которые помогают трейдеру распознать поведение рынка. Ключевая особенность - это область значений (Value Area), представляющая диапазон ценового действия, в котором произошло 70% торговли. Понимание области значений может помочь трейдерам вникнуть в направление рынка и установить торговлю с более высокими шансами на успех. Это отличное дополнение к любой системе, которую вы возможно используете. Blahtech Limited представляет сообществу Me
Quantum Falcon Signal Free is a smart visual trading indicator for MetaTrader 4 designed for Forex and Gold traders. The indicator combines: • Trend analysis • RSI momentum confirmation • MACD momentum filtering • ATR volatility filtering • Higher timeframe confirmation • Smart exit signal detection Main Features: • Smart Buy and Sell signals • Exit Buy / Exit Sell alerts • Real-time dashboard on chart • Professional candle arrows • Multi-timeframe trend confirmation • ATR market volatility filt
FREE
«Dynamic Scalping Oscillator» — это продвинутый пользовательский индикатор Crypto_Forex, эффективный инструмент для торговли на MT4! — Новое поколение осцилляторов — смотрите изображения, чтобы узнать, как им пользоваться. — Dynamic Scalping Oscillator имеет адаптивные зоны перепроданности/перекупленности. — Осциллятор — вспомогательный инструмент для поиска точных точек входа в динамических зонах перепроданности/перекупленности. — Значения перепроданности: ниже зелёной линии, значения перекупл
Volume Profile Sniper v11.1 -комплексный инструмент для анализа рынка и профессиональный подход к торговле Volume Profile Sniper v11.1 объединяет более 15 ключевых фильтров в одном индикаторе, предоставляя чёткие сигналы на основе комплексной оценки рыночной ситуации. Основные возможности Анализ объёмного дисбаланса   – алгоритм вычисляет долю покупателей и продавцов в каждой свече, сигнализируя о преобладании одной из сторон (настраиваемый порог от 50% до 90%). Многоуровневая фильтрация сигн
Forex Gump
Andrey Kozak
2.4 (5)
Forex Gump - это полностью готовая полуавтоматическая торговая система. В виде стрелок на экран выводятся сигналы для открытия и закрытия сделок. Все, что вам нужно, это следовать указаниям индикатора. Когда индикатор показывает синюю стрелку, Вам нужно открывать ордер на покупку. Когда индикатор показывает красную стрелку, нужно открывать ордер на продажу. Закрываем ордера когда индикатор рисует желтый крестик. Для того, чтобы получить максимально эффективный результат, рекомендуем использовать
Индикатор поддержки и сопротивления для бинарных опционов Этот индикатор разработан специально для торговли бинарными опционами и отлично показывает откаты от уровней поддержки и сопротивления. Сигналы появляются на текущей свече. Красная стрелка, направленная вниз, указывает на потенциальную возможность продажи, а синяя стрелка, направленная вверх, предлагает возможности для покупки. Все, что вам нужно настроить, это цвет сигнальных стрелок. Рекомендуется использовать его на таймфреймах M1-M5,
DualVWAP
Kourosh Hossein Davallou
Dual Timeframe VWAP Indicator for MT4  Description Professional VWAP indicator that displays both **Daily** and **Weekly** VWAP simultaneously on your chart.   Features: - Dual VWAP Lines: Blue for Daily, Red for Weekly - Configurable Bands: Two deviation bands for each timeframe - Session Control: Customizable trading hours for Daily VWAP - Clean Visuals: Solid lines for main VWAP, dashed for bands - Optimizable: Parameters can be optimized using Genetic Algorithm Key Settings: - Enable/di
VR Cub
Vladimir Pastushak
VR Cub это индикатор что бы получать качественные точки входа. Индикатор разрабатывался с целью облегчить математические расчеты и упростить поиск точек входа в позицию. Торговая стратегия, для которой писался индикатор, уже много лет доказывает свою эффективность. Простота торговой стратегии является ее большим преимуществом, что позволяет успешно торговать по ней даже начинающим трейдерам. VR Cub рассчитывает точки открытия позиций и целевые уровни Take Profit и Stop Loss, что значительно повы
Secret Liquidity Zones Indicator User Manual Introduction Unlock the power of hidden market opportunities with the Secret Liquidity Zones Indicator . This cutting‐edge tool is designed to reveal critical price levels where market momentum may shift. With its dynamic adaptability and sleek gold visuals, it offers clear and elegant insights into key trading opportunities—making it the perfect secret weapon for traders who demand precision and clarity. Key Features Dynamic Timeframe Adaptation: A
Quantum Balance — это современный стрелочный индикатор, который определяет ключевые точки разворота цены на рынке с высокой точностью. Он основан на сочетании WPR (Williams %R) и RSI (Relative Strength Index), что позволяет выявлять моменты перекупленности/перепроданности и входить в сделки в точках максимального потенциала. Индикатор анализирует динамику цены и рыночные условия, создавая сигналы только при совпадении нескольких подтверждающих факторов. Это снижает количество ложных сигналов и
Fibonacci retracement and extension line drawing tool Fibonacci retracement and extended line drawing tool for MT4 platform is suitable for traders who use  golden section trading Advantages: There is no extra line, no too long line, and it is easy to observe and find trading opportunities Trial version: https://www.mql5.com/zh/market/product/35884 Main functions: 1. Multiple groups of Fibonacci turns can be drawn directly, and the relationship between important turning points can be seen
Super Reversal Pattern Indicator Unlock the power of advanced pattern recognition with our Super Reversal Pattern Indicator. Designed for traders seeking precision and reliability, this indicator identifies one of the most effective reversal patterns in technical analysis, offering a significant edge in your trading strategy. Key Features: Non-Repainting Accuracy: Enjoy the confidence of non-repainting technology. Once a Super Reversal Pattern is detected, it remains static, providing consiste
EARLY REMINDER: The Starting price is 65 price will rise soon up to 365$ and then 750$ after first 10 copies of sales. Grab this offer now! Introduction Hello, traders! Welcome to the demonstration of the Forex Beast Indicator , a comprehensive tool designed to assist aspiring traders in navigating the complexities of the forex market. This indicator incorporates seven essential components to provide a well-rounded trading experience: Moving Averages Colored Zones Support and Resistance Levels
Индикатор SMC Venom Model BPR — профессиональный инструмент для трейдеров, работающих в рамках концепции Smart Money (SMC). Он автоматически идентифицирует на графике цены два ключевых паттерна:  FVG (Fair Value Gap) — комбинация их трёх свечей, в которой имеется разрыв между первой и третьей свечой. Формирует зону между уровнями, где отсутствует поддержка объемов, что часто приводит к коррекции цены. BPR (Balanced Price Range)— комбинация двух FVG-паттернов, образующих «мост»  — зону пробоя и в
The Super Arrow Indicator provides non-repainting buy and sell signals with exceptional accuracy. Key Features No repainting – confirmed signals remain fixed Clear visual arrows: green for buy, red for sell Real-time alerts via pop-up, sound, and optional email Clean chart view with no unnecessary clutter Works on all markets: Forex, gold, oil, indices, crypto Adjustable Parameters TimeFrame Default: "current time frame" Function: Sets the time frame for indicator calculation Options: Can be set
Power Bar Signal Indicator
Gholamreza Ali Samimi Sereshki
Power Bar Signal Indicator Профессиональный сигнальный индикатор, разработанный для торговли на синтетических парах. Используя многоэтапную систему и реальные статистические данные, он помогает трейдерам находить сигналы с высокой вероятностью успеха. Основные функции Многоэтапная система проверки сигналов (2/3/4 этапа) Адаптивная фильтрация сигналов для различных рыночных условий Реальная статистика эффективности в реальном времени Настройка под различные таймфреймы и пары Оптимизирован для син
Этот индикатор предназначен для скальпинга на низких таймфреймах (M1–M15) на волатильных рынках, таких как основные валютные пары (например, EURUSD, GBPUSD). Он генерирует неперерисовывающиеся сигналы на покупку (зеленая стрелка вверх) и продажу (красная стрелка вниз) на основе пересечения экспоненциальных скользящих средних (EMA), подтвержденного импульсом RSI и пересечением MACD, минимизируя ложные сигналы на флетовом рынке. Как использовать: Прикрепите индикатор к графику MT4. Ищите стрелки
Shark Deal Book
Philip Pankaj Suthagar
4 (3)
Term  "shark"  in the business world denotes a high volume investor who just made a good investment in a highly Potential business deal.So, sharks are the ones who make the market move. In our case, if an American shark bought a Japanese company, he/she has to convert American dollars into Japanese yen to make the deal. So, the demand for the Japanese yen will increase sharply. Thus USD/JPY will go short rapidly if the deal was from the shark. Another example, In the case of forex, if fed increa
Индикаторы [ZhiBiCCI] подходят для всех циклов использования, а также подходят для всех разновидностей рынка. [ZhiBiCCI] Зеленая сплошная линия - разворот бычьей дивергенции. Зеленая пунктирная линия - классическая бычья дивергенция. [ZhiBiCCI] Сплошная линия к красному - обратная медвежья дивергенция. Красная пунктирная линия - классическая медвежья дивергенция. [ZhiBiCCI] можно установить в параметрах (Предупреждение, Отправить почту, Отправить уведомление), установить на (true) для отправк
Индикатор Crypto_Forex "Auto FIBO Pro" - отличный вспомогательный инструмент в торговле! - Индикатор автоматически рассчитывает и размещает на графике уровни Фибоначчи и локальные линии тренда (красного цвета). - Уровни Фибоначчи указывают ключевые области, где цена может развернуться. - Наиболее важными уровнями являются 23,6%, 38,2%, 50% и 61,8%. - Вы можете использовать его для скальпинга на разворот или для торговли по зональной сетке. - Существует множество возможностей улучшить вашу текущ
Ночной Призрак - Стрелочный индикатор для Бинарных опционов. Это надежный помощник вам в будущем! -Отсутствует перерисовка на графике -Работает отлично на валютных парах EUR/USD! -Точность индикатора до 90% (Особенно ночью) -Не нужно долго настраивать (Настроено идеально для Бинарных Опционов) -Не опаздывающие сигналы -Появление сигнала на текущей свече -Идеально подходит для периода М1 (Не Больше!) -Удобный для глаз цвет свечей (Красный и Синий) -Установлен Алерт  Работа с ним: -Синяя стрелка
Price Magnet — Индикатор зон плотности цены и уровней притяжения Price Magnet — это профессиональный аналитический инструмент, который определяет ключевые уровни поддержки и сопротивления на основе статистической плотности распределения цены (Price Density). Индикатор анализирует заданный исторический период и находит ценовые значения, на которых рынок находился дольше всего. Эти зоны выступают в роли «магнитов» — они притягивают цену или служат фундаментом для разворота. В отличие от стандартны
EZZ Elite Zig Zag is an indicator for the MetaTrader 4 terminal. This indicator traces the peak of the trend based on the market reversal, thus showing various opportunities in the financial market. EZZ Elite Zig Zag is a visual tool, intuitive, and easy to understand and use.  Test it Yourself by Downloading it for Free. Author Paulo Rocha all rights reserved
Уникальная мультивалютная авторская стратегия, одновременно определяющая силу трендов и точки входа в рынок, визуализируя это с помощью гистограмм на графике. Индикатор оптимально адаптирован для торговли на временных периодах М5, М15, М30, Н1. При этом для удобства пользователя по определенной точке всегда появляется точка входа (в виде стрелки), рекомендуемые уровни получения прибыли (TP1, TP2 с текстовыми метками) и рекомендация по установке Стоп Лосс. Уровни получения прибыли (TP1, TP2) авто
KT Renko Patterns MT4
KEENBASE SOFTWARE SOLUTIONS
2.33 (3)
KT Renko Patterns анализирует график Ренко кирпич за кирпичиком, чтобы найти известные графические паттерны, которые часто используют трейдеры на различных финансовых рынках. По сравнению с графиками на основе времени, торговля по паттернам на графиках Ренко легче и нагляднее благодаря их чистому виду. KT Renko Patterns включает несколько паттернов Ренко, многие из которых подробно описаны в книге «Профитная торговля с графиками Ренко» авторства Прашанта Шаха. Полностью автоматизированный сове
MajorAlert   – это профессиональный индикатор для MetaTrader 4, объединяющий два различных подхода к анализу рынка в одном инструменте. Благодаря интеграции   контр‑трендовой   логики (верхний блок) и   трендового   фильтра (нижний блок) индикатор выводит на график высокоточные сигналы, выделенные разными цветами стрелок. Ключевые особенности Полная автономность   – не требует внешних индикаторов, все расчёты встроены. Гибкие настройки   – параметры можно адаптировать под любой инструмент и тай
This is a Binary Options signal indicator. Extremely powerful for the 1 min chart. The signals are based on my personal tweak (based on real trial and error & backtested) of the RSI, ADX and Ichimoku and my observation on how price moves. It turns out, 2 candles expiry is the most consistent with this set up. How to use: 1. Wait for arrow signal to show. 2. Place a 2 candle expiry right after the close of the signal candle. So if you are trading a 1 min chart, place an expiry for 2 mins... if yo
Noize Absorption Index - is the manual trading system that measures the difference of pressure between bears forces and bulls forces. Green line - is a noize free index that showing curent situation. Zero value of index shows totally choppy/flat market.Values above zero level shows how powerfull bullish wave is and values below zero measures bearish forces.Up arrow appears on bearish market when it's ready to reverse, dn arrow appears on weak bullish market, as a result of reverse expectation. S
Performance Analytics 1.4 is an advanced real-time performance-tracking and risk-management indicator designed for traders who work with multiple EAs or simultaneous setups and need accurate, persistent, instance-separated metrics. It displays on-screen key statistics for both the entire account and the current EA, including profits, maximum losses, professional performance metrics, and smart alerts. The indicator visually divides the information into two independent blocks : 1. White Block – Ge
С этим продуктом покупают
Neuro Poseidon - новый индикатор от Дарьи Резуевой. Он сочетает точные торговые сигналы с адаптивными уровнями TP/SL , в результате создавая максимально выгодные сделки! TO SWITCH TO   ENG   PLEASE CHOOSE IT IN THE UPPER-RIGHT CORNER OF THE WEBSITE Напишите мне после покупки и получите Neuro Poseidon Assistant в подарок для автоматизации вашей торговли! Что отличает его от других индикаторов? 1. Доказанная прибыльность на всех активах и таймфреймах 2. На графике присутствуют только подтвержденн
Gann Made Easy - это профессиональная, но при этом очень простая в применении Форекс система, основанная на лучших принципах торговли по методам господина У.Д. Ганна. Индикатор дает точные BUY/SELL сигналы, включающие в себя уровни Stop Loss и Take Profit. ПОЖАЛУЙСТА, СВЯЖИТЕСЬ СО МНОЙ ПОСЛЕ ПОКУПКИ, ЧТОБЫ ПОЛУЧИТЬ ТОРГОВЫЕ ИНСТРУКЦИИ И ОТЛИЧНЫЕ ДОПОЛНИТЕЛЬНЫЕ ИНДИКАТОРЫ БЕСПЛАТНО! Вероятно вы уже не раз слышали о торговли по методам Ганна. Как правило теория Ганна отпугивает от себя не только н
M1 SNIPER — это простая в использовании торговая система. Это стрелочный индикатор, разработанный для тайм фрейма M1. Индикатор можно использовать как отдельную систему для скальпинга на тайм фрейме M1, а также как часть вашей существующей торговой системы. Хотя эта торговая система была разработана специально для торговли на M1, ее можно использовать и с другими тайм фреймами. Первоначально я разработал этот метод для торговли XAUUSD и BTCUSD. Но я считаю этот метод полезным и для торговли на д
Trend Catcher ind
Ramil Minniakhmetov
5 (2)
Trend Catcher   анализирует движения рыночных цен, используя комбинацию собственных и индивидуально разработанных адаптивных индикаторов анализа тренда. Он определяет истинное направление рынка, отфильтровывая краткосрочные шумы и фокусируясь на силе импульса, расширении волатильности и поведении ценовой структуры. Он также использует комбинацию сглаживающих и фильтрующих тренд индикаторов, таких как скользящие средние, RSI и фильтры волатильности. Мониторинг реальных операций, а также другие
Этот индикатор представляет собой индикатор автоматического волнового анализа, который идеально подходит для практической торговли! Случай... Примечание.   Я не привык использовать западные названия для классификации волн. Из-за влияния соглашения об именах Тан Лунь (Тан Чжун Шуо Дзен) я назвал основную волну   ручкой   , а вторичную полосу волн —   сегментом   Ат. в то же время сегмент имеет направление тренда. Именование   в основном является трендовым сегментом   (этот метод именования буде
Scalper Inside PRO Scalper Inside PRO — это индикатор внутридневного тренда и скальпинга для MetaTrader 4, который использует эксклюзивный алгоритм для быстрой оценки направления рынка и ключевых целевых уровней. Он автоматически рассчитывает точки входа, выхода и несколько уровней фиксации прибыли, а также показывает подробную статистику результативности, чтобы вы могли видеть, как разные инструменты и стратегии работали раньше. Это помогает выбирать наиболее подходящие торговые инструменты под
Trend Breakout Arrows Indicator The Trend Breakout Arrows Indicator is a momentum-based signal tool designed to identify potential bullish and bearish breakout opportunities. It displays clear arrow signals directly on the price chart, helping traders quickly recognize possible trend changes and continuation setups. Up Arrow (Buy Signal) A magenta up arrow appears below a candle when bullish momentum begins to strengthen. This signal indicates that buying pressure may be overtaking selling press
PRO Renko System - это высокоточная система торговли на графиках RENKO. Система универсальна. Данная торговая система может применяться к различным торговым инструментам. Система эффективно нейтрализует так называемый рыночный шум, открывая доступ к точным разворотным сигналам. Индикатор прост в использовании и имеет лишь один параметр, отвечающий за генерацию сигналов. Вы легко можете адаптировать алгоритм к интересующему вас торговому инструменту и размеру ренко бара. Всем покупателям с удовол
Current event:  https://c.mql5.com/1/326/A2SR2025_NoMusic.gif А. Что такое A2SR?   * Это опережающий технический индикатор (без перерисовки, без запаздывания) . -- Учебники : -- на https://www.mql5.com/ru/blogs/post/734748/page4#comment_16532516   -- и https://www.mql5.com/ru/users/yohana/blog A2SR имеет особую технику определения уровней Поддержки (спроса) и Сопротивления (предложения). В отличие от обычного способа, который мы видели в сети, A2SR имеет оригинальную концепцию определения факти
Advanced Supply Demand
Bernhard Schweigert
4.91 (300)
Специальное предложение – скидка 30% Этот индикатор является уникальным, качественным и доступным инструментом для торговли, включающим в себя наши собственные разработки и новую формулу. В обновленной версии появилась возможность отображать зоны двух таймфреймов. Это означает, что вам будут доступны зоны не только на старшем ТФ, а сразу с двух таймфреймов - таймфрейма графика и старшего: отображение вложенных зон. Обновление обязательно понравится всем трейдерам, торгующим по зонам спроса и пре
MetaBands M4
Vahidreza Heidar Gholami
3.5 (6)
MetaBands использует мощные и уникальные алгоритмы для построения каналов и обнаружения тенденций, чтобы предоставлять трейдерам потенциальные точки для входа и выхода из сделок. Это индикатор канала плюс мощный индикатор тенденций. Он включает различные типы каналов, которые могут быть объединены для создания новых каналов, просто используя параметры ввода. MetaBands использует все типы оповещений, чтобы уведомлять пользователей о событиях на рынке. Особенности Поддерживает большинство алгоритм
Genesis Matrix Pro is a professional multi-timeframe trend detection indicator designed to help traders identify high-quality market alignment with clarity and structure. It combines 12 different technical indicators into one visual alignment matrix, allowing traders to quickly see when market conditions are bullish, bearish, or neutral. A signal is generated only when the selected strategies are aligned, helping reduce noise and improve decision-making. PLEASE CONTACT ME AFTER PURCHASE TO GET
Этот продукт был обновлен для рынка 2026 года и оптимизирован для последних сборок MT5. УВЕДОМЛЕНИЕ ОБ ИЗМЕНЕНИИ ЦЕНЫ: Smart Trend Trading System сейчас доступен за $99 . Цена увеличится до $199 после следующих 30 покупок . СПЕЦИАЛЬНОЕ ПРЕДЛОЖЕНИЕ: После покупки Smart Trend Trading System отправьте мне личное сообщение, чтобы получить Smart Universal EA БЕСПЛАТНО и превратить сигналы Smart Trend в автоматические сделки. Smart Trend Trading System — это полноценная торговая система без перерисов
Dynamic Forex28 Navigator — инструмент для торговли на рынке Форекс нового поколения. В НАСТОЯЩЕЕ ВРЕМЯ СКИДКА 49%. Dynamic Forex28 Navigator — это эволюция наших популярных индикаторов, объединяющая мощь трех в одном: Advanced Currency Strength28 Indicator (695 отзывов) + Advanced Currency IMPULSE with ALERT (520 отзывов) + CS28 Combo Signals (бонус). Подробности об индикаторе https://www.mql5.com/en/blogs/post/758844 Что предлагает индикатор Strength нового поколения?  Все, что вам нравило
BTMM State Engine Pro is a MetaTrader 4 indicator for traders who use the Beat The Market Maker approach: Asian session context, kill zone timing, level progression, peak formation detection, and a multi-pair scanner from a single chart. It combines cycle state logic with a built-in scanner dashboard so you do not need the same tool on many charts at once. What it does Draws the Asian session range; session times can follow broker server offset or be set in inputs. Tracks level progression (L
IQ FX Gann Levels a precision trading indicator based on W.D. Gann’s square root methods . It plots real-time, non-repainting support and resistance levels to help traders confidently spot intraday and scalping opportunities with high accuracy. William Delbert Gann (W.D. Gann) was an exceptional market analyst, whose trading technique was based on a complex blend of mathematics, geometry, astrology, and ancient mathematics which proved to be extremely accurate. Setup & Guide:  Download  MT5 Ver
Свинг-трейдинг - это первый индикатор, предназначенный для обнаружения колебаний в направлении тренда и возможных разворотов. Он использует базовый подход свинговой торговли, широко описанный в торговой литературе. Индикатор изучает несколько векторов цен и времени для отслеживания направления совокупного тренда и выявляет ситуации, когда рынок перепродан или перекуплен и готов к исправлению. [ Руководство по установке | Руководство по обновлению | Устранение неполадок | FAQ | Все продукты ] П
Price & Time Market Structure Indicator A professional market structure tool that analyzes waves through both price and time — not price alone. Main Description NeoWave PRO is a professional market structure indicator for MetaTrader 4 designed for traders who want to move beyond traditional one-dimensional wave tools such as ZigZag, swing indicators, and basic high/low systems. Most wave indicators analyze only one thing: Price. But a real market wave is not only a price movement. A true wave de
GOLD Impulse with Alert
Bernhard Schweigert
4.67 (12)
Этот индикатор является супер комбинацией двух наших продуктов Advanced Currency IMPULSE with ALERT  +   Currency Strength Exotics . Он работает на всех временных рамках и графически показывает импульс силы или слабости для 8 основных валют плюс один символ! Этот индикатор специализирован для отображения ускорения силы валюты для любых символов, таких как золото, экзотические пары, товары, индексы или фьючерсы. Первый в своем роде, любой символ может быть добавлен в 9-ю строку, чтобы показат
Индикатор " Dynamic Scalper System " разработан для скальпингового метода торговли внутри трендовых волн. Тестировался на основных валютных парах и золоте, возможна совместимость с другими торговыми инструментами. Дает сигналы для кратковременного открытия позиций по тренду с дополнительным сопровождением движения цены. Принцип действия индикатора. Большие стрелки определяют направление тренда. Внутри трендовых волн действует алгоритм генерации сигналов для скальпинга в виде маленьких стрело
Также доступна версия для MT5 https://www.mql5.com/ru/market/product/170916 Свинг-версия M30/H1/H4 доступна Хотите ловить большие движения? Gold Signal Swing Pro (M30/H1/H4). Цель: $20-$80+ за сделку. https://www.mql5.com/en/market/product/177643 KURAMA GOLD SIGNAL PRO (MT4) — Полная Торговая Система XAUUSD с 7-Слойным Фильтром, Автоматическим TP/SL и Оценкой Качества БЕЗ ПЕРЕРИСОВКИ. БЕЗ ПЕРЕПРОРИСОВКИ. БЕЗ ЗАДЕРЖКИ
Паттерн 123 - один из самых популярных, мощных и гибких графических паттернов. Паттерн состоит из трех ценовых точек: дна, пика или долины и восстановления Фибоначчи между 38,2% и 71,8%. Паттерн считается действительным, когда цена выходит за пределы последнего пика или долины, в момент, когда индикатор строит стрелку, выдает предупреждение, и сделка может быть размещена. [ Руководство по установке | Руководство по обновлению | Устранение неполадок | FAQ | Все продукты ] Четкие торговые сигна
Enigmera
Ivan Stefanov
5 (8)
ENIGMERA: Основы рынка Важно: демо-версия на MQL5.com работает в Strategy Tester и может не полностью отображать функциональность Enigmera. Ознакомьтесь с описанием, скриншотами и видео для подробной информации. Не стесняйтесь обращаться с вопросами! Код индикатора был полностью переписан. Версия 3.0 добавляет новые функции и устраняет ошибки, накопившиеся с момента появления индикатора. Введение Этот индикатор и торговая система представляет собой уникальный подход к финансовым рынкам. ENIGMER
Сейсмограф Детектор рыночных землетрясений. Description in English : https://www.mql5.com/en/market/product/113869?source=Site+Market+Product+Page#description How to use the Seismograph : https://www.mql5.com/en/market/product/113869#!tab=comments&page=2&comment=52806941 Create an EA : https://www.mql5.com/en/market/product/113869#!tab=comments&page=3&comment=52816509 Каким бы способом вы ни торговали, вам определенно следует избегать входа на рынок с низкой ликвидностью. - Сейсмограф пом
Introduction to Fractal Pattern Scanner Fractal Indicator refers to the technical indicator that makes use of the fractal geometry found in the financial market. Fractal Pattern Scanner is the advanced Fractal Indicator that brings the latest trading technology after the extensive research and development work in the fractal geometry in the financial market. The most important feature in Fractal Pattern Scanner is the ability to measure the turning point probability as well as the trend probabi
TREND LINES PRO помогает понять, где рынок действительно меняет направление. Индикатор показывает реальные развороты тренда и места, где крупные участники входят повторно. Вы видите BOS-линии смены тренда и ключевые уровни старших таймфреймов — без сложных настроек и лишнего шума. Сигналы не перерисовываются и остаются на графике после закрытия бара. VERSION MT 5     -     Раскрывает свой максимальный потенциал в связке с индикатором  RFI LEVELS PRO Что показывает индикатор: Реальные смены   тр
The Propfolio Master Suite is the ultimate all-in-one analytical workstation for professional traders. Combining the power of the Beat The Market Maker (BTMM) methodology, Smart Money Concepts (SND/Liquidity), and Advanced Volume Profile, this suite replaces multiple different indicators with one optimized engine. Monitor up to 14 pairs simultaneously from a single chart, instantly identify market cycles, and seamlessly map institutional footprints with the click of a button. The Command Center
Индикатор точно показывает точки разворота и зоны возврата цены, где входят крупные игроки . Вы видите, где формируется новый тренд, и принимаете решения с максимальной точностью, держа контроль над каждой сделкой. VERSION MT5     -     Раскрывает свой максимальный потенциал в связке с индикатором  TREND LINES PRO Что показывает индикатор: Разворотные конструкции и разворотные уровни с активацией в начале нового тренда. Отображение уровней  TAKE PROFIT  и  STOP LOSS  с минимальным соотношением
СЕЙЧАС СКИДКА 40% !!! Лучшее решение для новичка или трейдера-эксперта! Этот индикатор является уникальным, высококачественным и доступным торговым инструментом, поскольку мы включили в него ряд собственных функций и секретную формулу. Всего на ОДНОМ графике он выдает алерты по всем 28 валютным парам. Представьте, как улучшится ваша торговля, ведь вы сможете точно определить точку запуска нового тренда или возможность скальпирования! Построенный на новых базовых алгоритмах, он позволяет еще
IQ FX Strength  answers the single most important question in trading: "Who is truly driving the market right now?" Designed with a stunning Hybrid UI, this tool separates true trend moves from market noise, allowing you to catch "Explosive" moves before the crowd sees them. System Requirement: For higher accurate signal and optimal, smoother performance of this indicator without any lag, a good CPU (with   RAM of  atleast 8GB or above) and fast internet connection is highly recommended. IQ FX
Другие продукты этого автора
Renko is a well-known Japanese charting technique that removes time from the chart. Instead of drawing bars in constant intervals (time) as a normal chart would, a Renko chart does so only when price moves beyond a predefined amount. In a Renko chart, a bar is created when price exceeds the previous bar’s high or low by a predefined amount or what we call the Box Size. The result is a chart with equally sized bars running up or down in 45 degree angles. Such a chart offers the following advant
Quantum VWAP Pro
QUANTUM TRADING SOFTWARE LIMITED
The VWAP indicator is another of our suite of volume indicators and one which was first referred to in 1988 when it appeared in an article entitled “The Total Cost Of Transactions On The NYSE” in the March edition of the Journal Of Finance from that year, which went on to explain its importance, particularly from an institutional perspective, which underpins its significance in appreciating the power and importance of this indicator. In many ways, it is akin to the volume price analysis methodol
Quantum Tick Volumes Indicator
QUANTUM TRADING SOFTWARE LIMITED
5 (1)
Многие Forex-трейдеры предполагают, что такого понятия как объем на валютном рынке не существует. И будут по-своему правы. Центральной биржевой площадки еще никто не создал. А даже если бы она и была, какие данные об объме она могла бы предоставить? Мы имеем дело с торговой активностью, которая выражается в тиковом объеме. Ведь в конечном итоге объем - это просто проявление активности покупателей и продавцов на рынке. То есть, для получения данных об объеме требуется анализ активности и наоборот
Ваш успех как трейдера зависит от умения определять состояния перекупленности и перепроданности валюты или символа. То есть их силу или слабость. Именно этот подход и лежит в основе торговли на рынке Forex. Сделать это быстро и просто самому было бы практически невозможно, не будь индикатора Quantum Currency Strength - слишком много валют и символов. Вам определенно понадобится помощь! Индикатор Quantum Currency Strength был создан с единственной целью: дать вам глобальную картину по восьми осно
Валютные пары никогда не растут и не падают по прямой. Их подъемы и падения перемежаются откатами и разворотами. Каждый рост и каждое падение отражается и на вашем эмоциональном состоянии: надежда сменяется страхом, а когда он проходит, снова появляется надежда. Рынок использует ваш страх для того, чтобы не дать вам воспользоваться сильной позицией. В такие моменты вы наиболее уязвимы. Все изменится, если вы будете использовать индикатор Quantum Trend Monitor. Кроме того, в данном случае вы полу
Quantum Trends Indicator
QUANTUM TRADING SOFTWARE LIMITED
1 (1)
Один из старейших принципов торговли гласит "сделай тренд своим другом". Наверняка, вам встречалось это выражение. Однако на деле не все так просто! Во-первых, тренд сначала нужно определить, а потом еще и постараться удержаться в нем, а это не легко. Более того, максимально увеличить свою прибыль за счет этого чрезвычайно трудно. И вообще, как определить начало тренда? Если оглянуться назад, то это не составит никакого труда. Но в условиях живого рынка сделать это будет уже не так просто. Индик
Quantum Dynamic Price Pivots Indicator
QUANTUM TRADING SOFTWARE LIMITED
1 (1)
Несмотря на то, что научиться интерпретировать свечной график может любой амбициозный трейдер на ценовом действии, на овладение этим навыком в совершенстве уйдут годы. Простым же смертным без помощи не обойтись. Вот где будет полезен индикатор Quantum Dynamic Price Pivots. Как ведущий индикатор, основанный исключительно на ценовом действии, он генерирует достаточное количество простых и ясных сигналов, с клинической эффективностью отмечая потенциальные точки разворота. Так же как объем и цена, п
Задумывались ли вы когда-нибудь, почему столько трейдеров остаются один на один со слабыми позициями не на той стороне рынка? Одна из причин этому - волатильность. Валютная пара неожиданно начинает движение на новостях или выходе экономических данных. Предвкушая быструю и легкую прибыль, на рынок сразу устремляются трейдеры. И вдруг цена разворачивается. Происходит это на всех таймфреймах и на всех символах. Закрытие свечи или бара с широким спредом сменяется резким разворотом цены, оставляя тре
Не хотелось бы констатировать очевидное, но американский доллар - это важнейшая валюта для трейдеров, и не только на рынке Forex. Без четкого представления о USD торговый процесс будет напоминать вождения автомобиля в условиях тумана. Когда произойдет авария - это лишь вопрос времени. Именно поэтому мы разработали два индекса USD. Первый называется Quantum DXY, а второй - Quantum USDX. В чем же их отличие? Толчком к созданию Quantum USDX послужил тот факт, что, по мнению многих Forex трейдеров,
Индикатор Quantum VPOC был разработан для расширения двумерного изучения объема и цены до трехмерного, включающего время. Соотношение объем/цена/время предоставляет реальное понимание внутренней работы рынка и сердцебиение настроения и риска, который соответственно движет ценовым действием. Индикатор Quantum VPOC отображает несколько ключевых элементов информации на графике следующим образом: Volume Profile - показывается в виде гистограммы по объему на вертикальной оси цены на правой стороне гр
This indicator has been developed to identify and display these trends quickly and easily, allowing you to see instantly, those currency pairs which are trending, and those which are not – and in all timeframes, with just one click. The 28 currency pairs are displayed as a fan as they sweep from strong to weak and back again, and this is why we call it the ‘currency array’. All 28 pairs are arrayed before you, giving an instant visual description of those pairs that are trending strongly, those
The words powerful, unique and game changing are ones that are often over used when applied to trading indicators, but for the MT4/MT5 Quantum Camarilla levels indicator, they truly describe this new and exciting indicator completely. Why? Because the indicator has something to offer every trader, from the systematic to the discretionary and from swing trading to breakout trading. And it’s not an indicator which is simply used for entries. The Camarilla indicator delivers in all areas, from get
The Market Strength Indicator (MSI) is yet another in our stable of volume-based indicators, and as such, is a must-have tool for trading virtually any type of market and across a myriad of applications from trend trading to swing trading, scalping, and much more. While its sister indicator, the Currency Strength Indicator (CSI), helps you analyze which currencies are oversold, overbought, correlating, and trending, the MSI or Market Strength Indicator does this also, but in this case, for all m
Quantum VRSI
QUANTUM TRADING SOFTWARE LIMITED
The VRSI indicator is another in the suite of volume indicators we have developed and one that complements our volume price analysis methodology perfectly. and was developed out of a desire to build further on our cornerstone of VPA by peeling back the layers of volume and considering the relative aspect of volume. Hence, the acronym of Volume Relative Strength Index indicator encapsulates what the indicator is all about. By analyzing relative volume, we are able to see a visual representation o
If there is only one MT5 indicator you ever buy for trading forex – this has to be it. Your success as a forex trader depends on being able to identify when a currency or currency pair is oversold or overbought. If it is strong or weak. It is this concept which lies at the heart of forex trading. Without the Quantum Currency Strength indicator, it is almost impossible. There are simply too many currencies and too many pairs to do this quickly and easily yourself. You need help! The Quantum Cur
Have you ever wondered why so many Forex traders get trapped in weak positions on the wrong side of the market? One of the easiest ways the market makers do this, is by using volatility. A currency pair moves suddenly, often on a news release or economic data. Traders jump in, expecting some quick and easy profits, but the move suddenly moves in the opposite direction. This happens in all timeframes, and in all currency pairs. The candle or bar closes, with a wide spread, but then reverses sharp
If you've been trading for any time, you will almost certainly have come across the concept of support and resistance. This powerful and simple concept lies at the heart of technical analysis. It forms the cornerstone of price action trading. Strange to consider therefore, that such a key component of the traders chart has largely been ignored. Most Forex traders still draw their lines manually, leading to a crude interpretation of these key levels. Even those companies who have developed a trad
One of the oldest maxims in trading is ‘let the trend be your friend’. You must have come across it! This is easier said than done! First, you have to identify one, then you have to stay in – not easy. Staying in a trend to maximise your profits is extremely difficult. In addition, how do you know when a trend has started? It’s very easy to look back and identify the trend. Not so easy at the live edge of the market. The Quantum Trends indicator is the ‘sister’ indicator to the Quantum Trend Mon
Of all the four principle capital markets, the world of foreign exchange trading is the most complex and most difficult to master, unless of course you have the right tools! The reason for this complexity is not hard to understand. First currencies are traded in pairs. Each position is a judgment of the forces driving two independent markets. If the GBP/USD for example is bullish, is this being driven by strength in the pound, or weakness in the US dollar. Imagine if we had to do the same thing
We don’t want to become boring, but the US dollar is the most important currency for all traders, and not just in Forex. Trading without a clear view of the US dollar is like driving in fog. Sooner or later you are going to crash – it’s just a question of when. That’s why at Quantum we have developed two US dollar indices. The first is the Quantum DXY, and the second is the Quantum USDX. So what’s the difference? Well, the reason we created the Quantum USDX is that many Forex traders believe tha
For aspiring price action traders, reading a candle chart at speed can be learnt, but is a skill which takes years to perfect. For lesser mortals, help is required, and this is where the Quantum Dynamic Price Pivots indicator steps in to help. As a leading indicator based purely on price action, the indicator delivers simple clear signals in abundance, highlighting potential reversals with clinical efficiency. Just like volume and price, pivots are another ‘predictive’ indicator, and a leading i
Quantum Tick Volumes Indicator for MT5
QUANTUM TRADING SOFTWARE LIMITED
5 (1)
Many Forex traders assume there is no volume in the foreign exchange market. And they would be correct. There is no central exchange, not yet anyway. And even if there were, what would it report? What there is however is activity, and this is captured as tick volume. After all, volume is simply displaying activity, the buyers and sellers in the market. So for volume read activity, and for activity read volume – simple. The MT5 platform delivers tick data which the Quantum Tick Volumes indicator
Currency pairs never go up or down in a straight line. They rise and fall constantly, creating pullbacks and reversals. And with each rise and fall, so your emotions rise and fall. Hope, then fear, then hope. This is when the market will try to frighten you out of a strong position. It is when you are most vulnerable. But not if you have the Quantum Trend Monitor. And here, you even get two indicators for the price of one! The Quantum Trend Monitor has been designed to absorb these temporary pau
The Quantum VPOC indicator has been developed to expand the two dimensional study of volume and price, to a three dimensional one which embraces time. The volume/price/time relationship then provides real insight to the inner workings of the market and the heartbeat of sentiment and risk which drives the price action accordingly. The Quantum VPOC indicator displays several key pieces of information on the chart as follows: Volume Profile - this appears as a histogram of volume on the vertical pr
This indicator has been developed to identify and display these trends quickly and easily, allowing you to see instantly, those currency pairs which are trending, and those which are not – and in all timeframes, with just one click. The 28 currency pairs are displayed as a fan as they sweep from strong to weak and back again, and this is why we call it the ‘currency array’. All 28 pairs are arrayed before you, giving an instant visual description of those pairs that are trending strongly, those
Trading the currency markets is a complex business, not least since we are dealing with pairs of currencies, and by inference, pairs of economies. All economies around the world are interlinked, and reflected in the constant ebb and flow of currency strength and weakness. The problem for us as traders is monitoring so many pairs simultaneously, since every pair does not move independently, but reflects the interrelated nature of this market. The Quantum Currency Heatmap delivers the information
The words powerful, unique and game changing are ones that are often over used when applied to trading indicators, but for the MT5 Quantum Camarilla levels indicator, they truly describe this new and exciting indicator completely. Why? Because the indicator has something to offer every trader, from the systematic to the discretionary and from swing trading to breakout trading. And it’s not an indicator which is simply used for entries. The Camarilla indicator delivers in all areas, from getting
The Market Strength Indicator (MSI) is yet another in our stable of volume-based indicators, and as such, is a must-have tool for trading virtually any type of market and across a myriad of applications from trend trading to swing trading, scalping, and much more. While its sister indicator, the Currency Strength Indicator (CSI), helps you analyze which currencies are oversold, overbought, correlating, and trending, the MSI or Market Strength Indicator does this also, but in this case, for all m
Фильтр:
Нет отзывов
Ответ на отзыв