SMC Insight Pro

SMC Insight Pro

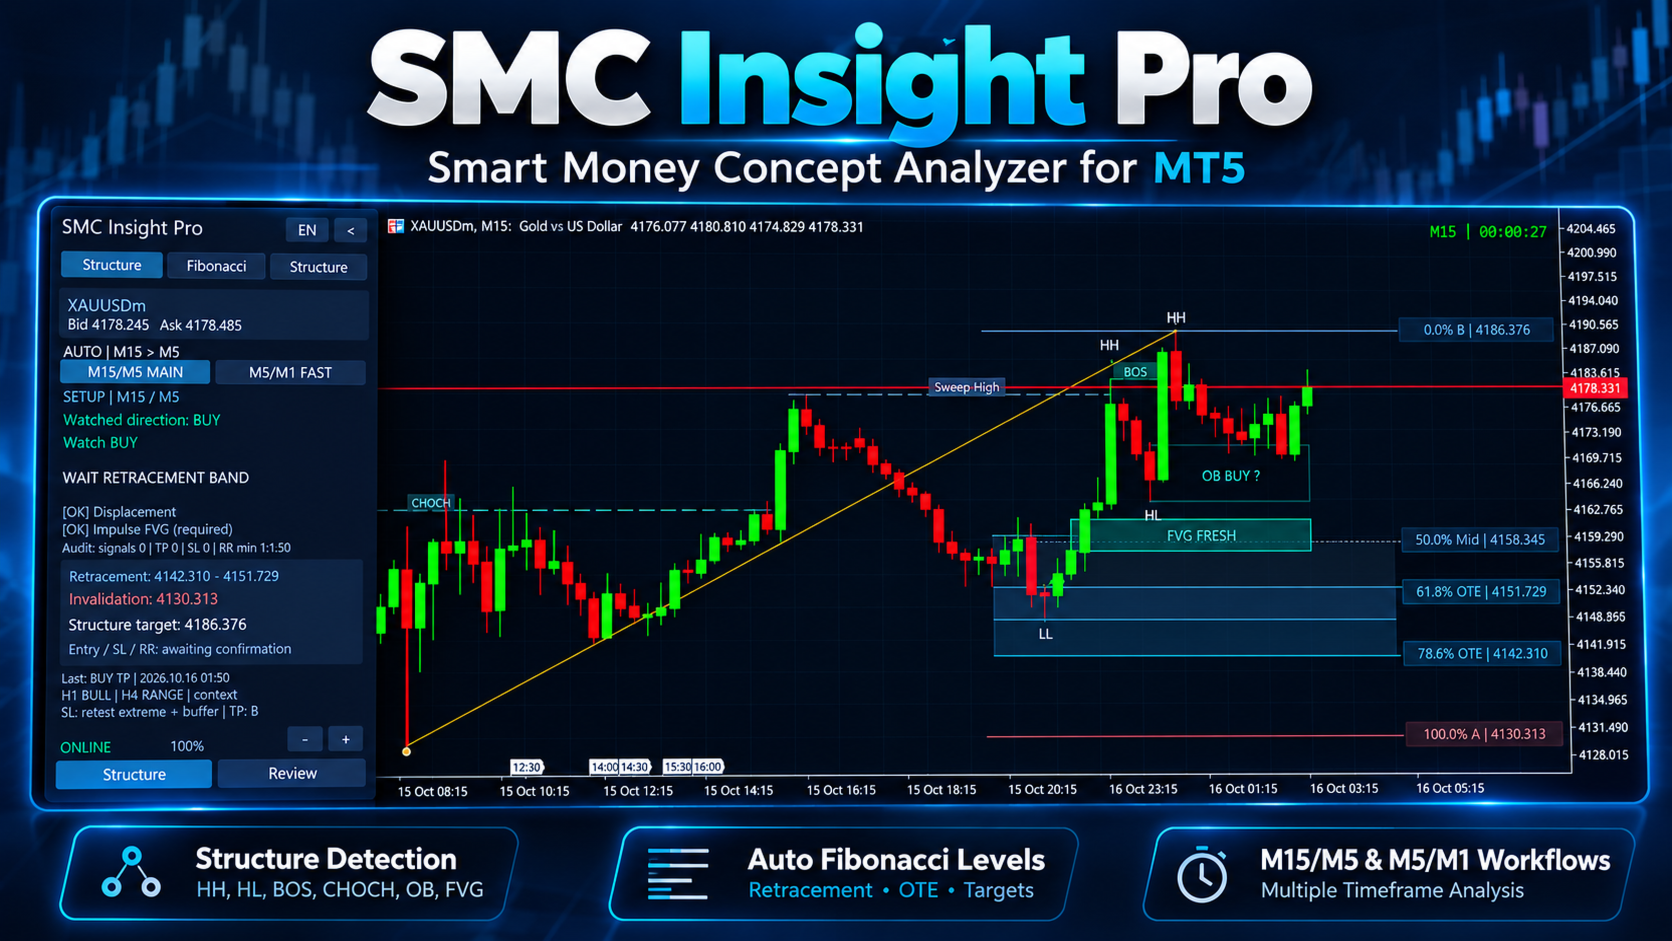
SMC Insight Pro is a visual analysis indicator for MetaTrader 5, developed by Eddy Gunawan. It combines market structure, automatic Fibonacci retracements, Fair Value Gap zones, and an interactive setup dashboard.

The indicator helps traders follow a structured analysis process: identify a qualifying impulse, monitor a retracement, wait for confirmation, and review analytical price references.

SMC Insight Pro does not open, modify, or close trades. All trading decisions and order execution remain under the user’s control.

Main Features

·        Market structure visualization, including swing highs and lows, Break of Structure (BOS), and Change of Character (CHoCH).

·        Fair Value Gap (FVG) zones and order block candidates for additional chart context.

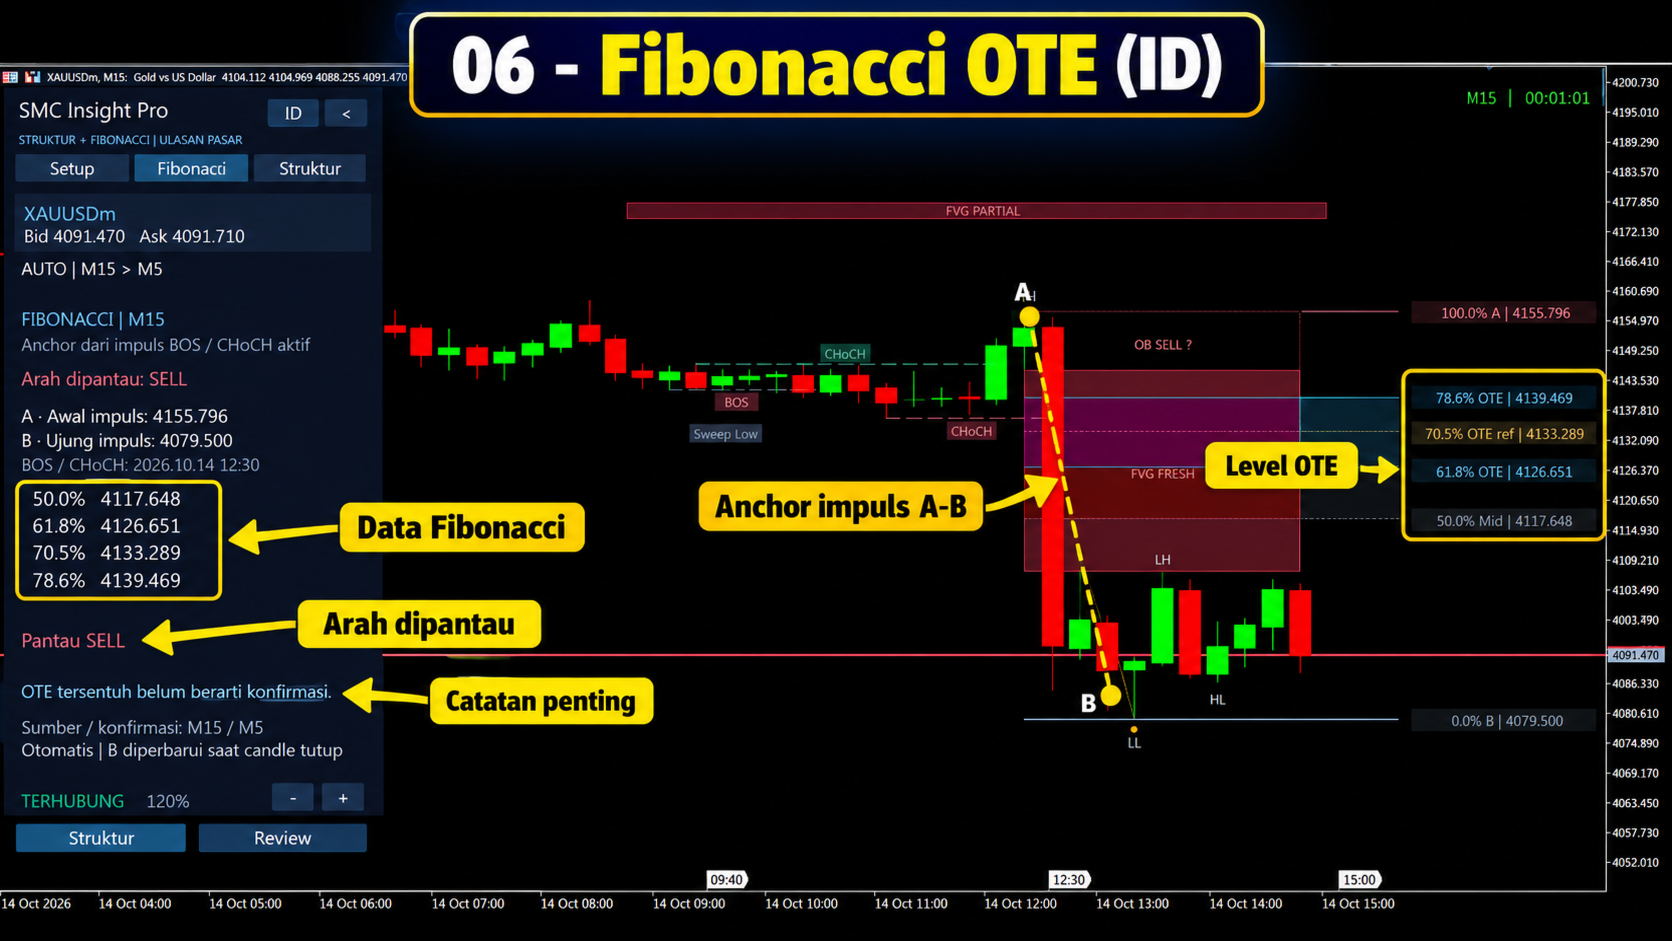
·        Automatic Fibonacci retracements linked to qualifying structure-based impulses.

·        A highlighted Optimal Trade Entry (OTE) retracement zone.

·        A setup dashboard showing the monitored direction, current conditions, and confirmation status.

·        Reference entry, stop-loss, take-profit, and reward-to-risk information when a setup is confirmed.

·        Higher-timeframe structure context from H1 and H4.

·        English and Indonesian interface options, adjustable panel zoom, and chart display controls.

·        Optional popup and sound notifications when qualifying Fibonacci anchors become available.

·        Optional CSV audit exports for reviewing setup events and reference outcomes.

Timeframes and Setup Selection

The default setup uses M15 market structure with confirmation from closed M5 candles.

Start with an M15 chart to review the main structural setup. You can also view the same main setup on an M5 chart to inspect its confirmation timeframe.

An optional faster setup uses M5 market structure with M1 confirmation. This setup must be enabled separately in the inputs.

The run-mode input uses these identifiers:

·        RUN_SCALPING_ONLY: the default main M15/M5 setup.

·        RUN_INTRADAY_ONLY: the optional fast M5/M1 setup.

·        RUN_BOTH: enables both setups.

These input identifiers are retained from development. Follow the M15/M5 or M5/M1 labels on the dashboard when identifying the active setup.

When both setups are enabled, use the MAIN and FAST buttons to choose which setup to review. Each setup maintains its own analysis.

Changing the chart timeframe does not change the underlying analysis timeframes. For example, switching the default setup from an M15 chart to M5 does not convert it into the fast M5/M1 setup.

Fibonacci drawings are displayed on the selected setup’s associated chart timeframes:

·        Main setup: M15 and M5.

·        Fast setup: M5 and M1.

A qualifying active setup must exist before Fibonacci appears. M30 and H1 are not Fibonacci display timeframes for these fixed setups.

Getting Started

1.     Install SMC Insight Pro in your desktop MetaTrader 5 terminal.

2.     Open the symbol you want to analyse and select the M15 chart timeframe.

3.     Attach the indicator and begin with the default inputs.

4.     Keep the terminal connected and allow the required historical price data to load.

5.     Open the Setup page and check the displayed structure and confirmation timeframes.

6.     Monitor the setup status. Fibonacci appears automatically when the qualification rules are met.

7.     Review any confirmed entry, stop-loss, take-profit, and reward-to-risk references before making your own trading decision.

Manual Fibonacci drawing or anchor selection is not required. Opening the Fibonacci page does not create or confirm a setup.

The indicator analyses the chart symbol. It is not a multi-symbol scanner; use separate charts to review additional symbols.

Using the Dashboard

Setup

This page shows the monitored direction, setup status, relevant conditions, impulse checks, and available reference levels.

A watched BUY or SELL direction describes the setup being monitored. It does not, by itself, mean that an entry has been confirmed.

Fibonacci

This page provides information about the current Fibonacci anchors, retracement levels, and setup condition. Use it together with the chart to review the relationship between the impulse and its retracement.

Structure

This page provides a summary of the structure used by the selected setup, including its direction and relevant structural information.

Display Controls

Use the plus and minus buttons to adjust panel zoom. Use the language button to switch between English and Indonesian.

The lower Structure control displays the supporting market-structure drawings. Review hides those supporting drawings while retaining Fibonacci when it is valid and eligible for display.

The chart timeframe and the selected setup still determine which drawings can appear.

Understanding the Setup Process

Searching

The indicator is looking for a structure-based opportunity that meets its rules. No active entry reference is available.

Waiting for Impulse Qualification

A potential structure leg has been identified, but the required impulse conditions are not yet satisfied. A structure break alone does not guarantee that Fibonacci or a confirmed entry will appear.

Waiting for Retracement

A qualifying impulse is available. The indicator is waiting for price to return to the configured retracement area.

Waiting for Confirmation

Price has interacted with the relevant area, but the required closed-candle confirmation or other setup conditions are still pending.

Confirmed BUY or SELL

The configured confirmation and reference-level requirements have been met. The dashboard displays analytical entry, stop-loss, take-profit, and reward-to-risk information.

Invalidated or Expired

The setup has breached an applicable invalidation condition or exceeded its permitted lifetime. Wait for a new qualifying setup rather than continuing to treat the previous one as active.

Reference Outcome

The indicator may record that a take-profit or stop-loss reference was touched. These are observations of reference levels, not records of executed trades.

Automatic Fibonacci Behaviour

Fibonacci is linked to a qualifying structure leg. It is not drawn on every visible price swing.

While a setup remains unconfirmed, its impulse endpoint can update as new structure candles close. This can change the retracement levels and reset the waiting process.

Drawings can disappear when a setup is invalidated, expires, completes, or is replaced, or when the selected chart timeframe does not support the active setup’s Fibonacci display.

The presence of an OTE zone is not an entry confirmation. Wait for the status shown on the Setup page.

The indicator requires closed candles and confirmed pivots for relevant calculations. This introduces confirmation delay. It should not be described as identifying every swing or entry opportunity immediately.

Entry, Stop-Loss, Take-Profit and Reward-to-Risk

Entry ref is the analytical reference associated with a confirmed setup. It is not an instruction to enter at the current market price.

SL ref is calculated using the applicable stop model and buffer settings. TP ref is based on the applicable structural target rules.

The reward-to-risk figure compares the reference target and stop distances, including the indicator’s spread adjustment. It does not include every execution cost, such as commission or slippage.

If the required reference geometry or minimum reward-to-risk condition is not met, a confirmed entry reference may not be issued.

Once issued, the recorded entry, stop-loss, and take-profit references for that signal are retained for tracking. New setups can produce different references.

A displayed structure target or impulse invalidation level before confirmation should not be confused with a complete confirmed trade plan.

Higher-Timeframe Context

H1 and H4 readings provide additional market-structure context.

For the optional fast M5/M1 setup, enabled higher-timeframe filters can affect whether an entry reference is confirmed. These filters are configurable and do not guarantee a successful outcome.

If the required history is unavailable, the dashboard may show a waiting or unavailable-data condition. Allow the terminal to synchronise before interpreting the analysis.

Alerts

Optional popup and sound alerts notify you when qualifying Fibonacci anchors become available.

An anchor notification means that a Fibonacci setup is available for review. It is not an order execution message or a confirmed entry instruction.

Other setup developments should be monitored in the dashboard. This version does not provide a separate popup for every retracement, confirmation, invalidation, or reference outcome.

Historical loading does not replay old setup alerts. Keep MetaTrader 5 running and connected to receive eligible live notifications.

Audit Records

When enabled, CSV exports record setup events, closed-candle data, and session summaries.

Files are saved in the terminal’s shared Common\Files\SMC_AUDIT folder.

The dashboard’s audit counts describe recorded signal references and observed reference outcomes. They are not account trading statistics or verified profitability results.

Outcome tracking uses Bid candle data. If both the stop-loss and take-profit references are touched within the same observed candle, their sequence may be ambiguous. Actual execution can differ because of Ask prices, spreads, slippage, commissions, and broker conditions.

Frequently Asked Questions

Why is Fibonacci not visible?

Check that the selected setup is enabled, sufficient history has loaded, a qualifying setup exists, and you are viewing one of its associated chart timeframes. For the default main setup, use M15 or M5.

Why does the dashboard show BUY or SELL but no entry?

A monitored direction is different from a confirmed setup. Retracement, confirmation, risk geometry, or other requirements may still be pending.

Why are there no signals immediately after installation?

The indicator does not force signals. Available history and current market conditions must satisfy the configured rules.

Why does changing the chart timeframe not change the setup source?

The two setups use fixed analysis pairs: M15/M5 and M5/M1. The chart timeframe controls the view; it does not redefine those analysis pairs.

Does the indicator trade automatically?

No. It provides visual analysis and reference levels only.

Does the indicator detect actual institutional orders?

No. It applies rule-based interpretations of price structure, imbalances, and Fibonacci relationships. These interpretations do not establish the identity or intentions of market participants.

Usage Notes and Support

Begin with the default main M15/M5 setup and familiarise yourself with its status messages before enabling the optional fast setup or changing the qualification rules.

Broker price feeds, available history, spreads, and input settings can produce different observations. Evaluate the indicator on a demo account and on the symbol you intend to analyse.

SMC Insight Pro is an analytical tool. It does not guarantee profitable trades, a particular win rate, or future results.

For support, use the MQL5 product comments or private messaging. Include the product version, symbol, chart timeframe, selected setup, relevant inputs, and a screenshot. If an error occurs, include the corresponding Experts or Journal message.


Рекомендуем также
ВАЖНОЕ УВЕДОМЛЕНИЕ – ТРЕБУЕТСЯ ЛИЦЕНЗИЯ И АКТИВАЦИЯ ==================================================== Инструкция по активации: После завершения покупки немедленно свяжитесь с нами, чтобы получить лицензионный ключ, пароль или данные для активации. Без них программное обеспечение не будет работать. Мы здесь, чтобы обеспечить бесперебойный процесс активации и ответить на любые ваши вопросы. --- Volume Delta Profile V2 Enhanced ================================ Профессиональный инструме
Here   our more valuable tools SMC Trend Trading   ,  Easy SMC Trading  ,  Institutional SMC Architect Volume Analysis Tools  ,  Volume flow Profile  ,  Market volume profile  , FVG with Volume  , Liquidity Heatmap Profile  ,  Volume Spread Analysis The    Liquidity Heatmap   is a sophisticated institutional trading tool designed to reveal where over-leveraged traders are trapped. By calculating estimated liquidation levels based on volume spikes and leverage, this indicator draws a dynamic "h
Master Edition — это профессиональный аналитический инструмент, предназначенный для визуализации структуры рынка через призму объема и денежного потока. В отличие от стандартных индикаторов объема, этот инструмент отображает Daily Volume Profile (Дневной Профиль Объема) прямо на вашем графике, позволяя видеть, где именно происходило открытие цены и где позиционируются «умные деньги». Эта версия Master Edition разработана для ясности и скорости, оснащенная уникальной системой Auto-Theme Sync, кот
ВАЖНОЕ УВЕДОМЛЕНИЕ – ТРЕБУЕТСЯ ЛИЦЕНЗИЯ И АКТИВАЦИЯ Инструкции по активации: После завершения покупки, пожалуйста, немедленно свяжитесь с нами, чтобы получить ключ лицензии, пароль или данные для активации. Без них программное обеспечение не будет работать. Мы здесь, чтобы обеспечить бесперебойный процесс активации и помочь вам с любыми вопросами. Многоязычная настройка Чтобы улучшить ваш торговый опыт, мы предлагаем полную настройку программного обеспечения на нескольких языках. Наша
LuoMo Volume & Price Structure 8.98 A multi-function chart indicator for   MetaTrader 4 and MetaTrader 5 , designed to display key volume, volatility, sentiment, and price-structure information directly on the main chart. Main Features Volume and price-based Support & Resistance Volume spike and exhaustion signals ATR volatility expansion alerts Volume Profile with HVN and LVN Bullish and bearish sentiment distribution Developing or fixed POC VAH and VAL levels Supply and Demand zones Volume-wei
Техническое описание индикатора – Delta Profile для MetaTrader 5 Delta Profile – это индикатор, разработанный для MetaTrader 5, предназначенный для детального анализа потока объёмов в пределах заданного диапазона свечей. Он структурирует и отображает информацию о дисбалансе положительных объёмов (связанных с движением вверх) и отрицательных объёмов (связанных с движением вниз) на различных ценовых уровнях. В результате пользователь получает чёткое представление о тех участках графика, где сосред
Here   our more valuable tools SMC Trend Trading   ,  Easy SMC Trading  ,  Institutional SMC Architect Volume Analysis Tools  ,  Volume flow Profile  ,  Market volume profile  , FVG with Volume  , Liquidity Heatmap Profile  ,  Volume Spread Analysis Deriv boom and crash index spike killer system you can use it only on m5 timeframe  follow the structure and get signal with alert on phone open trade set sl tp and enjoy easy analysis and trading made simple 
Advanced Volume Profile Analysis Tool for MetaTrader 5 The Kecia Volume Profile Order Finder provides traders with volume profile analysis capabilities. This MT5 indicator combines volume profile visualization with statistical calculations to help identify potential trading opportunities and suggests entry, stop loss, and take profit levels based on market structure. Market Profile Visualization Transform your chart with customizable volume profile visualizations: Multiple visualization options
Индикатор находит уровни максимального и минимального ценового объема (профиль рынка) на рабочей гистограмме для указанного количества баров.  Композитный профиль. Высота гистограммы полностью автоматическая и адаптируется к любому инструменту и таймфрейму. Используется авторский алгоритм и не повторяет известные аналоги. Высота двух гистограмм примерно равна средней высоте свечи. Умное оповещение (smart alert) поможет вам сообщить о цене, касающейся уровня объема. Концепция Smart Money. Low Vo

Профиль Рынка (Market Profile) определяет ряд типов дней, которые помогают трейдеру распознать поведение рынка. Ключевая особенность - это область значений (Value Area), представляющая диапазон ценового действия, в котором произошло 70% торговли. Понимание области значений может помочь трейдерам вникнуть в направление рынка и установить торговлю с более высокими шансами на успех. Это отличное дополнение к любой системе, которую вы возможно используете. Blahtech Limited представляет сообществу Me
Symbol: EURUSD Timeframe: 30 minutes (M30) For other symbols or timeframes, adjust the settings to match the market. Volume Profile POC Breakout builds a volume profile from recent candles, finds the Point of Control (POC) and marks clean breakouts of that level. Each breakout is shown as a complete trade plan with entry, stop loss and three take profit levels, filtered by the higher timeframe trend and rated by a quality score. The indicator does not open trades. It is a visual and analysis to
Here   our more valuable tools SMC Trend Trading   ,  Easy SMC Trading  ,  Institutional SMC Architect Volume Analysis Tools  ,  Volume flow Profile  ,  Market volume profile  , FVG with Volume  , Liquidity Heatmap Profile  ,  Volume Spread Analysis Transform Your Trading with Intelligent Market Insights! The 2025 Spike Killer Dashboard is a powerful MQL5 indicator that combines cutting-edge signal generation with an intuitive crystal dashboard for real-time market analysis. Designed for tra
BoxChart MT5
Evgeny Shevtsov
5 (7)
Рынок несправедлив, хотя бы потому, что всего лишь 10% игроков управляют 90% капитала. У рядового трейдера мало шансов, чтобы противостоять этим «хищникам». Но выход есть, необходимо всего лишь перейти на другую сторону, необходимо находиться в числе этих 10% «акул», научиться распознавать их намерения и двигаться вместе с ними. Объем - это единственный опережающий фактор, который безупречно работает на любом периоде и любом торговом инструменте. Сначала зарождается и накапливается объем, и толь
Volume Pressure Pro See who really controls the market — before the move becomes obvious. Most indicators show you where price has been . Volume Pressure Pro shows you who is winning the battle right now — buyers or sellers. This is not another repainted RSI or MACD clone. It is a proprietary algorithm built from scratch, and its formula remains a trade secret — which is exactly why its signals look like nothing else on your chart. What you get Clear BUY/SELL signals — a green arrow to buy
Here   our more valuable tools SMC Trend Trading   ,  Easy SMC Trading  ,  Institutional SMC Architect Volume Analysis Tools  ,  Volume flow Profile  ,  Market volume profile  , FVG with Volume  , Liquidity Heatmap Profile  ,  Volume Spread Analysis The Fractals_Price indicator is a technical analysis tool that identifies fractal patterns on price charts. Fractals are recurring patterns that signal potential trend reversals or continuation points. This indicator marks both upward and downward
Вот версия на русском языке, готовая для публикации в MQL5 Market: Volume Profile Multiple — Множественные профили объёма с буферами для алгоритмической торговли Устали строить Volume Profile блок за блоком, перерисовывая и пересчитывая его при каждой смене таймфрейма? Volume Profile Multiple автоматически строит на графике несколько последовательных профилей объёма, показывая, где реально находился институциональный интерес в каждом отрезке рынка — а не только в последнем видимом диапазоне. Что
ONNYX INDICATOR — версия 1.14 Индикатор зон спроса и предложения для MetaTrader 5 без перерисовки подтвержденных сигналов. Он определяет подтвержденные ценовые экстремумы, строит зоны с шириной на основе ATR, оценивает качество зон в процентах и показывает стрелки BUY/SELL на закрытых свечах. ОСНОВНЫЕ ВОЗМОЖНОСТИ - Зоны спроса и предложения с процентной оценкой внутри зоны. - Увеличенные стрелки BUY/SELL после подтверждения закрытой свечи. - Фильтр тренда EMA и подтверждение отклонения цены. - П
VibeFox Volume Profile — Volume Profile для MetaTrader 5 VibeFox Volume Profile — это полный набор инструментов Volume Profile для MetaTrader 5. Он строит горизонтальное распределение торгуемого объёма по цене, поэтому вы сразу видите, где рынок проявил наибольшую активность, где торговал слабо и какие ценовые уровни, вероятно, будут действовать как магниты или барьеры. Каждый профиль рисуется прямо на графике и управляется из современной панели с управлением мышью — никаких меню, в которых нужн
VOLUME PROFILE SAF-XII Профессиональный анализ профиля рынка для MT5 (идеальный индикатор для сеточных трейдеров) ЧТО ТАКОЕ ПРОФИЛЬ ОБЪЕМА (VOLUME PROFILE)? Профиль объема — это профессиональный институциональный инструмент, который отображает торговую активность на определенных ценовых уровнях, в отличие от традиционных индикаторов объема, показывающих объем во времени. Он показывает, ГДЕ происходила торговля в выбранном вами окне, помогая определить: ЗОНЫ СПРАВЕДЛИВОЙ СТОИМОСТИ (VAH/VAL) — це
Here   our more valuable tools SMC Trend Trading   ,  Easy SMC Trading  ,  Institutional SMC Architect Volume Analysis Tools  ,  Volume flow Profile  ,  Market volume profile  , FVG with Volume  , Liquidity Heatmap Profile  ,  Volume Spread Analysis Overview (Short Description) A professional risk management indicator that helps traders calculate lot size, risk percentage, and reward ratio in real time. Perfect for Forex, Indices, Gold, and Synthetic Indices traders who want precise control ov
What if you could finally SEE where the market really wants to go? Most traders watch price. Pros watch VOLUME — where the money was actually traded. Volume Profile Fibo Confluence puts that reading right in front of you, in plain language, no jargon. WHAT YOU SEE ON YOUR CHART • The POC, the most-traded price: the market's natural magnet • The value area (VAH / VAL): the "house" where price spends its time • Automatic Fibonacci retracement + the golden pocket • Low-volume nodes
Индикатор строит текущие котировки, которые можно сравнить с историческими и на этом основании сделать прогноз ценового движения. Индикатор имеет текстовое поле для быстрой навигации к нужной дате. Параметры : Symbol - выбор символа, который будет отображать индикатор; SymbolPeriod - выбор периода, с которого индикатор будет брать данные; IndicatorColor - цвет индикатора; Inverse - true переворачивает котировки, false - исходный вид; Далее идут настройки текстового поля, в которое можно ввес
CVD SmoothFlow Pro
Thalles Nascimento De Carvalho
CVD SmoothFlow Pro - Неограниченный анализ объема для любых активов! CVD SmoothFlow Pro — это идеальное решение для трейдеров, ищущих точный и неограниченный анализ объема. Используя расчет Cumulative Volume Delta (CVD) с продвинутой фильтрацией шума, Pro-версия предоставляет гибкость и точность, необходимые для торговли любыми финансовыми активами. Что предлагает CVD SmoothFlow Pro? Четкий анализ : Фильтрует шум и выделяет значимые объемные движения по любым финансовым активам. ️ Точная
Volume Profile — один из самых мощных аналитических инструментов, используемых профессиональными и институциональными трейдерами. В отличие от традиционных индикаторов объема, которые только показывают, когда произошли сделки в нижней части вашего экрана, Volume Profile точно показывает, на каких ценовых уровнях произошли эти сделки. Это дает вам четкое, рентгеновское видение структуры рынка, позволяя вам точно видеть, где умные деньги (smart money) и институциональные участники накапливают или
Умный многослойный детектор пробоя и отката для MetaTrader 5 «Умно. Просто. Быстро!» Устали упускать точки входа с высокой вероятностью пробоя? Тратите часы на просмотр нескольких графиков, пытаясь совместить пробои с направлением тренда и динамикой валют — и всё равно упускаете движение? Break Pullback решает всё это с помощью одного индикатора. Что такое Break Pullback? Break Pullback — это профессиональный индикатор MetaTrader 5, созданный специально для трейдеров, торгующих по структуре ры
Here   our more valuable tools SMC Trend Trading   ,  Easy SMC Trading  ,  Institutional SMC Architect Volume Analysis Tools  ,  Volume flow Profile  ,  Market volume profile  , FVG with Volume  , Liquidity Heatmap Profile  ,  Volume Spread Analysis Professional trend-following indicator with comprehensive visualization and control panel Key Features: Advanced Trend Detection Reliable Half Trend algorithm for precise trend identification Color-coded trend lines (Blue for bullish, Orange for
Here   our more valuable tools SMC Trend Trading   ,  Easy SMC Trading  ,  Institutional SMC Architect Volume Analysis Tools  ,  Volume flow Profile  ,  Market volume profile  , FVG with Volume  , Liquidity Heatmap Profile  ,  Volume Spread Analysis Boom: Take SELL signals only (price spikes up then crashes) Crash: Take BUY signals only (price drops then spikes up) SL goes beyond the line as labeled Interactive Market Watch Panel : A left-side sidebar showing real-time strength indicators (po
An ICT fair value gap is a trading concept that identifies market imbalances based on a three-candle sequence. The middle candle has a large body while the adjacent candles have upper and lower wicks that do not overlap with the middle candle. This formation suggests that there is an imbalance where buying and selling powers are not equal. Settings Minimum size of FVG (pips) -> FVGs less than the indicated pips will be not be drawn Show touched FVGs Normal FVG color -> color of FVG that hasn't
FREE
Do you use volume in your reading of the market? Certainly many traders use it, and do not imagine operating without it. The Color Histogram Volume Set indicator allows the user to choose the value that he considers interesting to monitor. When you pass this you will have visual confirmation and if you want you will also have the audible alert that is given by the indicator. Of course, there are other ways to try to find a high volume, such as assessing whether the volume is above av
Volume Profile VPVR For MT5 Volume Profile VPVR is a powerful, high-performance MetaTrader 5 indicator designed to replicate the advanced  Volume Profile (Visible Range) directly on your chart. It provides deep insight into market structure by visualizing where trading activity is concentrated, helping traders identify key price levels with precision. This indicator dynamically analyzes volume distribution across price levels and renders a detailed histogram directly on the chart, allowing you
С этим продуктом покупают
Trend Sniper X
Sarvarbek Abduvoxobov
4.9 (41)
Trend Sniper X — это трендовый индикатор для MetaTrader 5, работающий на нескольких таймфреймах, который помогает трейдерам точно и ясно определять направление тренда и потенциальные точки разворота. для MT4: https://www.mql5.com/en/market/product/193245 Информация о цене: Текущая цена является промо-ценой и может измениться по мере выхода предстоящих обновлений и новых функций. Бонусное предложение: Чтобы получить БЕСПЛАТНЫЙ авто-трейд советник Assistant EA для этого индикатора, пожалуйста, на
Smart Trend Trading System — MetaTrader 5 После покупки напишите мне на MQL5, чтобы БЕСПЛАТНО получить Smart Universal Expert Advisor, а также доступ к онлайн-курсу, руководство в формате PDF и доступ к закрытой группе. STTS объединяет направление тренда, сигналы входа и выхода, зоны разворота и важные ценовые уровни прямо на графике. Торгуйте по системе вручную или подключите отдельный совместимый советник для автоматического исполнения с выбранными вами настройками. ОДНА СИСТЕМА. ЧЕТЫРЕ ТОРГОВ
SuperScalp Pro
Van Minh Nguyen
4.56 (36)
SuperScalp Pro - Professional Multi-Layer Confluence Scalping System SuperScalp Pro — это продвинутый индикатор для скальпинга, который улучшает классический Supertrend с помощью нескольких интеллектуальных фильтров подтверждения. Он помогает определять торговые возможности Buy/Sell с более высокой вероятностью, значительно сокращая количество ложных сигналов. Чёткие стрелки Buy и Sell отображаются непосредственно на графике, а уровни Stop Loss и Take Profit на основе ATR автоматически рассчитыв
Entry Points Pro — топ-1 индикатор по количеству отзывов (600 отзывов и 31 000 скачиваний обеих версий). Индикатор даёт самые перспективные точки входа в сделки без перерисовки на любых инструментах. Индикатор покажет заранее стрелкой точку входа в сделку, укажет цену входа и нарисует на графике уровень входа и стопа, а так же рассчитает рабочий лот под твой депозит и риск, а панель статистики поможет выбрать самый перспективный инструмент и таймфрейм .  Тебе остаётся поставить отложенный ордер
Neuro Poseidon - новый индикатор от Дарьи Резуевой. Он сочетает точные торговые сигналы с адаптивными уровнями TP/SL , в результате создавая максимально выгодные сделки! TO SWITCH TO   ENG   PLEASE CHOOSE IT IN THE UPPER-RIGHT CORNER OF THE WEBSITE Напишите мне и получите  Neuro Poseidon Assistant  в подарок для автоматизации вашей торговли! Что отличает его от других индикаторов? 1. Доказанная прибыльность на всех активах и таймфреймах 2. На графике присутствуют только подтвержденные сигналы н
Adaptive Price Action Engine Купи индикатор — получи советник (EA) к нему бесплатно Самооптимизирующийся мульти-таймфреймовый анализ тренда и свечных моделей Рынок постоянно меняется — и не каждая модель Price Action имеет одинаковую ценность в разных рыночных режимах. Adaptive Price Action Engine создан для адаптации к изменяющимся рыночным условиям, объединяя трендовую структуру, мульти-таймфреймовый анализ, свечные модели и статистическую оптимизацию в единой аналитической системе. Два адапти
Auto Optimized SpeedAngle — это система векторизации импульса институционального уровня, которая исключает подгонку под исторические данные (curve-fitting) за счет непрерывной форвард-оптимизации (Walk-Forward Optimization, WFO). Вместо того чтобы полагаться на статические входные параметры, которые теряют эффективность при смене рыночных режимов, индикатор динамически перекалибрует свои настройки, используя валидацию на вневыборочных данных (Out-of-Sample, OOS). Это гарантирует, что отображаемы
M1 SNIPER   — это простая в использовании торговая система. Это стрелочный индикатор, разработанный для тайм фрейма M1. Индикатор можно использовать как отдельную систему для скальпинга на тайм фрейме M1, а также как часть вашей существующей торговой системы. Хотя эта торговая система была разработана специально для торговли на M1, ее можно использовать и с другими тайм фреймами. Первоначально я разработал этот метод для торговли XAUUSD и BTCUSD. Но я считаю этот метод полезным и для торговли на
Gann Made Easy   - это профессиональная, но при этом очень простая в применении Форекс система, основанная на лучших принципах торговли по методам господина У.Д. Ганна. Индикатор дает точные BUY/SELL сигналы, включающие в себя уровни Stop Loss и Take Profit. ПОЖАЛУЙСТА, СВЯЖИТЕСЬ СО МНОЙ ПОСЛЕ ПОКУПКИ, ЧТОБЫ ПОЛУЧИТЬ ТОРГОВЫЕ ИНСТРУКЦИИ И ОТЛИЧНЫЕ ДОПОЛНИТЕЛЬНЫЕ ИНДИКАТОРЫ БЕСПЛАТНО! Вероятно вы уже не раз слышали о торговли по методам Ганна. Как правило теория Ганна отпугивает от себя не только
ARIPoint
Temirlan Kdyrkhan
1 (4)
ARIBot is a powerful trading companion designed to generate high-probability entry signals with dynamic TP/SL/DP levels based on volatility. Built-in performance tracking shows win/loss stats, PP1/PP2 hits, and success rates — all updated live. Key Features: Buy/Sell signals with adaptive volatility bands Real-time TP/SL/DP levels based on ATR Built-in MA Filter with optional ATR/StdDev volatility Performance stats panel (Success, Profit/Loss, PP1/PP2) Alerts via popup, sound, push, or email Cus
Scalper Vault   — это профессиональная торговая система, которая дает вам все необходимое для успешного скальпинга. Этот индикатор представляет собой полную торговую систему, которую могут использовать трейдеры форекс и бинарных опционов. Рекомендуемый тайм фрейм М5. Система дает точные стрелочные сигналы в направлении тренда. Она также предоставляет вам сигналы выхода и рассчитывает рыночные уровни Ганна. Индикатор дает все типы оповещений, включая PUSH-уведомления. Пожалуйста, напишите мне пос
Trend Catcher   анализирует движения рыночных цен, используя комбинацию собственных и индивидуально разработанных адаптивных индикаторов анализа тренда. Он определяет истинное направление рынка, отфильтровывая краткосрочные шумы и фокусируясь на силе импульса, расширении волатильности и поведении ценовой структуры. Он также использует комбинацию сглаживающих и фильтрующих тренд индикаторов, таких как скользящие средние, RSI и фильтры волатильности. Мониторинг реальных операций, а также другие
Entry In The Zone and SMC Multi Timeframe is a real-time market analysis tool based on Smart Money Concepts (SMC), designed to analyze market structure, price direction, and key trading zones. It supports both Single-Timeframe and Multi-Timeframe Analysis, providing a clearer view of overall market structure across multiple timeframes, with real-time BUY / SELL signals designed with a strict focus on No-Repaint principles. The signals are designed to help filter unclear setups and evaluate tradi
Привет, трейдер! Большинство розничных трейдеров полагаются на запаздывающие веб-скрипты. Для торговли с истинным преимуществом необходима институциональная архитектура. Индикатор Astro AI — это не стандартное наложение графика. Это скомпилированная нейронная сеть с двумя агентами, работающая непосредственно на вашем терминале. Вот точная технология, лежащая в основе системы: 1. Агент 1: Аналитик (Графовые нейронные сети — GNN) Рынки — это не просто изолированные ценовые бары; это взаимосвяз
Каждый покупатель этого индикатора получает дополнительно Бесплатно: Авторскую утилиту "Bomber Utility", которая автоматически сопровождает каждю торговую операцию, устанавливает уровни Стоп Лосс и Тейк профит и закрывает сделки согласно правилам этой стратегии, Сет-файлы для настройки этого индикатора на различных активах, Сет-файлы для настройки Bomber Utility в режимы: "Минимум Риска", "Взвешенный Риск" и "Стратегия Выжидания", Пошаговый видео-мануал, который поможет вам быстро установить, н
Unix Scalper — MetaTrader 5 После покупки напишите мне на MQL5, чтобы БЕСПЛАТНО получить Smart Universal Expert Advisor, а также доступ к онлайн-курсу, руководство в формате PDF и доступ к закрытой группе. Найдите торговую ситуацию. Оцените план. Выберите способ торговли. UNIX Scalper объединяет анализ рынка, решения BUY/SELL/WAIT и уровни Entry, Stop Loss, TP1 и TP2 в одной удобной панели. УВИДЬТЕ СИГНАЛ И ТОРГОВЫЙ ПЛАН • Понятные решения: BUY, SELL или WAIT. • Определённые уровни: Entry, Stop
Volatility Master for MetaTrader is a real-time dashboard tool that scans up to  50 symbols  to identify high-volatility , trending markets instantly. With bullish/bearish signals, customizable alerts, and a user-friendly interface, it helps you avoid range-bound conditions and focus on high-probability trades. Clarity leads to confidence. Trade confidently and protect your capital effectively with this powerful dashboard. We don't offer free or bonus indicators in exchange of reviews from you.
Quantum TrendPulse
Bogdan Ion Puscasu
5 (26)
Представляем   Quantum TrendPulse   , совершенный торговый инструмент, который объединяет мощь   SuperTrend   ,   RSI   и   Stochastic   в один комплексный индикатор, чтобы максимизировать ваш торговый потенциал. Разработанный для трейдеров, которые ищут точность и эффективность, этот индикатор помогает вам уверенно определять рыночные тренды, сдвиги импульса и оптимальные точки входа и выхода. Основные характеристики: Интеграция SuperTrend:   легко следуйте преобладающим рыночным тенденциям и п
Представляем       Quantum Breakout PRO   , новаторский индикатор MQL5, который меняет ваш способ торговли в зонах прорыва! Разработан командой опытных трейдеров со стажем торговли более 13 лет,       Квантовый прорыв PRO       разработан, чтобы поднять ваше торговое путешествие к новым высотам с его инновационной и динамичной стратегией зоны прорыва. Quantum Breakout Indicator покажет вам сигнальные стрелки на зонах прорыва с 5 целевыми зонами прибыли и предложением стоп-лосса на основе поля
Atomic Analyst — MetaTrader 5 После покупки напишите мне на MQL5, чтобы БЕСПЛАТНО получить Smart Universal Expert Advisor, а также доступ к онлайн-курсу, руководство в формате PDF и доступ к закрытой группе. Atomic Analyst объединяет анализ ценового движения, направление тренда, сигналы входа и выхода, уровни Stop Loss и несколько уровней Take Profit прямо на графике. УВИДЬТЕ СИГНАЛ. ОЦЕНИТЕ ТОРГОВУЮ СИТУАЦИЮ. Atomic Analyst представляет результаты анализа в понятном визуальном виде: • Стрелки п
PainX GainX Blue Spike Fusion AI Advanced Synthetic Index Spike Detection Indicator for MetaTrader 5 Discover potential spike setups with a clear, organized, and professional trading interface. PainX GainX Blue Spike Fusion AI is a specialized indicator designed for traders who monitor synthetic indices and want a structured way to observe potential price spike opportunities. The indicator combines signal monitoring, market-condition analysis, visual alerts, and event tracking in one convenient
Сложно найти и дефицит по частоте, дивергенции являются одним из самых надежных торговых сценариев. Этот индикатор автоматически находит и сканирует регулярные и скрытые расхождения, используя ваш любимый осциллятор. [ Руководство по установке | Руководство по обновлению | Устранение неполадок | FAQ | Все продукты ] Легко торговать Находит регулярные и скрытые расхождения Поддерживает много известных генераторов Реализует торговые сигналы на основе прорывов Отображает подходящие уровни стоп-
Хватит действовать наугад. Знайте, когда входить, где выходить и в какую сторону склоняется рынок, всё на одном графике. RelicusRoad Pro собирает почти двадцать инструментов в один индикатор, а вы включаете те, которые подходят вашему стилю торговли. Чёткие входы. Чёткие выходы. План на каждом графике. Знакомо? Вы покупаете, а через минуту цена разворачивается против вас. Вы закрываете сделку слишком рано, а потом смотрите, как движение продолжается без вас. Пять индикаторов на графике, пять раз
Quantum Direction — профессиональный индикатор следования за трендом, предназначенный для определения направления рынка, выявления ранних изменений тренда и предоставления отфильтрованных сигналов входа и выхода. Этот индикатор включает бесплатный Quantum Trade Assistant — профессиональный инструмент управления сделками, доступный в MQL5 Market. Он может напрямую подключаться к Quantum Direction и автоматически открывать сделки при появлении действительного сигнала или закрывать сделки при выпол
OrderFlux – Индикатор Order Flow и Footprint для MetaTrader 5 OrderFlux — это профессиональный индикатор потока ордеров (Order Flow) и футпринта для MetaTrader 5. Он открывает каждую свечу и показывает, что происходит внутри: проторгованный объем на каждом ценовом уровне, разделенный на агрессивных покупателей и продавцов. Из этих тиковых данных в реальном времени строится полноценный Footprint-график, включая Delta, Imbalance, Volume Profile и Market Profile . Обычный график показывает только O
Power Candles V3 — самооптимизирующийся индикатор силы Power Candles V3 преобразует силу валюты и инструмента в готовый к использованию торговый план на каждом графике, к которому он прикреплен. Вместо того, чтобы просто раскрашивать свечи, он выполняет автоматическую оптимизацию в режиме реального времени в фоновом режиме и предоставляет вам оптимальные значения Stop Loss, Take Profit и порог сигнала для выбранного вами символа. Один клик — и все готово для реальной торговли: на графике появляю
FX Trend NG: Следующее поколение интеллектуального анализа трендов на разных рынках Обзор FX Trend NG — это профессиональный инструмент анализа трендов и мониторинга рынка с поддержкой нескольких таймфреймов. Он позволяет за секунды получить полное структурное понимание текущего состояния рынка. Вместо переключения между десятками графиков вы мгновенно видите, какие инструменты находятся в тренде, где импульс ослабевает и где наблюдается сильная синхронизация между таймфреймами. Специальное пр
IX Power MT5
Daniel Stein
4.92 (13)
IX Power: Получите рыночные инсайты для индексов, сырьевых товаров, криптовалют и форекс Обзор IX Power — это универсальный инструмент для анализа силы индексов, сырьевых товаров, криптовалют и форекс. В то время как FX Power предлагает наивысшую точность для валютных пар, используя данные всех доступных пар, IX Power фокусируется исключительно на данных рынка базового символа. Это делает IX Power отличным выбором для некорреляционных рынков и надежным инструментом для форекса, если вам не нуж
M1 Quantum MT5
Hamed Dehgani
4.2 (10)
Торговые сигналы в реальном времени с использованием M1 Quantum: Сигнал  (Сделка выполнена автоматически с помощью Quantum Trade Assistant , бесплатно включённого в этот продукт.) Последние новости : Выпущена версия 1.64. Теперь для всех сделок Stop Loss размещается за соответствующими зонами поддержки/сопротивления. Функция Smart Close также была улучшена для повышения производительности EA в этой версии. С 9 августа live-сигнал работает на версии 1.64. План цен: Текущая цена: $169 (Предложени
CRT Pro is a complete Candle Range Theory toolkit for MetaTrader 5. It finds the CRT model on up to three timeframes and adds the tools needed to read it: higher-timeframe candles, structure shifts, fair value gaps, liquidity sweeps, a bias table and SSMT divergence. Every module can be switched on or off. 1. CRT Model A CRT model is built from two candles of the chosen CRT timeframe. C1 is the range candle. C2 is the sweep candle: it takes the high or the low of C1 and closes back inside the
Другие продукты этого автора
Eddy Candle Pulse — Smart Candle Countdown Timer for MT5 Eddy Candle Pulse is a lightweight and easy-to-use candle countdown indicator designed for MetaTrader 5. It displays the remaining time before the current candlestick closes, helping traders monitor candle timing directly on their trading charts. With a clean and minimalistic interface, Eddy Candle Pulse keeps the countdown visible near the current market price without interfering with candlestick analysis. Whether you trade Forex, Gold (X
FREE
Фильтр:
Нет отзывов
Ответ на отзыв