SMC Insight Pro

SMC Insight Pro

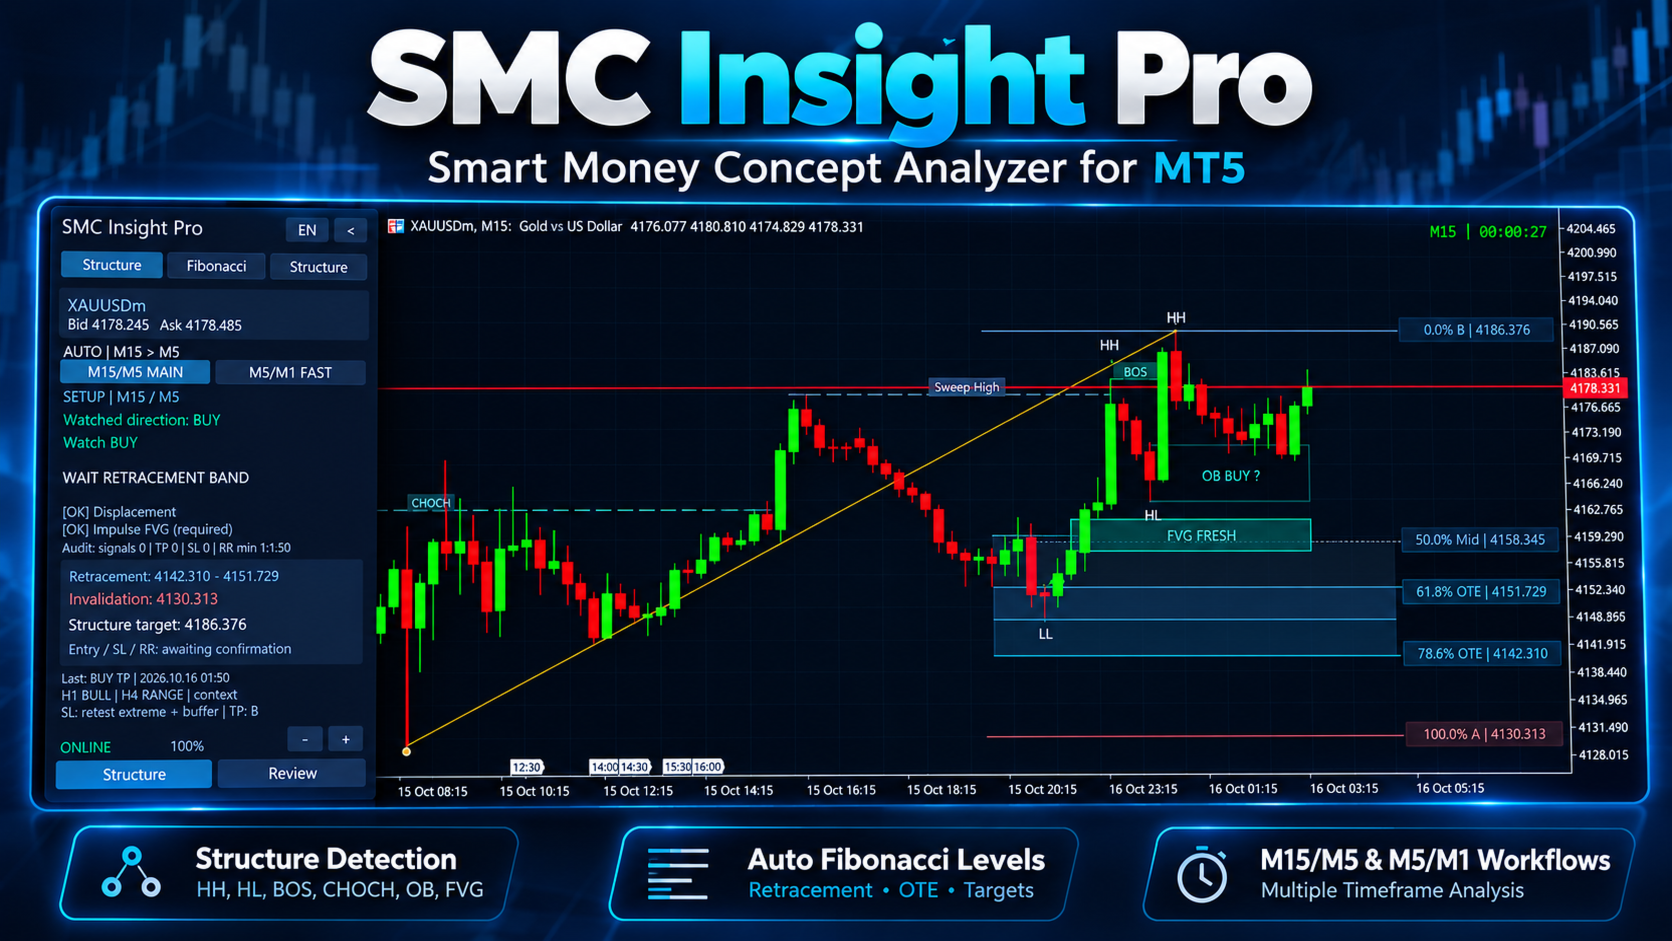
SMC Insight Pro is a visual analysis indicator for MetaTrader 5, developed by Eddy Gunawan. It combines market structure, automatic Fibonacci retracements, Fair Value Gap zones, and an interactive setup dashboard.

The indicator helps traders follow a structured analysis process: identify a qualifying impulse, monitor a retracement, wait for confirmation, and review analytical price references.

SMC Insight Pro does not open, modify, or close trades. All trading decisions and order execution remain under the user’s control.

Main Features

·        Market structure visualization, including swing highs and lows, Break of Structure (BOS), and Change of Character (CHoCH).

·        Fair Value Gap (FVG) zones and order block candidates for additional chart context.

·        Automatic Fibonacci retracements linked to qualifying structure-based impulses.

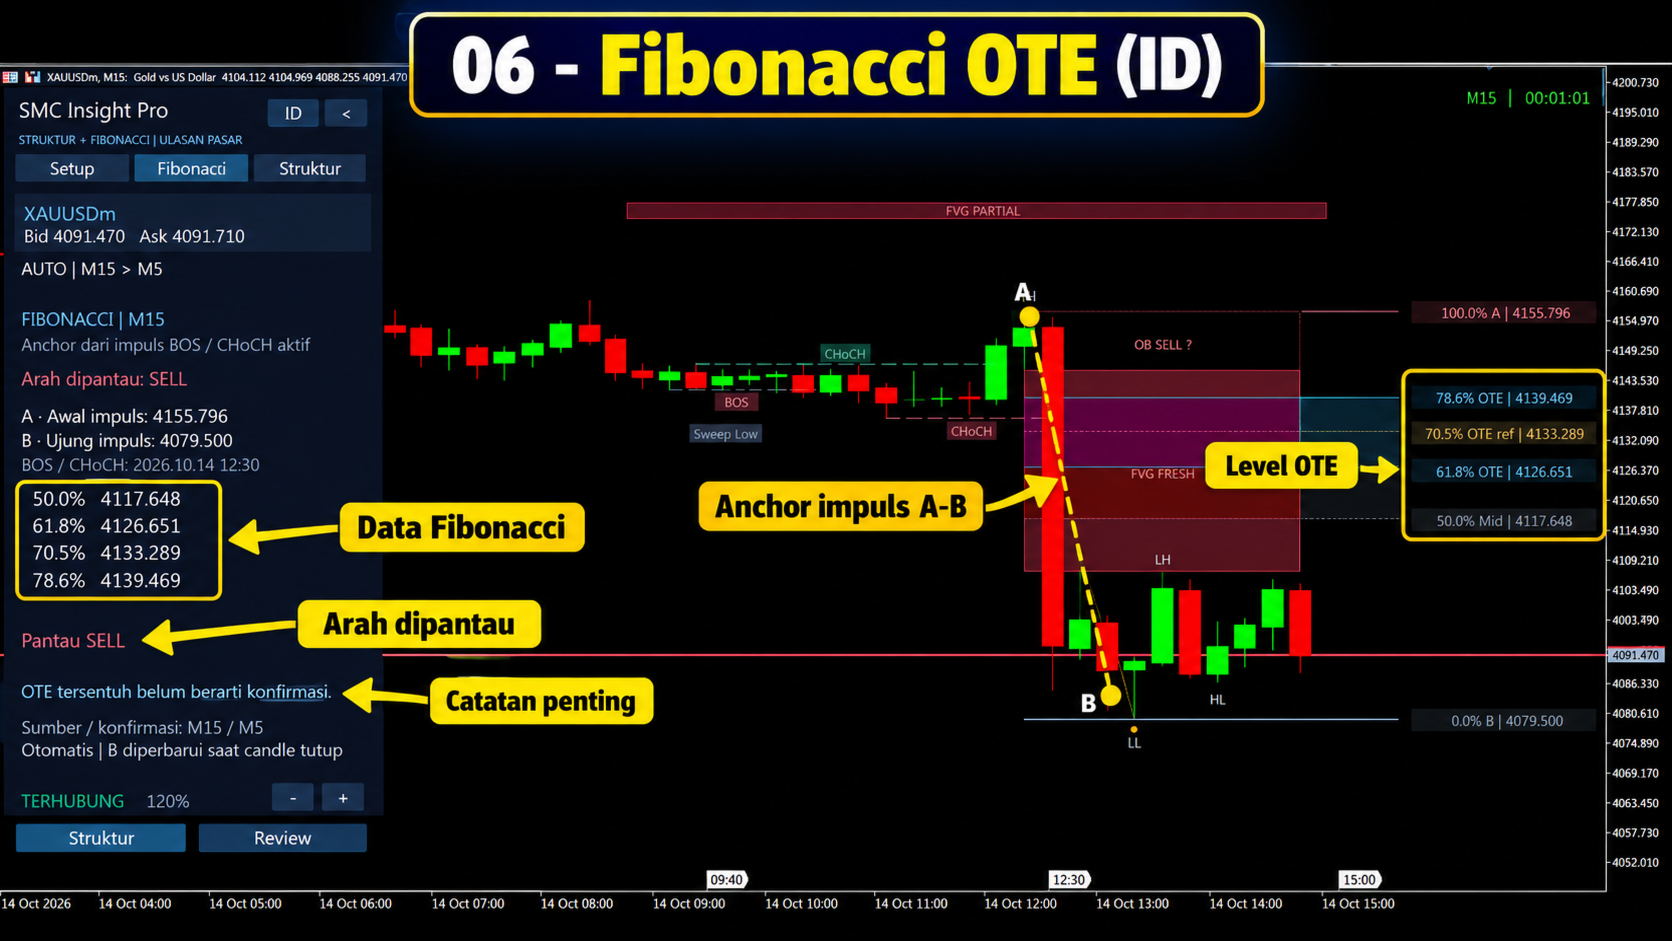
·        A highlighted Optimal Trade Entry (OTE) retracement zone.

·        A setup dashboard showing the monitored direction, current conditions, and confirmation status.

·        Reference entry, stop-loss, take-profit, and reward-to-risk information when a setup is confirmed.

·        Higher-timeframe structure context from H1 and H4.

·        English and Indonesian interface options, adjustable panel zoom, and chart display controls.

·        Optional popup and sound notifications when qualifying Fibonacci anchors become available.

·        Optional CSV audit exports for reviewing setup events and reference outcomes.

Timeframes and Setup Selection

The default setup uses M15 market structure with confirmation from closed M5 candles.

Start with an M15 chart to review the main structural setup. You can also view the same main setup on an M5 chart to inspect its confirmation timeframe.

An optional faster setup uses M5 market structure with M1 confirmation. This setup must be enabled separately in the inputs.

The run-mode input uses these identifiers:

·        RUN_SCALPING_ONLY: the default main M15/M5 setup.

·        RUN_INTRADAY_ONLY: the optional fast M5/M1 setup.

·        RUN_BOTH: enables both setups.

These input identifiers are retained from development. Follow the M15/M5 or M5/M1 labels on the dashboard when identifying the active setup.

When both setups are enabled, use the MAIN and FAST buttons to choose which setup to review. Each setup maintains its own analysis.

Changing the chart timeframe does not change the underlying analysis timeframes. For example, switching the default setup from an M15 chart to M5 does not convert it into the fast M5/M1 setup.

Fibonacci drawings are displayed on the selected setup’s associated chart timeframes:

·        Main setup: M15 and M5.

·        Fast setup: M5 and M1.

A qualifying active setup must exist before Fibonacci appears. M30 and H1 are not Fibonacci display timeframes for these fixed setups.

Getting Started

1.     Install SMC Insight Pro in your desktop MetaTrader 5 terminal.

2.     Open the symbol you want to analyse and select the M15 chart timeframe.

3.     Attach the indicator and begin with the default inputs.

4.     Keep the terminal connected and allow the required historical price data to load.

5.     Open the Setup page and check the displayed structure and confirmation timeframes.

6.     Monitor the setup status. Fibonacci appears automatically when the qualification rules are met.

7.     Review any confirmed entry, stop-loss, take-profit, and reward-to-risk references before making your own trading decision.

Manual Fibonacci drawing or anchor selection is not required. Opening the Fibonacci page does not create or confirm a setup.

The indicator analyses the chart symbol. It is not a multi-symbol scanner; use separate charts to review additional symbols.

Using the Dashboard

Setup

This page shows the monitored direction, setup status, relevant conditions, impulse checks, and available reference levels.

A watched BUY or SELL direction describes the setup being monitored. It does not, by itself, mean that an entry has been confirmed.

Fibonacci

This page provides information about the current Fibonacci anchors, retracement levels, and setup condition. Use it together with the chart to review the relationship between the impulse and its retracement.

Structure

This page provides a summary of the structure used by the selected setup, including its direction and relevant structural information.

Display Controls

Use the plus and minus buttons to adjust panel zoom. Use the language button to switch between English and Indonesian.

The lower Structure control displays the supporting market-structure drawings. Review hides those supporting drawings while retaining Fibonacci when it is valid and eligible for display.

The chart timeframe and the selected setup still determine which drawings can appear.

Understanding the Setup Process

Searching

The indicator is looking for a structure-based opportunity that meets its rules. No active entry reference is available.

Waiting for Impulse Qualification

A potential structure leg has been identified, but the required impulse conditions are not yet satisfied. A structure break alone does not guarantee that Fibonacci or a confirmed entry will appear.

Waiting for Retracement

A qualifying impulse is available. The indicator is waiting for price to return to the configured retracement area.

Waiting for Confirmation

Price has interacted with the relevant area, but the required closed-candle confirmation or other setup conditions are still pending.

Confirmed BUY or SELL

The configured confirmation and reference-level requirements have been met. The dashboard displays analytical entry, stop-loss, take-profit, and reward-to-risk information.

Invalidated or Expired

The setup has breached an applicable invalidation condition or exceeded its permitted lifetime. Wait for a new qualifying setup rather than continuing to treat the previous one as active.

Reference Outcome

The indicator may record that a take-profit or stop-loss reference was touched. These are observations of reference levels, not records of executed trades.

Automatic Fibonacci Behaviour

Fibonacci is linked to a qualifying structure leg. It is not drawn on every visible price swing.

While a setup remains unconfirmed, its impulse endpoint can update as new structure candles close. This can change the retracement levels and reset the waiting process.

Drawings can disappear when a setup is invalidated, expires, completes, or is replaced, or when the selected chart timeframe does not support the active setup’s Fibonacci display.

The presence of an OTE zone is not an entry confirmation. Wait for the status shown on the Setup page.

The indicator requires closed candles and confirmed pivots for relevant calculations. This introduces confirmation delay. It should not be described as identifying every swing or entry opportunity immediately.

Entry, Stop-Loss, Take-Profit and Reward-to-Risk

Entry ref is the analytical reference associated with a confirmed setup. It is not an instruction to enter at the current market price.

SL ref is calculated using the applicable stop model and buffer settings. TP ref is based on the applicable structural target rules.

The reward-to-risk figure compares the reference target and stop distances, including the indicator’s spread adjustment. It does not include every execution cost, such as commission or slippage.

If the required reference geometry or minimum reward-to-risk condition is not met, a confirmed entry reference may not be issued.

Once issued, the recorded entry, stop-loss, and take-profit references for that signal are retained for tracking. New setups can produce different references.

A displayed structure target or impulse invalidation level before confirmation should not be confused with a complete confirmed trade plan.

Higher-Timeframe Context

H1 and H4 readings provide additional market-structure context.

For the optional fast M5/M1 setup, enabled higher-timeframe filters can affect whether an entry reference is confirmed. These filters are configurable and do not guarantee a successful outcome.

If the required history is unavailable, the dashboard may show a waiting or unavailable-data condition. Allow the terminal to synchronise before interpreting the analysis.

Alerts

Optional popup and sound alerts notify you when qualifying Fibonacci anchors become available.

An anchor notification means that a Fibonacci setup is available for review. It is not an order execution message or a confirmed entry instruction.

Other setup developments should be monitored in the dashboard. This version does not provide a separate popup for every retracement, confirmation, invalidation, or reference outcome.

Historical loading does not replay old setup alerts. Keep MetaTrader 5 running and connected to receive eligible live notifications.

Audit Records

When enabled, CSV exports record setup events, closed-candle data, and session summaries.

Files are saved in the terminal’s shared Common\Files\SMC_AUDIT folder.

The dashboard’s audit counts describe recorded signal references and observed reference outcomes. They are not account trading statistics or verified profitability results.

Outcome tracking uses Bid candle data. If both the stop-loss and take-profit references are touched within the same observed candle, their sequence may be ambiguous. Actual execution can differ because of Ask prices, spreads, slippage, commissions, and broker conditions.

Frequently Asked Questions

Why is Fibonacci not visible?

Check that the selected setup is enabled, sufficient history has loaded, a qualifying setup exists, and you are viewing one of its associated chart timeframes. For the default main setup, use M15 or M5.

Why does the dashboard show BUY or SELL but no entry?

A monitored direction is different from a confirmed setup. Retracement, confirmation, risk geometry, or other requirements may still be pending.

Why are there no signals immediately after installation?

The indicator does not force signals. Available history and current market conditions must satisfy the configured rules.

Why does changing the chart timeframe not change the setup source?

The two setups use fixed analysis pairs: M15/M5 and M5/M1. The chart timeframe controls the view; it does not redefine those analysis pairs.

Does the indicator trade automatically?

No. It provides visual analysis and reference levels only.

Does the indicator detect actual institutional orders?

No. It applies rule-based interpretations of price structure, imbalances, and Fibonacci relationships. These interpretations do not establish the identity or intentions of market participants.

Usage Notes and Support

Begin with the default main M15/M5 setup and familiarise yourself with its status messages before enabling the optional fast setup or changing the qualification rules.

Broker price feeds, available history, spreads, and input settings can produce different observations. Evaluate the indicator on a demo account and on the symbol you intend to analyse.

SMC Insight Pro is an analytical tool. It does not guarantee profitable trades, a particular win rate, or future results.

For support, use the MQL5 product comments or private messaging. Include the product version, symbol, chart timeframe, selected setup, relevant inputs, and a screenshot. If an error occurs, include the corresponding Experts or Journal message.


推荐产品
重要通知 – 需要许可证和激活 ============================ 激活说明: 完成购买后,请立即联系我们以获取您的许可证密钥、密码或激活信息。没有这些信息,软件将无法运行。我们将确保为您提供顺畅的激活过程,并解答您的任何问题。 --- Volume Delta Profile V2 Enhanced ================================ 专业成交量与Delta分析工具 ------------------------- 概述 ---- **Volume Delta Profile** 是一款专业级分析工具,结合了传统的成交量分布分析与先进的Delta和失衡检测功能。这款综合性指标为交易者提供了市场动态的精细视图,通过实时图形化展示拍卖数据,捕捉价格随时间波动的连续起伏。 --- 核心功能 -------- 5种显示模式 -------------- - **VOL** — 总成交量直方图:显示整体成交量分布 - **BS** — 买卖拆分:可视化每个价格水平的买卖压力 - **ΔH** — Delt
Here   our more valuable tools SMC Trend Trading   ,  Easy SMC Trading  ,  Institutional SMC Architect Volume Analysis Tools  ,  Volume flow Profile  ,  Market volume profile  , FVG with Volume  , Liquidity Heatmap Profile  ,  Volume Spread Analysis The    Liquidity Heatmap   is a sophisticated institutional trading tool designed to reveal where over-leveraged traders are trapped. By calculating estimated liquidation levels based on volume spikes and leverage, this indicator draws a dynamic "h
Volume flow Profile
Israr Hussain Shah
大师版是一款专业级的分析工具,旨在通过成交量和资金流向的视角来可视化市场结构。与标准的成交量指标不同,该工具直接在图表上显示每日成交量分布,让您准确看到价格发现发生的位置以及“聪明钱”的定位。 此大师版专为清晰度和速度而设计,具有独特的自动主题同步系统,加载后即刻美化您的图表布局。 主要特点: 真实资金流向计算: 超越标准的跳动量。启用“Use Money Flow”时,成交量按价格加权,揭示了特定价格水平的实际资金投入。 价值区域 (VA) 可视化: 自动计算价值区域(默认为成交量的70%)。 VA填充: 为价值区域背景着色,以便即时识别控制区域。 关键水平: 清晰标记控制点 (POC)、价值区域高点 (VAH) 和价值区域低点 (VAL)。 专业标记系统: 扫描概况结构以识别关键交易区域: HVN (高成交量节点): 接受和盘整区域(支撑/阻力)。 LVN (低成交量节点): 拒绝区域或“快速通过”区域。 所有标记均向右绘制延长线,便于监控。 Delta 背离(左侧直方图): 左侧直方图可视化每个级别的买卖压力对比。这有助于识别隐藏的背离——即价格可能上涨,但卖家在这些水平上激进打
Volume Profile DD 1B
OBARE PAUL OTIENO
重要通知 – 需要许可证和激活 激活说明: 完成购买后,请立即联系我们以获取您的许可证密钥、密码或激活详情。没有这些,软件将无法运行。我们将确保激活过程顺利进行,并随时为您解答任何疑问。 多语言定制 为了提升您的交易体验,我们提供软件的多语言完整定制服务。我们的团队可以提供以下语言的翻译: 中文 | 法语 | 葡萄牙语 | 西班牙语 | 俄语 日语 | 德语 | 韩语 | 意大利语 | 土耳其语 只需告诉我们您偏好的语言,我们将定制指标,确保为您提供用户友好的体验。 成交量分布 – 高级市场分析工具 成交量分布是一个复杂的分析工具,旨在为交易者提供对市场动态的深入洞察。它捕捉价格随时间的变化,提供实时图形化的拍卖数据表示,揭示影响价格变动的集体行为模式。 其核心是 价值区域 (Value Area) ,代表包含当天68%交易活动的价格范围。这一区域与标准差对齐,突出显示大多数交易发生的区域。 主要功能: 成交量控制点 (VPOC): 识别在指定时间内交易量最高的价格水平,作为公平价格。 价值
TradeAQ
Guo Sheng Zhao
这个量价结构指标是一款适用于   MetaTrader 4 和 MetaTrader 5   的图表分析指标,集量价结构、成交量分布、市场情绪、波动提示和关键价格区域展示于一体。指标直接运行在主图窗口,可帮助交易者快速观察市场的重要价格位置与活跃程度。 主要功能 1. 量价结构支撑与阻力 自动标记连续量价结构形成的潜在支撑位和阻力位,辅助识别价格可能出现停顿、反应或突破的位置。 支持两种分析模式: 成交量结构 价格结构 线条颜色、宽度和样式均可自定义。 2. 成交量尖峰提示 当市场成交量显著放大时,在图表中显示醒目标记,帮助发现异常活跃、加速、衰竭或可能发生方向变化的行情。 可选功能包括: 尖峰图标提示 尖峰价格水平线 高点、低点、收盘价或组合价位显示 自定义成交量阈值 3. 高波动行情提示 自动标记波动明显扩张的 K 线,方便交易者及时发现突破、加速和快速行情。 支持: 高波动图标 关键价格水平线 自定义检测周期与敏感度 自定义线条颜色、宽度和样式 4. 成交量分布 在图表右侧显示指定范围内的成交量分布,直观呈现不同价格区域的交易活跃程度。 主要显示内容包括: 高成交量节点 低成交量
Delta Profile Volume
Teresinha Moraes Correia
指标技术说明 – Delta Profile for MetaTrader 5 Delta Profile 是为 MetaTrader 5 开发的一款指标,用于在指定的 K 线区间内对成交量流进行详细分析。它能够在不同的价格水平上对正向成交量(与上涨相关)和负向成交量(与下跌相关)的不平衡进行结构化和可视化展示。最终,用户可以清晰地识别图表中成交最为集中的区域,以及真实的市场不平衡形成的位置。 以下是该指标的主要技术特征与参数说明。 核心概念 指标会识别 价格水平 ,并将其分类为正向成交量、负向成交量,以及净 Delta(正负成交量的差值)。 每个价格水平会在图表中以 水平条形 显示,帮助用户直观观察市场活跃区和不平衡区域。 用户可自由控制 分析的 K 线数量 、 价格精度(小数位数) 、 显示的最大水平数量 以及 可视化样式 。 主要功能 价格水平映射 :根据设定的精度对价格进行四舍五入,并累计对应 K 线的成交量。 净 Delta 计算 :显示正负成交量的差值,提供每个价格区间的客观数值。 最强 Delta 水平突出显示 :自动识别 Delta 绝对值最大的价格水平,并用特殊颜色标
Boom Crash SMC
Israr Hussain Shah
Here   our more valuable tools SMC Trend Trading   ,  Easy SMC Trading  ,  Institutional SMC Architect Volume Analysis Tools  ,  Volume flow Profile  ,  Market volume profile  , FVG with Volume  , Liquidity Heatmap Profile  ,  Volume Spread Analysis Deriv boom and crash index spike killer system you can use it only on m5 timeframe  follow the structure and get signal with alert on phone open trade set sl tp and enjoy easy analysis and trading made simple 
Advanced Volume Profile Analysis Tool for MetaTrader 5 The Kecia Volume Profile Order Finder provides traders with volume profile analysis capabilities. This MT5 indicator combines volume profile visualization with statistical calculations to help identify potential trading opportunities and suggests entry, stop loss, and take profit levels based on market structure. Market Profile Visualization Transform your chart with customizable volume profile visualizations: Multiple visualization options
UPD1 Profile Levels MT5
Vitaliy Kuznetsov
5 (4)
该指标在指定柱数的工作直方图上找到最大和最低价格量(市场概况)的水平。   复合型材 。 柱状图的高度是全自动的,并适应任何仪器和时间框架。 作者的算法被使用,并且不重复众所周知的类似物。 两个直方图的高度近似等于蜡烛的平均高度。 智能警报将帮助您了解有关交易量水平的价格。 概念Smart Money 。 Low Volume - Imbalance. 用于寻找良好的市场环境,确定市场结构并作为二元期权的过滤器。 它是价格的磁铁。 High Volume - Liquidity. 用于退出累积时的测试。 输入参数 。 基本 。 Bars Count - 要计数和显示的条数 。 Signal Fractal = 5 (对于颜色信号电平)。 水平将在以下条件下成为信号:顶部和底部有五个直方图不超过它 。 Min Candles For High Volume Level - 在水平蜡烛的最小数量,以便它可以成为一个信号 。 按钮设置 。 Visual Button - 按钮显示(启用/禁用) 。 Corner - 按钮的卡角 。 X indent - 以像素为单位的水平偏移量 。

Blahtech Market Profile MT5
Blahtech Limited
5 (10)
Was: $249  Now: $99   Market Profile defines a number of day types that can help the trader to determine market behaviour. A key feature is the Value Area, representing the range of price action where 70% of trading took place. Understanding the Value Area can give traders valuable insight into market direction and establish the higher odds trade. It is an excellent addition to any system you may be using. Inspired by Jim Dalton’s book “Mind Over Markets”, this indicator is designed to suit the
Symbol: EURUSD Timeframe: 30 minutes (M30) For other symbols or timeframes, adjust the settings to match the market. Volume Profile POC Breakout builds a volume profile from recent candles, finds the Point of Control (POC) and marks clean breakouts of that level. Each breakout is shown as a complete trade plan with entry, stop loss and three take profit levels, filtered by the higher timeframe trend and rated by a quality score. The indicator does not open trades. It is a visual and analysis to
Here   our more valuable tools SMC Trend Trading   ,  Easy SMC Trading  ,  Institutional SMC Architect Volume Analysis Tools  ,  Volume flow Profile  ,  Market volume profile  , FVG with Volume  , Liquidity Heatmap Profile  ,  Volume Spread Analysis Transform Your Trading with Intelligent Market Insights! The 2025 Spike Killer Dashboard is a powerful MQL5 indicator that combines cutting-edge signal generation with an intuitive crystal dashboard for real-time market analysis. Designed for tra
BoxChart MT5
Evgeny Shevtsov
5 (7)
The market is unfair if only because 10% of participants manage 90% of funds. An ordinary trader has slim changes to stand against these "vultures". This problem can be solved. You just need to be among these 10%, learn to predict their intentions and move with them. Volume is the only preemptive factor that faultlessly works on any timeframe and symbol. First, the volume appears and is accumulated, and only then the price moves. The price moves from one volume to another. Areas of volume accumu
Volume Pressure Pro
Wojciech Jerzy Magda
Volume Pressure Pro See who really controls the market — before the move becomes obvious. Most indicators show you where price has been . Volume Pressure Pro shows you who is winning the battle right now — buyers or sellers. This is not another repainted RSI or MACD clone. It is a proprietary algorithm built from scratch, and its formula remains a trade secret — which is exactly why its signals look like nothing else on your chart. What you get Clear BUY/SELL signals — a green arrow to buy
Binary Rise Fall
Israr Hussain Shah
Here   our more valuable tools SMC Trend Trading   ,  Easy SMC Trading  ,  Institutional SMC Architect Volume Analysis Tools  ,  Volume flow Profile  ,  Market volume profile  , FVG with Volume  , Liquidity Heatmap Profile  ,  Volume Spread Analysis The Fractals_Price indicator is a technical analysis tool that identifies fractal patterns on price charts. Fractals are recurring patterns that signal potential trend reversals or continuation points. This indicator marks both upward and downward
Volume Profile Multiple — 多区块成交量分布指标,带缓冲区数据接口,支持算法交易 还在为每次切换周期都要重新绘制、重新计算成交量分布图而烦恼吗? Volume Profile Multiple 可在图表上自动绘制多个连续的成交量分布区块,揭示机构资金在市场各个阶段的真实活动区域——而不仅仅局限于最近可见的价格区间。 功能说明 该指标将历史价格按每 N 根K线划分为若干区块(区块数量和每区块的K线数量均可自定义),并为每个区块计算完整的成交量分布数据:控制点(POC)、价值区上下沿(VAH/VAL),以及高成交量节点和低成交量节点(HVN/LVN)。最终呈现的是一幅逐区块的市场结构可视化地图,便于识别基于真实成交量的筹码集中区、支撑阻力位,以及价格在不同价值区之间的轮动情况。 同样为算法交易而设计 与大多数成交量分布指标不同,本指标不仅提供可视化功能:它还输出 3个数据缓冲区 (最新区块的 POC、VAH、VAL),完全兼容 StrategyQuant X 以及任何 MQL5 智能交易系统(EA)。这意味着您可以直接基于这些关键价位构建交易策略,无需重新编写成交量
ONNYX INDICATOR 版本 1.14 这是一款用于 MetaTrader 5 的供需区域分析指标。已确认的历史信号采用收盘K线逻辑,避免确认后的箭头因盘中波动而消失。指标根据确认的摆动高低点建立区域,使用 ATR 调整区域宽度,并以百分比显示区域质量。 主要功能 - 供需区域及区域内百分比评分。 - 收盘K线确认后的放大 BUY/SELL 箭头。 - 可选 EMA 趋势过滤和K线拒绝确认。 - 趋势、价格水平和市场环境面板。 - 最多显示 5 条相关经济新闻;公布前显示 Forecast 和 Previous,公布后显示 Actual。 - 新闻每 60 秒刷新,并支持策略测试器中的日历缓存。 - 弹窗、推送和邮件提醒。 - iCustom 集成:缓冲区 0 为 BUY 价格,缓冲区 1 为 SELL 价格。 使用方法 将指标加载到图表,等待历史数据完成加载,查看趋势和有效区域,然后结合自己的交易计划使用收盘K线信号。XAUUSD H1 适合更清晰的结构,M15 可获得更频繁的机会。 重要提示 本产品是分析指标,不是自动交易 EA,不会自动开仓、修改或平仓,也不保证盈利。请先
VibeFox Volume Profile — 适用于 MetaTrader 5 的 Volume Profile VibeFox Volume Profile 是一套完整的 MetaTrader 5 Volume Profile 工具集。它构建成交量沿价格的水平分布,使您能够立即看到市场在何处投入了最多的活动、在何处交易稀薄,以及哪些价格水平可能充当磁石或屏障。每个剖面都直接绘制在图表上,并通过现代的、由鼠标驱动的面板进行控制——无需翻找菜单,无需附加脚本。 您无需仅凭蜡烛图猜测支撑与阻力,而是与成交量的真实足迹打交道:吸引价格的高成交量节点、价格往往会快速穿过的低成交量空隙,以及大部分交易完成的公允价值区域。 按您所需的方式呈现的 Volume Profile Volume Profile 并非单一的固定剖面。它一次性为您提供 多个相互独立的剖面引擎 ,每个都有自己的范围、放置位置和样式,因此您可以在同一图表上从多个角度研究市场。 From-To ——在两条可拖动的线 From 与 To 之间构建的精确剖面。将这两条线放在任意摆动、区间或新闻尖峰周围,便可读取恰好该区段的分布。R
VOLUME PROFILE SAF-XII 专业级 MT5 市场轮廓(成交量概况)分析仪 —— 网格交易者的梦幻指标 什么是成交量概况 (Volume Profile)? 成交量概况是一种专业的机构级工具。与传统的随时间显示成交量的指标不同,它显示的是 特定价格水平 上的交易活动。它揭示了交易发生在 哪里 ,帮助您识别: 价值区 (VAH/VAL) :大部分交易发生的价格区间。 控制点 (POC) :成交量最高的核心价格水平。 流动性失衡 :每个层级的多空主导力量对比。 支撑/阻力 :基于实际交易活动形成的天然价格位。 三种操作模式 —— 真正的“设置后即忘” VP_MANUAL(波段交易与关键位分析) 用户通过拖动垂直线自定义分析范围。 仅在移动线条时重新计算。 适用场景 :新闻前夕分析、财报发布、特定日期范围。 VP_AUTO(头寸与动量交易) 随新柱线自动向后滚动。 使用自定义回溯周期(默认 100 根柱线)。 适用场景 :动量策略、突破交易。 VP_SESSION(日内交易与机构流向) 锚定逻辑交易时段(伦敦、纽约、亚洲盘开盘)。 适用场景 :日内交易、基于时段的机构化策略
Risk Control Tool
Israr Hussain Shah
Here   our more valuable tools SMC Trend Trading   ,  Easy SMC Trading  ,  Institutional SMC Architect Volume Analysis Tools  ,  Volume flow Profile  ,  Market volume profile  , FVG with Volume  , Liquidity Heatmap Profile  ,  Volume Spread Analysis Overview (Short Description) A professional risk management indicator that helps traders calculate lot size, risk percentage, and reward ratio in real time. Perfect for Forex, Indices, Gold, and Synthetic Indices traders who want precise control ov
What if you could finally SEE where the market really wants to go? Most traders watch price. Pros watch VOLUME — where the money was actually traded. Volume Profile Fibo Confluence puts that reading right in front of you, in plain language, no jargon. WHAT YOU SEE ON YOUR CHART • The POC, the most-traded price: the market's natural magnet • The value area (VAH / VAL): the "house" where price spends its time • Automatic Fibonacci retracement + the golden pocket • Low-volume nodes
该指标建立当前报价,可以与历史报价进行比较,并在此基础上进行价格走势预测。指示器有一个文本字段,用于快速导航到所需日期。 选项: 符号 - 选择指标将显示的符号; SymbolPeriod - 选择指标从中获取数据的时段; IndicatorColor - 指示器颜色; HorisontalShift - 由指标绘制的报价移动指定的柱数; Inverse - true 反转引号,false - 原始视图; ChartVerticalShiftStep - 图表垂直移动(键盘上的向上/向下箭头); 接下来是文本字段的设置,您可以在其中输入日期,您可以通过按“回车”立即跳转到该日期。 接下来是文本字段的设置,您可以在其中输入日期,您可以通过按“回车”立即跳转到该日期。
CVD SmoothFlow Pro
Thalles Nascimento De Carvalho
CVD SmoothFlow Pro - 适用于任何资产的无限量分析! CVD SmoothFlow Pro 是寻求精确和无限量分析的交易者的终极解决方案。该专业版利用累计成交量 delta (CVD) 并结合高级噪声过滤,为交易任何金融资产提供所需的灵活性和精确度。 CVD SmoothFlow Pro 提供了什么? 清晰分析 :过滤市场噪声,突显任何金融资产中的重要成交量变动。 ️ 精确计算 :监测买卖差异,提供外汇、指数、加密货币等资产的成交量行为的详细视图。 直观界面 :提供易于理解和高效的分析,数据呈现清晰明了。 趋势识别 :更自信地识别市场趋势,帮助做出明智决策。 实际应用: 实时监测任何资产中买卖双方的平衡。 基于成交量识别趋势反转。 精确过滤,关注外汇、指数、加密货币等资产中的重要变动。 无限制的专业版! 专业版提供无限制的所有功能访问权限,让您能够对任何金融资产进行详细和无限量的分析。
TLID Volume Profile
Robby Suhendrawan
Volume Profile 是专业和机构交易者使用的最强大的分析工具之一。与仅在屏幕底部显示交易发生时间的传统成交量指标不同,Volume Profile 准确显示了这些交易发生的价格水平。这为您提供了市场结构的清晰 X 光透视图,让您能够准确看到聪明的资金 (smart money) 和机构在何处积累或派发其头寸。 Volume Profile 如何检测机构订单和 Support/Resistance(支撑/阻力) 通过根据价格比例水平绘制成交量,该指标根据实际的历史交易自然地揭示了真实的供需区域。根据标准的 Volume Profile 规则,您可以通过以下方式解读市场: Point of Control (POC): 这是在选定时间段内交易量最大的特定价格水平。POC 代表了买卖双方接受的最公平价格。机构围绕这一水平建立他们庞大的头寸。在交易中,POC 充当了一块巨大的磁铁和非常强大的 Support 或 Resistance 水平。如果价格远离 POC,它通常会自然地被吸引回 POC。 Value Area (VA): 这是大部分交易量发生的价格范围,通常设置为总交易量的 7
MetaTrader 5 智能多层突破与回调探测器 "智能 · 简单 · 快速!" 您是否厌倦了错过高概率的突破入场机会? 您是否花费数小时扫描多张图表,试图将突破与趋势方向和货币动能对齐——却仍然错过了行情? Break Pullback 用一个指标解决所有这些问题。 什么是 Break Pullback? Break Pullback 是一款专业级 MetaTrader 5 指标,专为交易市场结构、突破和趋势延续形态的交易者而设计。 它能实时自动检测多个货币对的突破与回调形态——并通过三层确认过滤每个信号: 结构突破检测——识别图表上的关键突破位 高时间框架日线偏向——将入场与主导日线趋势方向对齐 货币强弱指数——确认配对货币间的动能失衡 结果:更少的虚假信号,更强的信心,更快的执行——无需面对图表过载。 适合哪些交易者? Break Pullback 专为使用以下方法的交易者设计: 突破与回测策略 市场结构分析(BOS、 OB Order Block 、结构位) 聪明钱概念(SMC)或 ICT 风格入场 趋势跟踪与延续形态 跨外汇和黄金(XAUUSD)的多对扫描 日内和波段
Smart trend pro
Israr Hussain Shah
Here   our more valuable tools SMC Trend Trading   ,  Easy SMC Trading  ,  Institutional SMC Architect Volume Analysis Tools  ,  Volume flow Profile  ,  Market volume profile  , FVG with Volume  , Liquidity Heatmap Profile  ,  Volume Spread Analysis Professional trend-following indicator with comprehensive visualization and control panel Key Features: Advanced Trend Detection Reliable Half Trend algorithm for precise trend identification Color-coded trend lines (Blue for bullish, Orange for
Deriv Boom and crash
Israr Hussain Shah
Here   our more valuable tools SMC Trend Trading   ,  Easy SMC Trading  ,  Institutional SMC Architect Volume Analysis Tools  ,  Volume flow Profile  ,  Market volume profile  , FVG with Volume  , Liquidity Heatmap Profile  ,  Volume Spread Analysis Boom: Take SELL signals only (price spikes up then crashes) Crash: Take BUY signals only (price drops then spikes up) SL goes beyond the line as labeled Interactive Market Watch Panel : A left-side sidebar showing real-time strength indicators (po
ICT Fair Value Gap Indicator
David Muriithi
4.64 (11)
An ICT fair value gap is a trading concept that identifies market imbalances based on a three-candle sequence. The middle candle has a large body while the adjacent candles have upper and lower wicks that do not overlap with the middle candle. This formation suggests that there is an imbalance where buying and selling powers are not equal. Settings Minimum size of FVG (pips) -> FVGs less than the indicated pips will be not be drawn Show touched FVGs Normal FVG color -> color of FVG that hasn't
FREE
Color Histogram Volume Set
Ricardo Almeida Branco
Do you use volume in your reading of the market? Certainly many traders use it, and do not imagine operating without it. The Color Histogram Volume Set indicator allows the user to choose the value that he considers interesting to monitor. When you pass this you will have visual confirmation and if you want you will also have the audible alert that is given by the indicator. Of course, there are other ways to try to find a high volume, such as assessing whether the volume is above av
Volume Profile For MT5
Abdelkhabir Yassine Alaoui
Volume Profile VPVR For MT5 Volume Profile VPVR is a powerful, high-performance MetaTrader 5 indicator designed to replicate the advanced  Volume Profile (Visible Range) directly on your chart. It provides deep insight into market structure by visualizing where trading activity is concentrated, helping traders identify key price levels with precision. This indicator dynamically analyzes volume distribution across price levels and renders a detailed histogram directly on the chart, allowing you
该产品的买家也购买
Trend Sniper X
Sarvarbek Abduvoxobov
4.9 (41)
Trend Sniper X 是一款适用于 MetaTrader 5 的多周期趋势跟踪指标,可帮助交易者清晰精准地识别趋势方向和潜在的反转点。 适用于 MT4: https://www.mql5.com/en/market/product/193245 价格信息: 当前价格为促销价,随着后续更新和新功能的推出,价格可能会有所变动。 赠品优惠: 购买后联系作者,即可免费获取该指标的 Auto-Trade Assistant EA(自动交易助手 EA)。 Code2Profit 频道 通过多时间框架分析掌控市场! 如何使用 Trend Sniper X 最大化您的胜率:核心规则与交易时段技巧 技术规格 平台 MetaTrader 5 指标类型 多时间周期趋势指标 运行时间周期 任何图表时间周期,可独立选择更高的时间周期 (M1–MN1) 主要交易品种 外汇、黄金 (XAUUSD) 及其他差价合约 (CFD) 推荐账户 任何账户类型 可视化 彩色趋势蜡烛 (买入/卖出/微弱/变化) + 买入/卖出箭头 附加模块 交易时段方框 (悉尼、东京、伦敦、纽约) 主要功能 多时间周期趋势分析: 直接在
Smart Trend Trading System — MetaTrader 5 购买后,请在 MQL5 上给我发消息,即可免费获得 Smart Universal Expert Advisor,以及在线课程、PDF 手册和私人群组访问权限。 STTS 将趋势方向、入场和出场信号、反转区域及重要价格水平集中呈现在图表上。您可以根据系统手动交易,也可以连接单独的兼容 EA,按照您选择的设置自动执行交易。 一套系统,四种交易思路 STTS 将交易方法分为四大类: • 剥头皮交易 — 跟踪短期信号和市场波动。 • 趋势交易 — 评估方向,寻找趋势中的交易机会。 • 反转交易 — 识别潜在的转折区域和方向变化。 • 成交量交易 — 利用成交量相关信息评估市场活跃程度。 入场和出场箭头、趋势信息、支撑与阻力位及反转区域,帮助您直接在图表上分析交易形态。 先从一种方法开始。了解其信号和设置后,再探索其他方法。 从信号到自动化 Smart Universal Expert Advisor 可连接 STTS,让您自动执行受支持的交易信号。 启用自动交易前,请配置指标连接、仓位大小和交易管理设置
SuperScalp Pro
Van Minh Nguyen
4.56 (36)
SuperScalp Pro - Professional Multi-Layer Confluence Scalping System SuperScalp Pro 是一款高级剥头皮交易指标,在经典 Supertrend 的基础上加入了多个智能确认过滤器。它可以帮助您识别概率更高的 Buy/Sell 交易机会,同时显著减少虚假信号。 清晰的 Buy 和 Sell 箭头会直接显示在图表上,基于 ATR 的 Stop Loss 和 Take Profit 水平会实时自动计算。 购买后,请联系我获取设置指导和推荐配置。 使用 SuperScalp Pro Auto Trader 轻松实现信号自动化: [Auto Trader] 下载推荐设置文件: [Set File] 完整文档请参阅产品博客: [User Guide] 加入官方频道获取最新更新: [Official Channel] 您将获得什么 SuperScalp Pro Indicator – 多层级 Buy/Sell 信号,并自动计算基于 ATR 的 Stop Loss 和 Take Profit。 免费 VM Auto SLTP
Entry Points Pro for MT5
Yury Orlov
4.52 (151)
传奇回归:Entry Points Pro 10。 这款传奇指标曾 3 年稳居 MQL5 Market 前三,如今全面重启。 数百条热情好评(两个版本合计 589 条),每天有数千名交易者用它交易,演示版下载 31,000+   MT4+MT5  次。 五年来我读过你们的每一条评价——在第 10 版里,我没有给出许诺,而是把答案直接做进了产品。指标作者自 1999 年入市, 珍视诚信、自己的声誉和自己的客户 。 Entry Points Pro 给出的入场信号严格不重绘。 而且这一次不再只是作者的一面之词,而是可验证的事实:确认信号只在 K 线收盘后标出,自动化测试记录到 零重绘 (在 EURUSD、XAUUSD 和 BTCUSD 上共 2,486,568 次不变量检查——0 次违规)。测试方法完全公开——您可以在策略测试器中自行复现。 购买后请务必第一时间给我发私信。 我会发给您 扩展版说明书《交易者圣经》 ——使用本指标交易的完整指南——并告诉您如何免费获得 赠品:市场扫描器 ,它能同时分析多个品种和多个时间周期,并在一个界面上显示 Entry Points Pro 此刻在哪里表现
Neuro Poseidon MT5
Daria Rezueva
4.75 (52)
Neuro Poseidon is a new indicator by Daria Rezueva. It combines precise trading signals with adaptive TP/SL levels - creating best possible trades as a result! Message me and get  Neuro Poseidon Assistant  as a gift to automize your trading process! What makes it stand out? 1. Proven profitability on all assets and timeframes 2. Only confirmed BUY and SELL signals present on the chart 3. Adaptive TP & SL levels generated by the software for each trade 4. Easy to understand - suitable for al
Adaptive Price Action Engine 买指标,免费送EA 自适应多时间框架趋势与K线形态智能分析系统 市场环境始终在变化,不同的市场阶段中,并非所有 Price Action 形态都具有相同的参考价值。 Adaptive Price Action Engine 旨在适应不断变化的市场条件,将 趋势结构、多时间框架分析、K线形态与统计优化 整合到一个统一的分析框架中。 两种自适应模式 Dual Alpha Trend Mode(双 Alpha Trend 模式) 自动搜索适合的 Alpha Trend 参数,并结合低周期与高周期市场结构,使指标能够根据近期市场行为动态调整趋势识别。 Candlestick + Alpha Mode(K线 + Alpha 模式) 将 Alpha Trend 市场状态与 22种多空K线形态 相结合。系统不会简单地对所有形态一视同仁,而是对不同的形态组合进行统计评估,并识别在特定市场环境下表现出更强历史统计特征的配置。 主要功能 趋势参数自动优化 多时间框架市场状态分析 22种多头与空头 Price Action K线形态 对数千种可能
Auto Optimized SpeedAngle 是一款机构级的动量向量化系统,通过持续的前瞻优化(Walk-Forward Optimization, WFO)彻底消除了曲线拟合(curve-fitting)。该指标没有采用在市场 状态转换时容易失效的静态输入参数,而是利用出样外验证(Out-of-Sample, OOS) dynamically 动态重新校准设置,从而确保显示的 信号代表真正的统计优势,而非历史巧合。 核心机构级架构 前瞻优化引擎(Walk-Forward Optimization Engine): 核心算法持续扫描数千种回溯周期(lookback)与阈值组合,严格将数据划分为样本内(in-sample)和样本外(out-of-sample)。只有当参数配置在未知数据环境中证明具备数学优越性时,系统才会对其进行 adoption。 量化目标函数(Quantitative Objective Functions): 优化引擎不一味追求绝对毛利,而是聚焦于机构级的稳定性指标。用户可针对系统质量数(SQN)、期望值(每笔交易的平均 R 倍数)或净 R 值进行优化,从而优
M1 Sniper MT5
Oleg Rodin
5 (7)
M1 SNIPER   是一款易于使用的交易指标系统。它是一个专为 M1 时间框架设计的箭头指标。该指标可以作为独立的系统在 M1 时间框架下进行剥头皮交易,也可以作为您现有交易系统的一部分使用。虽然该交易系统专为 M1 时间框架交易而设计,但它也可以用于其他时间框架。我最初设计此方法是为了交易 XAUUSD 和 BTCUSD。但我发现这种方法在其他市场交易中也同样有用。 指标信号既可以顺势交易,也可以逆势交易。我教授一种特殊的交易技巧,帮助您利用指标信号进行双向交易。该方法基于使用特殊的动态支撑位和阻力位区域。 购买后,您可以立即下载 M1 SNIPER 箭头指标。此外,我还为所有 M1 SNIPER 工具用户免费提供下方屏幕截图所示的 Apollo Dynamic SR 指标!这两个指标的组合可以帮助您更轻松、更准确地利用 M1 时间框架进行交易。 购买后请联系我,免费获取交易提示和奖励指标! 祝您交易成功!
Gann Made Easy MT5
Oleg Rodin
5 (11)
Gann Made Easy   是一个专业且易于使用的外汇交易系统,它基于使用先生理论的最佳交易原则。 W.D.江恩。该指标提供准确的买入和卖出信号,包括止损和获利水平。您甚至可以使用推送通知在旅途中进行交易。 购买后请联系我,即可免费获得交易指导和超棒的额外指标! 您可能已经多次听说过江恩交易方法。通常 Gann 的理论不仅对于新手交易者而且对于那些已经有一定交易经验的人来说都是非常复杂的东西。这是因为江恩的交易方法在理论上并不那么容易应用。我花了几年时间来完善这些知识,并将最好的原则应用到我的外汇指标中。 该指标非常易于应用。您所需要的只是将其附加到您的图表并遵循简单的交易建议。该指标不断进行市场分析工作并寻找交易机会。当它检测到一个好的入口点时,它会为您提供一个箭头信号。该指标还显示止损和获利水平。 换句话说,当您像先生一样进行交易时,该指标会为您提供最佳江恩建议。江恩亲自告诉你此时此刻该做什么。但最好的部分是您不需要了解任何有关江恩交易原则的知识,因为该指标会为您完成整个市场分析工作。
ARIPoint
Temirlan Kdyrkhan
1 (4)
ARIPoint is a powerful trading companion designed to generate high-probability entry signals with dynamic TP/SL/DP levels based on volatility. Built-in performance tracking shows win/loss stats, PP1/PP2 hits, and success rates all updated live. Key Features: Buy/Sell signals with adaptive volatility bands Real-time TP/SL/DP levels based on ATR Built-in MA Filter with optional ATR/StdDev volatility Performance stats panel (Success, Profit/Loss, PP1/PP2) Alerts via popup, sound, push, or email Cu
Scalper Vault MT5
Oleg Rodin
5 (1)
Scalper Vault   是一个专业的剥头皮系统,为您提供成功剥头皮所需的一切。该指标是一个完整的交易系统,可供外汇和二元期权交易者使用。推荐的时间范围是 M5。 该系统为您提供趋势方向的准确箭头信号。它还为您提供顶部和底部信号以及江恩市场水平。无论您拥有何种交易经验,该系统都易于使用。您只需要遵循简单的规则并每天重复该过程。 建议将此系统用于主要货币对。感谢您的关注! 请注意,该指标在策略测试器中可能无法正常工作。因此,我建议仅在模拟或真实账户的真实交易条件下使用该系统。 指示器提供所有类型的警报,包括推送通知。 购买指标后请与我联系。我将免费与您分享我的个人交易建议和出色的奖励指标! 祝您交易愉快,盈利!
Trend Catcher ind mt5
Ramil Minniakhmetov
5 (18)
趨勢捕捉指標 趨勢捕捉指標結合了作者獨有的客製化自適應趨勢分析指標,用於分析市場價格趨勢。它透過過濾掉短期噪音,並專注於潛在的動能強度、波動性擴張和價格結構行為,來識別真實的市場方向。此外,它還結合了平滑和趨勢過濾等客製化指標,例如移動平均線、相對強弱指標 (RSI) 和波動率過濾器。 您可以在這裡查看實際運行情況以及我的其他產品: https://www.mql5.com/en/users/mechanic/seller 請注意,我不會在 Telegram 上出售 EA 或任何設置,那是騙局。所有設定都可以在我的部落格上免費取得。 重要提示!購買後請立即聯繫我,以獲取使用說明和額外獎勵! 請注意,我不會在 Telegram 上出售 EA 或任何設置,那是騙局。所有設定都可以在我的部落格上免費取得。
Entry In The Zone and SMC Multi Timeframe is a real-time market analysis tool based on Smart Money Concepts (SMC), designed to analyze market structure, price direction, and key trading zones. It supports both Single-Timeframe and Multi-Timeframe Analysis, providing a clearer view of overall market structure across multiple timeframes, with real-time BUY / SELL signals designed with a strict focus on No-Repaint principles. The signals are designed to help filter unclear setups and evaluate tradi
您好,交易员! 大多数散户交易者依赖于滞后的网页脚本。真正具有交易优势需要机构化的架构。 Astro AI 指标并非标准的图表叠加层。它是一个编译后的神经网络,包含两个代理,直接运行在您的终端上。 以下是该系统背后的具体技术: 1. 代理 1:分析师(图神经网络 - GNN) 市场并非孤立的价格柱;它们是相互关联的数据网络。 功能:代理 1 使用图神经网络来映射这些复杂的非线性关系。 优势:标准指标仅考虑单一的历史移动平均线,而我们的 GNN 可以实时处理深层的市场结构关系,在散户交易量发挥作用之前揭示隐藏的相关性。 2. 代理 2:执行器(近端策略优化 - PPO) 模式识别只是成功的一半。基于当前市场波动做出正确的决策,才是预测模型与滞后模型之间的区别所在。 功能:代理 2 使用 PPO(一种先进的强化学习算法)来确定最佳入场点。 优势:它持续调整交易策略,而非使用静态的“超买”或“超卖”线。它会分析当前市场状况并计算最可能的成交点。 执行桥接:通过 ONNX 集成到交易终端 如果执行速度慢,模式识别就毫无用处。我们已通过 ONNX(开放神经网络交换平台)
Divergence Bomber
Ihor Otkydach
4.89 (94)
购买该指标的每位用户将额外免费获得以下内容: 原创工具“Bomber Utility”,该工具会自动跟踪每一笔交易,设置止损和止盈点,并根据策略规则自动平仓; 适用于不同交易品种的指标设置文件(Set 文件); 三种不同风险模式下的 Bomber Utility 设置文件:“最低风险”、“平衡风险” 和 “观望策略”; 一套详细的 视频操作手册,帮助您快速完成安装、配置并开始使用本交易系统。 注意: 要获取以上所有赠品,请通过 MQL5 的私人消息系统联系卖家。 我为您介绍原创的自定义指标 “Divergence Bomber”(背离轰炸机),它是一套基于 MACD 背离交易策略 的“全功能”交易系统。 该技术指标的主要任务是识别 价格与 MACD 指标之间的背离,并发出交易信号(包括推送通知),指示未来价格可能的运动方向。平均而言,这些信号的准确率超过 98%。有关该指标如何工作的详细说明,请观看本页面上的视频演示。 该系统使用 止损订单 和 动态回撤平仓机制 来管理交易。 Divergence Bomber 指标的主要特点: 支持交易的品种: AUDCAD、AUDCHF、AUDS
Unix Scalper
Issam Kassas
4 (4)
Unix Scalper — MetaTrader 5 购买后,请在 MQL5 上给我发消息,即可免费获得 Smart Universal Expert Advisor,以及在线课程、PDF 手册和私人群组访问权限。 发现交易形态,看清交易计划,选择执行方式。 UNIX Scalper 将市场分析、BUY/SELL/WAIT 决策以及 Entry、Stop Loss、TP1 和 TP2 水平集中在一个清晰的面板中。 看清信号与交易计划 • 明确的决策:BUY、SELL 或 WAIT。 • 明确的价格水平:Entry、Stop Loss、TP1 和 TP2。 • 多时间周期概览:比较面板中各时间周期的信号。 • 辅助分析:趋势、动量、成交量、波动率、支撑与阻力,以及市场质量。 • 灵活的布局:Minimized、Compact、Standard 或 Full。 查看信号,检查价格水平,再判断该交易形态是否符合您的交易规则。 从黄金和比特币开始 建议首先使用的交易品种:XAUUSD 和 BTCUSD。 探索短期剥头皮交易和较高时间周期分析。选择历史K线范围,通过表现曲线查看所选设置
Volatility Master for MetaTrader is a real-time dashboard tool that scans up to  50 symbols  to identify high-volatility , trending markets instantly. With bullish/bearish signals, customizable alerts, and a user-friendly interface, it helps you avoid range-bound conditions and focus on high-probability trades. Clarity leads to confidence. Trade confidently and protect your capital effectively with this powerful dashboard. We don't offer free or bonus indicators in exchange of reviews from you.
Quantum TrendPulse
Bogdan Ion Puscasu
5 (26)
介绍 Quantum TrendPulse   ,这是一款终极交易工具,它将 SuperTrend   、   RSI 和 Stochastic 的强大功能整合到一个综合指标中,以最大限度地发挥您的交易潜力。该指标专为追求精准和效率的交易者而设计,可帮助您自信地识别市场趋势、动量变化以及最佳进入和退出点。 主要特点: 超级趋势整合: 轻松跟随当前的市场趋势并乘上盈利浪潮。 RSI 精度: 检测超买和超卖水平,非常适合把握市场逆转时机,可用作 SuperTrend 的过滤器 随机精度: 利用随机振荡在波动的市场中寻找隐藏的机会, 用作超级趋势的过滤器 多时间范围分析: 从 M5 到 H1 或 H4,在不同时间范围内关注市场动态。 可定制的警报: 当您的自定义交易条件得到满足时收到通知,这样您就不会错过任何交易。 无论您是新手还是经验丰富的交易员,   Quantum TrendPulse 都能为您提供所需的优势,帮助您增强策略并自信地进行交易。借助这一强大的指标,将洞察力转化为利润 — 掌控您的交易! ***购买 Quantum TrendPulse,即可免费获得 Quantum Tr
介绍     Quantum Breakout PRO   ,突破性的 MQL5 指标,正在改变您交易突破区域的方式!由拥有超过13年交易经验的资深交易员团队开发,     量子突破 PRO     旨在通过其创新和动态的突破区域策略将您的交易之旅推向新的高度。 量子突破指标将为您提供带有 5 个利润目标区域的突破区域的信号箭头,以及基于突破框的止损建议。 它既适合新手交易者,也适合专业交易者。 量子 EA 通道:       点击这里 重要的!购买后请私信我领取安装手册。 建议: 时间范围:M15 货币对:GBPJPY、EURJPY、USDJPY、NZDUSD、XAUUSD 账户类型:ECN、Raw 或 Razor,点差极低 经纪商时间:GMT +3 经纪商:IC Markets、Pepperstone with Raw 和 Razor 的点差最低 规格: 不重漆! 最多 5 个建议利润目标区域 建议止损水平 可定制的盒子。您可以设置自己的 Box Time Start 和 Box Time End。 接触 如果您有任何疑问或需要帮助,请通过私人消息与我联系。
Atomic Analyst MT5
Issam Kassas
4.48 (62)
Atomic Analyst — MetaTrader 5 购买后,请在 MQL5 上给我发消息,即可免费获得 Smart Universal Expert Advisor,以及在线课程、PDF 手册和私人群组访问权限。 Atomic Analyst 将价格行为、趋势方向、入场和出场信号、止损位及多个止盈位集中呈现在图表上。 看清信号,理解交易形态 Atomic Analyst 将分析结果整理为清晰的可视化信息: • 买入和卖出箭头,用于识别潜在的入场机会。 • 止损位和多个止盈位,帮助规划交易。 • 趋势、强度和动量读数,用于评估市场方向。 • 多时间周期分析,用于比较更广泛的市场背景。 • 彩色K线和提醒,帮助您跟踪变化的市场条件。 结合辅助分析查看信号,再判断该交易形态是否符合您的交易规则。 从短期形态到更大级别的行情 您可以将 Atomic Analyst 用于剥头皮交易、日内交易,或跟踪持续时间更长的市场走势。 建议从 H1 时间周期开始。建议交易品种包括 EURUSD、AUDUSD 和 XAUUSD。 从信号到自动化 Smart Universal Expert A
PainX GainX Blue Spike Fusion AI Advanced Synthetic Index Spike Detection Indicator for MetaTrader 5 Discover potential spike setups with a clear, organized, and professional trading interface. PainX GainX Blue Spike Fusion AI is a specialized indicator designed for traders who monitor synthetic indices and want a structured way to observe potential price spike opportunities. The indicator combines signal monitoring, market-condition analysis, visual alerts, and event tracking in one convenient
PZ Divergence Trading MT5
PZ TRADING SLU
3.71 (7)
棘手的发现和频率稀缺是最可靠的交易方案之一。该指标使用您喜欢的振荡器自动查找并扫描常规和隐藏的发散。 [ 安装指南 | 更新指南 | 故障排除 | 常见问题 | 所有产品 ] 容易交易 发现常规和隐藏的分歧 支持许多知名的振荡器 根据突破实现交易信号 显示适当的止损和获利水平 可配置的振荡器参数 可自定义的颜色和尺寸 按条形过滤大小差异 实现绩效统计 它实现了电子邮件/声音/视觉警报 为了提供广阔的市场前景,可以使用不同的振荡器在同一张图表中多次加载该指标,而不会产生干扰。该指标支持以下振荡器: RSI CCI MACD OSMA 随机 动量 很棒的振荡器 加速器振荡器 威廉姆斯百分比范围 相对活力指数 由于差异可能会扩大很多,尤其是在外汇市场中,因此该指标产生了转折:它在等待交易突破之前等待donchian突破确认差异。最终结果是带有非常可靠的交易信号的重新粉刷指示器。 输入参数 幅度:用于寻找差异的之字形周期 振荡器-选择要加载到图表的振荡器。 突破期-交易信号的突破期,以柱为单位。 发散类型-启用或禁用发散类型:隐藏,常规或两者。 最小散度单位为条形-最小散度单位为条形
RelicusRoad Pro MT5
Relicus LLC
4.96 (25)
别再凭猜测做交易。 在同一张图表上看清何时入场、何时离场,以及市场的方向。 RelicusRoad Pro 将近二十种工具整合进一个指标,你可以只开启适合自己交易方式的那几项。 入场清晰。出场清晰。每张图表都有计划。 是不是很熟悉? 你刚买入,价格一分钟后就逆着你运行。 你出场太早,然后眼看着行情在你离场后继续走下去。 图表上有五个指标,给出五种不同的答案。 你的止损全凭猜测。 我们为何开发它 我们做外汇交易已有 18 年。RelicusRoad 背后的核心算法最初是在私下为我们自己的专业交易员圈子开发的。 初衷很个人。我们厌倦了一次次手工画同样的线,违反自己定下的规则,错过图表上真正重要的那一点。 对我们有效的是一致性:每天以同样的方式读图,直到它变成肌肉记忆。RelicusRoad Pro 把这种看盘方式带到你的图表上。 之后我们把它开放给更多交易员,因为一个小圈子能看到的东西有限。 每位交易员都会带来新的问题和想法,好的想法会进入下一次更新。今天其中很多工具之所以存在,是因为我们的交易员提出了需求。 这个社区保持私密且规模不大,同时活跃的交易员保持在 2,000 人以内。有些人使
Quantum Direction 是一款专业的趋势跟踪指标,旨在识别市场方向、发现趋势早期变化,并提供经过过滤的入场和出场信号。 该指标包含免费的 Quantum Trade Assistant ,这是一款专业的交易管理工具,可在 MQL5 Market 获取。它可以直接连接到 Quantum Direction ,并在出现有效信号时自动开仓,或在满足设定的出场条件时自动平仓。 在此下载免费的 Quantum Trade Assistant 该指标的主要功能: 多逻辑趋势检测 — 结合多种市场分析条件,用于识别潜在的趋势开始以及趋势方向变化。 交易时段过滤器 — 将信号集中在所选择的交易时段,帮助您在市场活跃度和波动性较高的时期分析交易机会。 高周期过滤器 — 使用更高时间周期确认市场方向,并帮助减少由短期突破或暂时性市场方向变化产生的信号。 入场与出场提醒 — 提供多种入场和出场信号提醒方式,帮助您无需持续盯盘即可监控市场。 点数盈亏仪表盘 — 在图表上显示信号累计点数盈亏,以便快速进行历史评估和回测。 我将这套策略应用于自己的交易,并在 YouTube 频道记录我的交易历程。购买
OrderFlux – MetaTrader 5 的订单流 (Order Flow) 与足迹图 (Footprint) 指标 OrderFlux 是一款专业的 MetaTrader 5 订单流和足迹图指标。它打开每一根 K 线,揭示其内部结构:每个价格水平的交易量,并将其划分为主动买盘和主动卖盘。根据这些 Tick 数据,系统会实时构建完整的足迹图,包括 Delta, Imbalance (失衡), Volume Profile (成交量分布) 和 Market Profile (市场轮廓) 。 常规图表只显示开盘、最高、最低和收盘价。这只是运动的结果,而非原因。OrderFlux 让每根 K 线的微观结构变得可见,并回答了最关键的问题: 究竟是谁在真正推动行情? 这使得交易者能够基于真实的交易量来读取支撑和阻力,而不是仅仅根据 K 线形状进行猜测。 足迹图显示内容 在每个价格水平上,都会显示两个数字。左侧是 Bid(买价)的交易量,右侧是 Ask(卖价)的交易量。这两侧之间的关系创造了 Delta — 来自买方或卖方的净压力。 Imbalances (失衡): 某一方具有压倒性优势的
Power Candles MT5
Daniel Stein
4.58 (12)
Power Candles V3 - 自我优化的强度指标 Power Candles V3 把货币与品种的强度直接转化为图表上可执行的交易方案。指标不再仅根据强度给K线着色,而是在后台持续运行实时自动优化,为您正面对的品种给出最佳 Stop Loss、Take Profit 与信号阈值。一键采用,Entry、Stop Loss、Take Profit 线就以精确价格绘制在图表上,提醒消息中直接包含方向。 本工具是 Stein Investments 生态系统的一部分 - 18+ 款工具,加上 Max,您的一对一 AI 交易导师。  随时在线,深入了解每一款指标,在您需要梳理思路的那一刻就在那里。  立即认识他: https://stein.investments 每根收盘K线运行 3,000+ 次交易模拟。9 种强度状态。2 种策略并行测试。一键采用最优配置。 为什么需要这个 大多数强度指标只给您一个数值,然后留下三个问题:相信哪个阈值、用哪个 Stop Loss、走哪个交易方向。Power Candles V3 在每根收盘K线上自动回答这些问题。结果就是一个完整的交易方案 -
FX Trend MT5 NG
Daniel Stein
5 (6)
FX Trend NG:新一代多市场趋势智能分析工具 概述 FX Trend NG 是一款专业的多时间周期趋势分析与市场监控工具,帮助您在几秒钟内全面了解市场结构。 无需在多个图表之间来回切换,您可以立即看到哪些品种处于趋势中、哪里动能正在减弱,以及哪些时间周期之间存在强烈共振。 限时发布优惠 – 仅需 $30(6个月) 或 $80 终身授权 即可拥有 FX Trend NG 。 已经是 Stein Investments 客户? -> 发送消息 以获取专属客户群访问权限。 需要帮助或安装指导? -> 请访问 Stein Investments 官方页面 。 1. FX Trend NG 的核心优势 三状态趋势逻辑 —— 不只是 Buy 或 Sell • 大多数指标仅显示两种状态:Buy 或 Sell。 • FX Trend NG 增加第三种状态: Fade 。 • Fade 表示趋势强度正在减弱,在完全反转之前提前发出信号。 这种结构化逻辑让您看到趋势变化过程,而不仅仅是简单方向信号。 多时间周期分析(M1 至 MN1) • 从短线交易到中长线交易全面覆盖。 • 快速识别趋势
IX Power MT5
Daniel Stein
4.92 (13)
IX Power:解锁指数、大宗商品、加密货币和外汇市场洞察 概述 IX Power 是一款多功能工具,可分析指数、大宗商品、加密货币和外汇市场的强弱表现。 FX Power 提供针对货币对的最高精度,利用所有可用货币对数据进行分析,而 IX Power 专注于基础资产的市场数据。这使得 IX Power 成为非外汇市场的理想选择,同时在需要简单外汇分析时也非常可靠。它可以无缝适用于任何图表,提供清晰的、有行动价值的洞察,帮助提升您的交易决策。 1. 为什么 IX Power 对交易者非常有价值 多市场强弱分析 • IX Power 分析指数、大宗商品、加密货币和外汇市场的强弱表现,为每个市场提供量身定制的洞察。 • 监控 US30、WTI、黄金、比特币等资产的表现,发现交易机会。 适用于更广泛的市场 • 对于外汇交易, FX Power 提供无与伦比的精度,通过分析所有相关货币对。 • IX Power 专注于基础资产的市场数据,非常适合非外汇市场及简化的外汇分析。 实时适应性 • 借助自适应算法, IX Power 实时响应市场数据变化,保持分析的最新性。 • 实时更新
M1 Quantum MT5
Hamed Dehgani
4.2 (10)
使用 M1 Quantum 的实盘交易信号 : 信号 (交易由 Quantum Trade Assistant 自动 执行,并作为本产品 免费 提供。) 最新消息: 版本 1.64 已发布。现在所有交易的止损都会设置在相应的支撑位/阻力位之后。Smart Close 功能也进行了改进,以提升此版本 EA 的性能。 自 8 月 9 日起,实盘信号一直运行在版本 1.64 上。 价格计划: 当前价格: $169 (早期用户优惠) 下一阶段计划价格: $189 计划零售价: $299 开发者提示: 购买后请联系我,以获取 最新推荐的参数设置文件(Set File) 、交易建议,以及加入 VIP 支持群组 ,与其他 M1 Quantum 用户交流经验。 常见问题 - 设置文件 - 安装指南 M1 Quantum 是一款专业的 M1 交易系统,提供快速且精准的交易信号,并内置止损(Stop Loss)、止盈(Take Profit)以及智能资金管理功能。 M1 Quantum 包含专业的资金管理系统,通过专注于 连续盈利交易 ,帮助交易者更快地增长账户资金。 M1 Quantum 指标 的主
CRT Pro is a complete Candle Range Theory toolkit for MetaTrader 5. It finds the CRT model on up to three timeframes and adds the tools needed to read it: higher-timeframe candles, structure shifts, fair value gaps, liquidity sweeps, a bias table and SSMT divergence. Every module can be switched on or off. 1. CRT Model A CRT model is built from two candles of the chosen CRT timeframe. C1 is the range candle. C2 is the sweep candle: it takes the high or the low of C1 and closes back inside the
作者的更多信息
Eddy Candle Pulse — Smart Candle Countdown Timer for MT5 Eddy Candle Pulse is a lightweight and easy-to-use candle countdown indicator designed for MetaTrader 5. It displays the remaining time before the current candlestick closes, helping traders monitor candle timing directly on their trading charts. With a clean and minimalistic interface, Eddy Candle Pulse keeps the countdown visible near the current market price without interfering with candlestick analysis. Whether you trade Forex, Gold (X
FREE
筛选:
无评论
回复评论