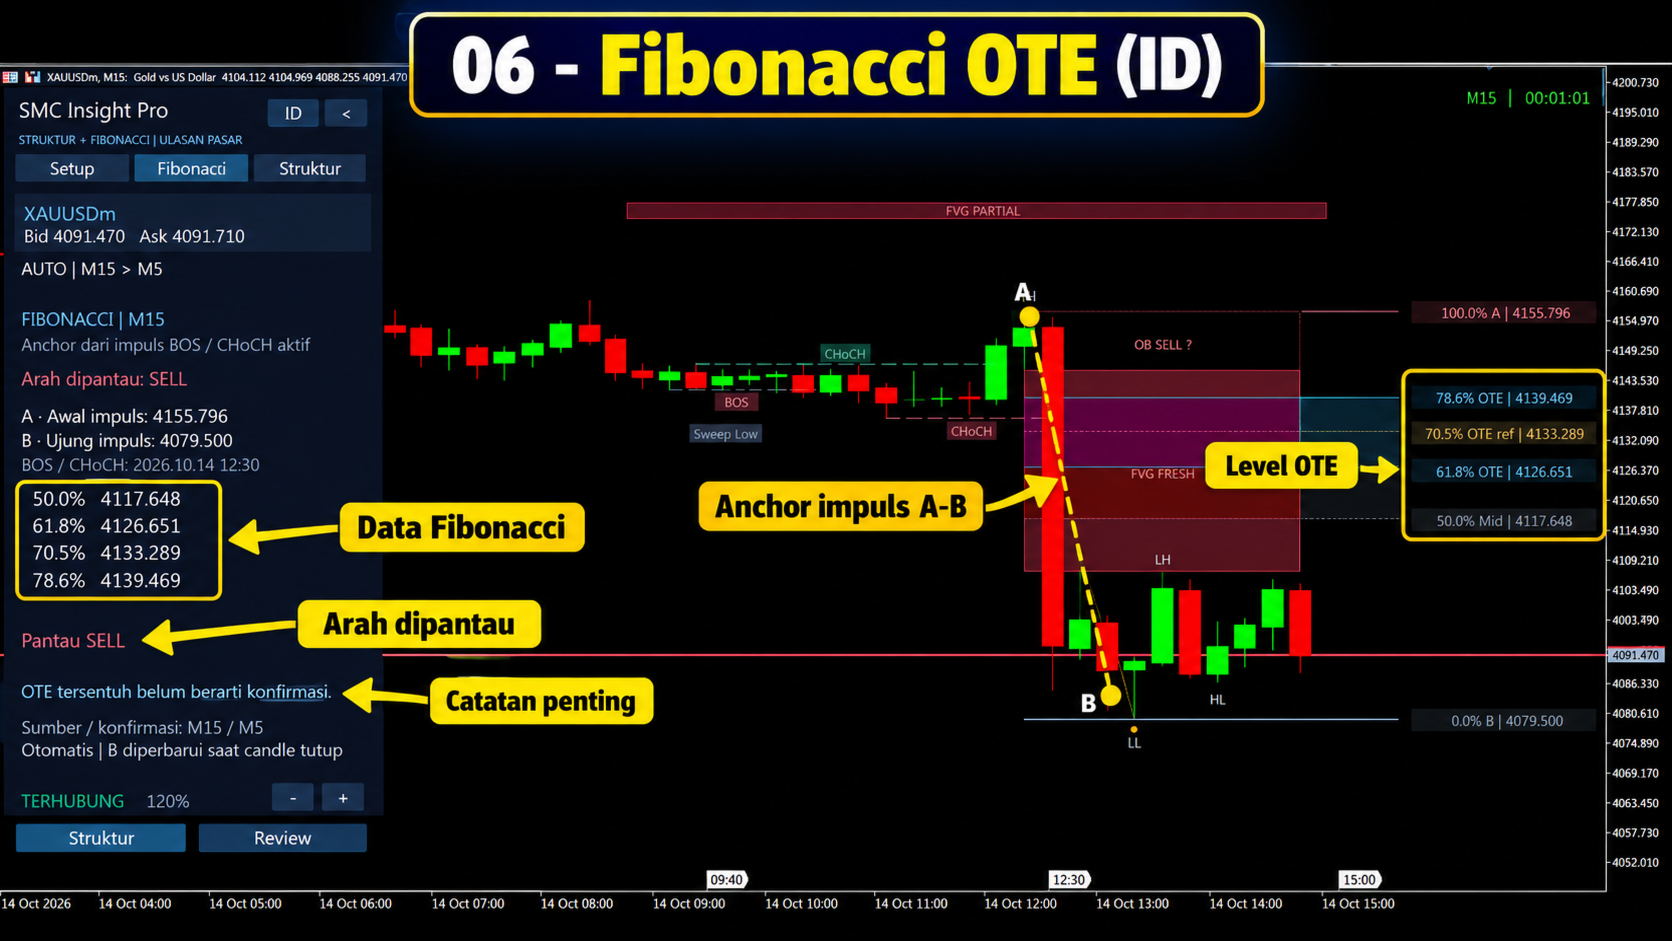
SMC Insight Pro

SMC Insight Pro

SMC Insight Pro is a visual analysis indicator for MetaTrader 5, developed by Eddy Gunawan. It combines market structure, automatic Fibonacci retracements, Fair Value Gap zones, and an interactive setup dashboard.

The indicator helps traders follow a structured analysis process: identify a qualifying impulse, monitor a retracement, wait for confirmation, and review analytical price references.

SMC Insight Pro does not open, modify, or close trades. All trading decisions and order execution remain under the user’s control.

Main Features

·        Market structure visualization, including swing highs and lows, Break of Structure (BOS), and Change of Character (CHoCH).

·        Fair Value Gap (FVG) zones and order block candidates for additional chart context.

·        Automatic Fibonacci retracements linked to qualifying structure-based impulses.

·        A highlighted Optimal Trade Entry (OTE) retracement zone.

·        A setup dashboard showing the monitored direction, current conditions, and confirmation status.

·        Reference entry, stop-loss, take-profit, and reward-to-risk information when a setup is confirmed.

·        Higher-timeframe structure context from H1 and H4.

·        English and Indonesian interface options, adjustable panel zoom, and chart display controls.

·        Optional popup and sound notifications when qualifying Fibonacci anchors become available.

·        Optional CSV audit exports for reviewing setup events and reference outcomes.

Timeframes and Setup Selection

The default setup uses M15 market structure with confirmation from closed M5 candles.

Start with an M15 chart to review the main structural setup. You can also view the same main setup on an M5 chart to inspect its confirmation timeframe.

An optional faster setup uses M5 market structure with M1 confirmation. This setup must be enabled separately in the inputs.

The run-mode input uses these identifiers:

·        RUN_SCALPING_ONLY: the default main M15/M5 setup.

·        RUN_INTRADAY_ONLY: the optional fast M5/M1 setup.

·        RUN_BOTH: enables both setups.

These input identifiers are retained from development. Follow the M15/M5 or M5/M1 labels on the dashboard when identifying the active setup.

When both setups are enabled, use the MAIN and FAST buttons to choose which setup to review. Each setup maintains its own analysis.

Changing the chart timeframe does not change the underlying analysis timeframes. For example, switching the default setup from an M15 chart to M5 does not convert it into the fast M5/M1 setup.

Fibonacci drawings are displayed on the selected setup’s associated chart timeframes:

·        Main setup: M15 and M5.

·        Fast setup: M5 and M1.

A qualifying active setup must exist before Fibonacci appears. M30 and H1 are not Fibonacci display timeframes for these fixed setups.

Getting Started

1.     Install SMC Insight Pro in your desktop MetaTrader 5 terminal.

2.     Open the symbol you want to analyse and select the M15 chart timeframe.

3.     Attach the indicator and begin with the default inputs.

4.     Keep the terminal connected and allow the required historical price data to load.

5.     Open the Setup page and check the displayed structure and confirmation timeframes.

6.     Monitor the setup status. Fibonacci appears automatically when the qualification rules are met.

7.     Review any confirmed entry, stop-loss, take-profit, and reward-to-risk references before making your own trading decision.

Manual Fibonacci drawing or anchor selection is not required. Opening the Fibonacci page does not create or confirm a setup.

The indicator analyses the chart symbol. It is not a multi-symbol scanner; use separate charts to review additional symbols.

Using the Dashboard

Setup

This page shows the monitored direction, setup status, relevant conditions, impulse checks, and available reference levels.

A watched BUY or SELL direction describes the setup being monitored. It does not, by itself, mean that an entry has been confirmed.

Fibonacci

This page provides information about the current Fibonacci anchors, retracement levels, and setup condition. Use it together with the chart to review the relationship between the impulse and its retracement.

Structure

This page provides a summary of the structure used by the selected setup, including its direction and relevant structural information.

Display Controls

Use the plus and minus buttons to adjust panel zoom. Use the language button to switch between English and Indonesian.

The lower Structure control displays the supporting market-structure drawings. Review hides those supporting drawings while retaining Fibonacci when it is valid and eligible for display.

The chart timeframe and the selected setup still determine which drawings can appear.

Understanding the Setup Process

Searching

The indicator is looking for a structure-based opportunity that meets its rules. No active entry reference is available.

Waiting for Impulse Qualification

A potential structure leg has been identified, but the required impulse conditions are not yet satisfied. A structure break alone does not guarantee that Fibonacci or a confirmed entry will appear.

Waiting for Retracement

A qualifying impulse is available. The indicator is waiting for price to return to the configured retracement area.

Waiting for Confirmation

Price has interacted with the relevant area, but the required closed-candle confirmation or other setup conditions are still pending.

Confirmed BUY or SELL

The configured confirmation and reference-level requirements have been met. The dashboard displays analytical entry, stop-loss, take-profit, and reward-to-risk information.

Invalidated or Expired

The setup has breached an applicable invalidation condition or exceeded its permitted lifetime. Wait for a new qualifying setup rather than continuing to treat the previous one as active.

Reference Outcome

The indicator may record that a take-profit or stop-loss reference was touched. These are observations of reference levels, not records of executed trades.

Automatic Fibonacci Behaviour

Fibonacci is linked to a qualifying structure leg. It is not drawn on every visible price swing.

While a setup remains unconfirmed, its impulse endpoint can update as new structure candles close. This can change the retracement levels and reset the waiting process.

Drawings can disappear when a setup is invalidated, expires, completes, or is replaced, or when the selected chart timeframe does not support the active setup’s Fibonacci display.

The presence of an OTE zone is not an entry confirmation. Wait for the status shown on the Setup page.

The indicator requires closed candles and confirmed pivots for relevant calculations. This introduces confirmation delay. It should not be described as identifying every swing or entry opportunity immediately.

Entry, Stop-Loss, Take-Profit and Reward-to-Risk

Entry ref is the analytical reference associated with a confirmed setup. It is not an instruction to enter at the current market price.

SL ref is calculated using the applicable stop model and buffer settings. TP ref is based on the applicable structural target rules.

The reward-to-risk figure compares the reference target and stop distances, including the indicator’s spread adjustment. It does not include every execution cost, such as commission or slippage.

If the required reference geometry or minimum reward-to-risk condition is not met, a confirmed entry reference may not be issued.

Once issued, the recorded entry, stop-loss, and take-profit references for that signal are retained for tracking. New setups can produce different references.

A displayed structure target or impulse invalidation level before confirmation should not be confused with a complete confirmed trade plan.

Higher-Timeframe Context

H1 and H4 readings provide additional market-structure context.

For the optional fast M5/M1 setup, enabled higher-timeframe filters can affect whether an entry reference is confirmed. These filters are configurable and do not guarantee a successful outcome.

If the required history is unavailable, the dashboard may show a waiting or unavailable-data condition. Allow the terminal to synchronise before interpreting the analysis.

Alerts

Optional popup and sound alerts notify you when qualifying Fibonacci anchors become available.

An anchor notification means that a Fibonacci setup is available for review. It is not an order execution message or a confirmed entry instruction.

Other setup developments should be monitored in the dashboard. This version does not provide a separate popup for every retracement, confirmation, invalidation, or reference outcome.

Historical loading does not replay old setup alerts. Keep MetaTrader 5 running and connected to receive eligible live notifications.

Audit Records

When enabled, CSV exports record setup events, closed-candle data, and session summaries.

Files are saved in the terminal’s shared Common\Files\SMC_AUDIT folder.

The dashboard’s audit counts describe recorded signal references and observed reference outcomes. They are not account trading statistics or verified profitability results.

Outcome tracking uses Bid candle data. If both the stop-loss and take-profit references are touched within the same observed candle, their sequence may be ambiguous. Actual execution can differ because of Ask prices, spreads, slippage, commissions, and broker conditions.

Frequently Asked Questions

Why is Fibonacci not visible?

Check that the selected setup is enabled, sufficient history has loaded, a qualifying setup exists, and you are viewing one of its associated chart timeframes. For the default main setup, use M15 or M5.

Why does the dashboard show BUY or SELL but no entry?

A monitored direction is different from a confirmed setup. Retracement, confirmation, risk geometry, or other requirements may still be pending.

Why are there no signals immediately after installation?

The indicator does not force signals. Available history and current market conditions must satisfy the configured rules.

Why does changing the chart timeframe not change the setup source?

The two setups use fixed analysis pairs: M15/M5 and M5/M1. The chart timeframe controls the view; it does not redefine those analysis pairs.

Does the indicator trade automatically?

No. It provides visual analysis and reference levels only.

Does the indicator detect actual institutional orders?

No. It applies rule-based interpretations of price structure, imbalances, and Fibonacci relationships. These interpretations do not establish the identity or intentions of market participants.

Usage Notes and Support

Begin with the default main M15/M5 setup and familiarise yourself with its status messages before enabling the optional fast setup or changing the qualification rules.

Broker price feeds, available history, spreads, and input settings can produce different observations. Evaluate the indicator on a demo account and on the symbol you intend to analyse.

SMC Insight Pro is an analytical tool. It does not guarantee profitable trades, a particular win rate, or future results.

For support, use the MQL5 product comments or private messaging. Include the product version, symbol, chart timeframe, selected setup, relevant inputs, and a screenshot. If an error occurs, include the corresponding Experts or Journal message.


Produits recommandés
AVIS IMPORTANT – LICENCE ET ACTIVATION REQUISES =============================================== Instructions d'activation : Après avoir finalisé votre achat, veuillez nous contacter immédiatement pour recevoir votre clé de licence, votre mot de passe ou vos informations d'activation. Sans ces éléments, le logiciel ne fonctionnera pas. Nous sommes là pour garantir un processus d'activation fluide et vous assister pour toute question. --- Volume Delta Profile V2 Enhanced =================
Here   our more valuable tools SMC Trend Trading   ,  Easy SMC Trading  ,  Institutional SMC Architect Volume Analysis Tools  ,  Volume flow Profile  ,  Market volume profile  , FVG with Volume  , Liquidity Heatmap Profile  ,  Volume Spread Analysis The    Liquidity Heatmap   is a sophisticated institutional trading tool designed to reveal where over-leveraged traders are trapped. By calculating estimated liquidation levels based on volume spikes and leverage, this indicator draws a dynamic "h
La Master Edition est un outil d'analyse de qualité professionnelle conçu pour visualiser la structure du marché à travers le prisme du volume et du flux monétaire. Contrairement aux indicateurs de volume standard, cet outil affiche un Profil de Volume Quotidien directement sur votre graphique, vous permettant de voir exactement où la découverte des prix a eu lieu et où est positionné "l'argent intelligent". Cette Master Edition est conçue pour la clarté et la rapidité, dotée d'un système unique


Below is the translation of your original English text into French: AVIS IMPORTANT – LICENCE ET ACTIVATION REQUISES Instructions d’activation : Dès que vous avez terminé votre achat, veuillez nous contacter immédiatement pour recevoir votre clé de licence, votre mot de passe ou les détails d’activation. Sans ces éléments, le logiciel ne fonctionnera pas. Nous sommes là pour garantir un processus d’activation fluide et vous assister en cas de questions. Personnalisation multilingue Po
TradeAQ
Guo Sheng Zhao
LuoMo Volume & Price Structure 8.98 A multi-function chart indicator for   MetaTrader 4 and MetaTrader 5 , designed to display key volume, volatility, sentiment, and price-structure information directly on the main chart. Main Features Volume and price-based Support & Resistance Volume spike and exhaustion signals ATR volatility expansion alerts Volume Profile with HVN and LVN Bullish and bearish sentiment distribution Developing or fixed POC VAH and VAL levels Supply and Demand zones Volume-wei
Delta Profile Volume
Teresinha Moraes Correia
Technical Description of the Indicator – Delta Profile for MetaTrader 5 The Delta Profile is an indicator developed for MetaTrader 5 focused on detailed analysis of volume flow within a defined range of candles. It organizes and displays information about the imbalance of positive volumes (associated with upward movements) and negative volumes (associated with downward movements) at different price levels. The result is a clear view of the chart points where the highest concentration of trades o
Boom Crash SMC
Israr Hussain Shah
Here   our more valuable tools SMC Trend Trading   ,  Easy SMC Trading  ,  Institutional SMC Architect Volume Analysis Tools  ,  Volume flow Profile  ,  Market volume profile  , FVG with Volume  , Liquidity Heatmap Profile  ,  Volume Spread Analysis Deriv boom and crash index spike killer system you can use it only on m5 timeframe  follow the structure and get signal with alert on phone open trade set sl tp and enjoy easy analysis and trading made simple 
Advanced Volume Profile Analysis Tool for MetaTrader 5 The Kecia Volume Profile Order Finder provides traders with volume profile analysis capabilities. This MT5 indicator combines volume profile visualization with statistical calculations to help identify potential trading opportunities and suggests entry, stop loss, and take profit levels based on market structure. Market Profile Visualization Transform your chart with customizable volume profile visualizations: Multiple visualization options
UPD1 Profile Levels MT5
Vitaliy Kuznetsov
5 (4)
L'indicateur trouve les niveaux de volume de prix maximum et minimum (profil de marché) sur l'histogramme de travail pour le nombre de barres spécifié.   Profil composite. La hauteur de l'histogramme est entièrement automatique et s'adapte à n'importe quel outil et période. L'algorithme de l'auteur est utilisé et ne répète pas les analogues connus. La hauteur des deux histogrammes est approximativement égale à la hauteur moyenne de la bougie. Smart alert vous permet de vous informer sur le prix
Was: $249  Now: $99   Market Profile defines a number of day types that can help the trader to determine market behaviour. A key feature is the Value Area, representing the range of price action where 70% of trading took place. Understanding the Value Area can give traders valuable insight into market direction and establish the higher odds trade. It is an excellent addition to any system you may be using. Inspired by Jim Dalton’s book “Mind Over Markets”, this indicator is designed to suit the
Symbol: EURUSD Timeframe: 30 minutes (M30) For other symbols or timeframes, adjust the settings to match the market. Volume Profile POC Breakout builds a volume profile from recent candles, finds the Point of Control (POC) and marks clean breakouts of that level. Each breakout is shown as a complete trade plan with entry, stop loss and three take profit levels, filtered by the higher timeframe trend and rated by a quality score. The indicator does not open trades. It is a visual and analysis to
Here   our more valuable tools SMC Trend Trading   ,  Easy SMC Trading  ,  Institutional SMC Architect Volume Analysis Tools  ,  Volume flow Profile  ,  Market volume profile  , FVG with Volume  , Liquidity Heatmap Profile  ,  Volume Spread Analysis Transform Your Trading with Intelligent Market Insights! The 2025 Spike Killer Dashboard is a powerful MQL5 indicator that combines cutting-edge signal generation with an intuitive crystal dashboard for real-time market analysis. Designed for tra
BoxChart MT5
Evgeny Shevtsov
5 (7)
The market is unfair if only because 10% of participants manage 90% of funds. An ordinary trader has slim changes to stand against these "vultures". This problem can be solved. You just need to be among these 10%, learn to predict their intentions and move with them. Volume is the only preemptive factor that faultlessly works on any timeframe and symbol. First, the volume appears and is accumulated, and only then the price moves. The price moves from one volume to another. Areas of volume accumu
Volume Pressure Pro
Wojciech Jerzy Magda
Volume Pressure Pro See who really controls the market — before the move becomes obvious. Most indicators show you where price has been . Volume Pressure Pro shows you who is winning the battle right now — buyers or sellers. This is not another repainted RSI or MACD clone. It is a proprietary algorithm built from scratch, and its formula remains a trade secret — which is exactly why its signals look like nothing else on your chart. What you get Clear BUY/SELL signals — a green arrow to buy
Binary Rise Fall
Israr Hussain Shah
Here   our more valuable tools SMC Trend Trading   ,  Easy SMC Trading  ,  Institutional SMC Architect Volume Analysis Tools  ,  Volume flow Profile  ,  Market volume profile  , FVG with Volume  , Liquidity Heatmap Profile  ,  Volume Spread Analysis The Fractals_Price indicator is a technical analysis tool that identifies fractal patterns on price charts. Fractals are recurring patterns that signal potential trend reversals or continuation points. This indicator marks both upward and downward
Volume Profile Multiple — Profils de Volume Multiples avec Buffers pour le Trading Algorithmique Fatigué de redessiner le Volume Profile bloc par bloc, en devant tout recalculer à chaque changement de timeframe ? Volume Profile Multiple trace automatiquement plusieurs profils de volume consécutifs sur le graphique, révélant où l'intérêt institutionnel s'est réellement concentré dans chaque section du marché — et pas seulement sur la dernière plage visible. Ce que l'indicateur fait pour vous L'in
ONNYX INDICATOR version 1.14 Indicateur d'offre et de demande pour MetaTrader 5 avec signaux confirmés sans repaint. Il détecte les pivots confirmés, adapte la largeur des zones avec l'ATR, affiche leur qualité en pourcentage et trace des flèches BUY/SELL sur bougies clôturées. FONCTIONS PRINCIPALES - Zones d'offre et de demande avec score en pourcentage dans la zone. - Grandes flèches BUY/SELL après clôture de la bougie. - Filtre de tendance EMA et confirmation optionnelle de rejet. - Panneau d
VibeFox Volume Profile — Volume Profile pour MetaTrader 5 VibeFox Volume Profile est une boîte à outils complète de Volume Profile pour MetaTrader 5. Elle construit la distribution horizontale du volume négocié le long du prix, afin que tu voies instantanément où le marché a concentré le plus d'activité, où il a peu négocié et quels niveaux de prix sont susceptibles d'agir comme des aimants ou des barrières. Chaque profil est dessiné directement sur le graphique et contrôlé depuis un panneau mod
VOLUME PROFILE SAF-XII Analyse Market Profile Professionnelle pour MT5 (L'indicateur idéal pour le trading de type Grid) QU'EST-CE QUE LE VOLUME PROFILE ? Le Volume Profile est un outil institutionnel qui affiche l'activité de trading à des niveaux de prix spécifiques, contrairement aux indicateurs de volume classiques qui montrent le volume en fonction du temps. Il révèle OÙ les transactions ont eu lieu, aidant ainsi à identifier : ZONES DE VALEUR (VAH/VAL) – Niveaux de prix où la majorité des
Risk Control Tool
Israr Hussain Shah
Here   our more valuable tools SMC Trend Trading   ,  Easy SMC Trading  ,  Institutional SMC Architect Volume Analysis Tools  ,  Volume flow Profile  ,  Market volume profile  , FVG with Volume  , Liquidity Heatmap Profile  ,  Volume Spread Analysis Overview (Short Description) A professional risk management indicator that helps traders calculate lot size, risk percentage, and reward ratio in real time. Perfect for Forex, Indices, Gold, and Synthetic Indices traders who want precise control ov
Et si tu voyais enfin OÙ le marché a vraiment envie d'aller ? La plupart des traders regardent le prix. Les pros, eux, regardent le VOLUME — là où l'argent s'est réellement échangé. Volume Profile Fibo Confluence met cette lecture sous tes yeux, en clair, sans jargon. CE QUE TU VOIS SUR TON GRAPHIQUE • Le POC, le prix le plus échangé : l'aimant naturel du marché • La zone de valeur (VAH / VAL) : la "maison" où le prix passe son temps • Le retracement de Fibonacci automatique + la
L'indicateur construit les cotations actuelles, qui peuvent être comparées aux cotations historiques et, sur cette base, faire une prévision de l'évolution des prix. L'indicateur dispose d'un champ de texte pour une navigation rapide jusqu'à la date souhaitée. Option : Symbole - sélection du symbole que l'indicateur affichera ; SymbolPeriod - sélection de la période à partir de laquelle l'indicateur prendra des données ; IndicatorColor - couleur de l'indicateur ; HorisontalShift - décalage
CVD SmoothFlow Pro
Thalles Nascimento De Carvalho
CVD SmoothFlow Pro - Analyse de Volume Illimitée pour Tout Actif ! CVD SmoothFlow Pro est la solution ultime pour les traders recherchant une analyse de volume précise et illimitée. En utilisant le calcul du Cumulative Volume Delta (CVD) avec un filtrage avancé du bruit, la version Pro offre la flexibilité et la précision nécessaires pour trader tout actif financier. Que propose CVD SmoothFlow Pro ? Analyse Claire : Filtre le bruit du marché et met en avant les mouvements de volume signifi
Le Volume Profile est l'un des outils analytiques les plus puissants utilisés par les traders professionnels et institutionnels. Contrairement aux indicateurs de volume traditionnels qui montrent uniquement le moment où les transactions se sont produites en bas de votre écran, le Volume Profile montre exactement à quels niveaux de prix ces transactions ont eu lieu. Cela vous donne une vision radiographique claire de la structure du marché, vous permettant de voir exactement où la smart money (ar
Détecteur intelligent multicouche de cassure et de retracement pour MetaTrader 5 « Intelligent. Simple. Rapide ! » Vous en avez assez de rater des entrées sur cassure à haute probabilité ? Passez-vous des heures à analyser de nombreux graphiques pour aligner les cassures avec la direction de la tendance et le momentum des devises — pour finalement manquer le mouvement ? Break Pullback résout tout cela en un seul indicateur. Qu'est-ce que Break Pullback ? Break Pullback est un indicateur MetaTr
Smart trend pro
Israr Hussain Shah
Here   our more valuable tools SMC Trend Trading   ,  Easy SMC Trading  ,  Institutional SMC Architect Volume Analysis Tools  ,  Volume flow Profile  ,  Market volume profile  , FVG with Volume  , Liquidity Heatmap Profile  ,  Volume Spread Analysis Professional trend-following indicator with comprehensive visualization and control panel Key Features: Advanced Trend Detection Reliable Half Trend algorithm for precise trend identification Color-coded trend lines (Blue for bullish, Orange for
Here   our more valuable tools SMC Trend Trading   ,  Easy SMC Trading  ,  Institutional SMC Architect Volume Analysis Tools  ,  Volume flow Profile  ,  Market volume profile  , FVG with Volume  , Liquidity Heatmap Profile  ,  Volume Spread Analysis Boom: Take SELL signals only (price spikes up then crashes) Crash: Take BUY signals only (price drops then spikes up) SL goes beyond the line as labeled Interactive Market Watch Panel : A left-side sidebar showing real-time strength indicators (po
An ICT fair value gap is a trading concept that identifies market imbalances based on a three-candle sequence. The middle candle has a large body while the adjacent candles have upper and lower wicks that do not overlap with the middle candle. This formation suggests that there is an imbalance where buying and selling powers are not equal. Settings Minimum size of FVG (pips) -> FVGs less than the indicated pips will be not be drawn Show touched FVGs Normal FVG color -> color of FVG that hasn't
FREE
Do you use volume in your reading of the market? Certainly many traders use it, and do not imagine operating without it. The Color Histogram Volume Set indicator allows the user to choose the value that he considers interesting to monitor. When you pass this you will have visual confirmation and if you want you will also have the audible alert that is given by the indicator. Of course, there are other ways to try to find a high volume, such as assessing whether the volume is above av
Volume Profile For MT5
Abdelkhabir Yassine Alaoui
Profil de Volume VPVR pour MT5 Le Profil de Volume VPVR est un indicateur MetaTrader 5 puissant et performant, conçu pour reproduire le profil de volume avancé (plage visible) directement sur votre graphique. Il offre une analyse approfondie de la structure du marché en visualisant les zones de concentration de l'activité de trading, aidant ainsi les traders à identifier avec précision les niveaux de prix clés. Cet indicateur analyse dynamiquement la distribution des volumes sur les différent
Les acheteurs de ce produit ont également acheté
Trend Sniper X
Sarvarbek Abduvoxobov
4.9 (41)
Trend Sniper X est un indicateur de suivi de tendance multi-unités de temps pour MetaTrader 5 qui aide les traders à identifier la direction de la tendance et les points d'inversion potentiels avec clarté et précision. pour MT4: https://www.mql5.com/en/market/product/193245 Informations sur le prix : Le prix actuel est un prix promotionnel et est susceptible de changer lors des prochaines mises à jour et nouvelles fonctionnalités. Offre bonus : Pour obtenir GRATUITEMENT l'Auto-Trade Assistant E
Smart Trend Trading System — MetaTrader 5 Après votre achat, envoyez-moi un message sur MQL5 pour recevoir GRATUITEMENT Smart Universal Expert Advisor, ainsi que le cours en ligne, le manuel PDF et l’accès au groupe privé. STTS réunit la direction de la tendance, les signaux d’entrée et de sortie, les zones de retournement et les niveaux de prix importants directement sur votre graphique. Suivez le système manuellement ou connectez un EA compatible distinct pour une exécution automatique selon l
La légende est de retour : Entry Points Pro 10. La relance de l'indicateur légendaire qui s'est maintenu 3 ans dans le Top-3 du MQL5 Market. Des centaines d'avis enthousiastes (589 sur les deux versions), des milliers de traders l'utilisent chaque jour, 31 000+ téléchargements de la démo   MT4+MT5 . J'ai lu chacun de vos avis publiés en cinq ans — et au lieu de promettre, j'ai intégré les réponses directement dans la version 10. Par un auteur présent sur les marchés depuis 1999, qui tient à l'ho
Adaptive Price Action Engine Achetez un indicateur, obtenez l'EA gratuitement Analyse auto-optimisée des tendances et des figures de chandeliers Multi-Timeframe Les marchés évoluent constamment, et tous les modèles de Price Action n’ont pas la même valeur dans toutes les conditions de marché. Adaptive Price Action Engine a été conçu pour s’adapter aux changements du marché en combinant structure de tendance, analyse Multi-Timeframe, figures de chandeliers et optimisation statistique au sein d’un
Neuro Poseidon MT5
Daria Rezueva
4.75 (52)
Neuro Poseidon is a new indicator by Daria Rezueva. It combines precise trading signals with adaptive TP/SL levels - creating best possible trades as a result! Message me and get  Neuro Poseidon Assistant  as a gift to automize your trading process! What makes it stand out? 1. Proven profitability on all assets and timeframes 2. Only confirmed BUY and SELL signals present on the chart 3. Adaptive TP & SL levels generated by the software for each trade 4. Easy to understand - suitable for al
Auto Optimized SpeedAngle est un système de vectorisation du momentum de niveau institutionnel qui élimine l'ajustement de courbe ( curve-fitting ) grâce à une optimisation continue par avancement ( Walk-Forward Optimization , WFO). Plutôt que de s'appuyer sur des entrées statiques qui se dégradent lorsque les régimes de marché changent, l'indicateur recalibre dynamiquement ses paramètres en utilisant une validation hors échantillon ( Out-of-Sample , OOS), garantissant ainsi que les signaux affi
M1 Sniper MT5
Oleg Rodin
5 (7)
M1 SNIPER   est un système d'indicateurs de trading facile à utiliser. Il s'agit d'un indicateur à flèche conçu pour l'unité de temps M1. Cet indicateur peut être utilisé seul pour le scalping sur l'unité de temps M1 ou intégré à votre système de trading existant. Bien que conçu spécifiquement pour le trading sur l'unité de temps M1, ce système peut également être utilisé avec d'autres unités de temps. Initialement, j'avais conçu cette méthode pour le trading du XAUUSD et du BTCUSD. Cependant, j
Gann Made Easy   est un système de trading Forex professionnel et facile à utiliser qui est basé sur les meilleurs principes de trading en utilisant la théorie de mr. WD Gann. L'indicateur fournit des signaux d'ACHAT et de VENTE précis, y compris les niveaux Stop Loss et Take Profit. Vous pouvez échanger même en déplacement en utilisant les notifications PUSH. VEUILLEZ ME CONTACTER APRÈS L'ACHAT POUR RECEVOIR GRATUITEMENT DES INSTRUCTIONS DE TRADING ET D'EXCELLENTS INDICATEURS SUPPLÉMENTAIRES! V
ARIPoint
Temirlan Kdyrkhan
1 (4)
ARIPoint is a powerful trading companion designed to generate high-probability entry signals with dynamic TP/SL/DP levels based on volatility. Built-in performance tracking shows win/loss stats, PP1/PP2 hits, and success rates all updated live. Key Features: Buy/Sell signals with adaptive volatility bands Real-time TP/SL/DP levels based on ATR Built-in MA Filter with optional ATR/StdDev volatility Performance stats panel (Success, Profit/Loss, PP1/PP2) Alerts via popup, sound, push, or email Cu
Scalper Vault   est un système de scalpage professionnel qui vous fournit tout ce dont vous avez besoin pour un scalpage réussi. Cet indicateur est un système de trading complet qui peut être utilisé par les traders de forex et d'options binaires. Le délai recommandé est M5. Le système vous fournit des signaux fléchés précis dans le sens de la tendance. Il vous fournit également des signaux supérieurs et inférieurs et des niveaux de marché Gann. Les indicateurs fournissent tous les types d'alert
Bonjour à tous les traders ! De nombreux investisseurs individuels utilisent des scripts web lents. Une approche systématique est essentielle pour un trading rentable. L'indicateur Astro AI n'est pas un simple affichage sur un graphique. Il s'agit d'un réseau neuronal sophistiqué composé de deux agents fonctionnant directement dans le terminal. Détails techniques du système : 1. Agent 1 : Analyste (Réseau neuronal graphique – GNN) Le marché n'est pas constitué de barres de prix individuelle
Divergence Bomber
Ihor Otkydach
4.89 (94)
Chaque acheteur de cet indicateur reçoit également gratuitement : L’outil exclusif « Bomber Utility », qui accompagne automatiquement chaque opération de trading, fixe les niveaux de Stop Loss et de Take Profit, et clôture les positions selon les règles de la stratégie Des fichiers de configuration (set files) pour adapter l’indicateur à différents actifs Des set files pour configurer le Bomber Utility selon différents modes : « Risque Minimum », « Risque Équilibré » et « Stratégie d’Attente »
Entry In The Zone and SMC Multi Timeframe is a real-time market analysis tool based on Smart Money Concepts (SMC), designed to analyze market structure, price direction, and key trading zones. It supports both Single-Timeframe and Multi-Timeframe Analysis, providing a clearer view of overall market structure across multiple timeframes, with real-time BUY / SELL signals designed with a strict focus on No-Repaint principles. The signals are designed to help filter unclear setups and evaluate tradi
Quantum TrendPulse
Bogdan Ion Puscasu
5 (26)
Présentation de   Quantum TrendPulse   , l'outil de trading ultime qui combine la puissance de   SuperTrend   ,   RSI   et   Stochastic   dans un seul indicateur complet pour maximiser votre potentiel de trading. Conçu pour les traders qui recherchent précision et efficacité, cet indicateur vous aide à identifier les tendances du marché, les changements de dynamique et les points d'entrée et de sortie optimaux en toute confiance. Caractéristiques principales : Intégration SuperTrend :   suivez f
RelicusRoad Pro MT5
Relicus LLC
4.96 (25)
Arrêtez de deviner vos trades. Sachez quand entrer, où sortir et dans quel sens va le marché, le tout sur un seul graphique. RelicusRoad Pro réunit près de vingt outils dans un seul indicateur, et vous activez ceux qui correspondent à votre façon de trader. Entrées claires. Sorties claires. Un plan sur chaque graphique. Ça vous dit quelque chose ? Vous achetez, et le prix se retourne contre vous une minute plus tard. Vous clôturez trop tôt, puis vous regardez le mouvement continuer sans vous. Ci
Présentation       Quantum Breakout PRO   , l'indicateur révolutionnaire MQL5 qui transforme la façon dont vous négociez les zones d'évasion ! Développé par une équipe de traders expérimentés avec une expérience commerciale de plus de 13 ans,       Évasion quantique PRO       est conçu pour propulser votre parcours commercial vers de nouveaux sommets grâce à sa stratégie de zone de discussion innovante et dynamique. Quantum Breakout Indicator vous donnera des flèches de signalisation sur les z
Volatility Master for MetaTrader is a real-time dashboard tool that scans up to  50 symbols  to identify high-volatility , trending markets instantly. With bullish/bearish signals, customizable alerts, and a user-friendly interface, it helps you avoid range-bound conditions and focus on high-probability trades. Clarity leads to confidence. Trade confidently and protect your capital effectively with this powerful dashboard. We don't offer free or bonus indicators in exchange of reviews from you.
Unlock hidden profits: accurate divergence trading for all markets Tricky to find and scarce in frequency, divergences are one of the most reliable trading scenarios. This indicator finds and scans for regular and hidden divergences automatically using your favourite oscillator. [ Installation Guide | Update Guide | Troubleshooting | FAQ | All Products  ] Easy to trade Finds regular and hidden divergences Supports many well known oscillators Implements trading signals based on breakouts Displays
Power Candles MT5
Daniel Stein
4.58 (12)
Power Candles V3 - Indicateur de force à optimisation automatique Power Candles V3 transforme la force des devises et des instruments en un plan de trading exploitable sur chaque graphique auquel il est associé. Au lieu de se contenter de colorer les bougies, il effectue une optimisation automatique en temps réel en arrière-plan et vous fournit les meilleurs niveaux de Stop Loss, Take Profit et seuils de signal pour le symbole que vous avez sous les yeux. Un simple clic suffit pour l'adopter en
Reversal Master for MT5 Reversal Master for MT5 is a non‑repainting reversal indicator for MetaTrader 5. It helps you detect potential market reversal points and shows the maximum favourable price movement after each historical signal, so you can better understand how price behaved after similar situations in the past. The MT5 version keeps the familiar reversal‑signal logic of the original Reversal Master for MT4, but adds improved visualisation, historical statistics and a points summary panel
Quantum Direction est un indicateur professionnel de suivi de tendance conçu pour identifier la direction du marché, détecter les changements de tendance à leurs débuts et fournir des signaux d'entrée et de sortie filtrés. Cet indicateur inclut gratuitement Quantum Trade Assistant , un outil professionnel de gestion des transactions disponible sur le MQL5 Market. Il peut se connecter directement à Quantum Direction et ouvrir automatiquement des positions lorsqu’un signal valide apparaît, ou ferm
OrderFlux – Indicateur Order Flow et Footprint pour MetaTrader 5 OrderFlux est un indicateur professionnel de flux d'ordres (Order Flow) et de footprint pour MetaTrader 5. Il ouvre chaque bougie individuelle et révèle ce qui se passe à l'intérieur : le volume échangé à chaque niveau de prix, séparé en acheteurs et vendeurs agressifs. À partir de ces données de ticks, un graphique Footprint complet est construit en temps réel, incluant le Delta, les Imbalances, le Volume Profile et le Market Prof
M1 Quantum MT5
Hamed Dehgani
4.2 (10)
Signaux de Trading en Direct avec M1 Quantum : Signal   (L’opération est exécutée automatiquement par le Quantum Trade Assistant , inclus gratuitement avec ce produit.) Dernières nouvelles : La version 1.64 a été publiée. Toutes les transactions disposent désormais d’un Stop Loss placé derrière les zones de support/résistance correspondantes. La fonction Smart Close a également été améliorée afin d’augmenter les performances de l’EA dans cette version. Depuis le 9 août, le signal en direct fonc
Bill Williams Advanced
Siarhei Vashchylka
5 (11)
Bill Williams Advanced is designed for automatic chart analysis using Bill Williams' "Profitunity" system. The indicator analyzes four timeframes at once. Manual (Be sure to read before purchasing) Advantages 1. Analyzes the chart using Bill Williams' "Profitunity" system. Signals are displayed in a table in the corner of the screen and on the price chart. 2. Finds all known AO and AC signals, as well as zone signals. Equipped with a trend filter based on the Alligator. 3. Finds "Divergence Bar
CRT Pro is a complete Candle Range Theory toolkit for MetaTrader 5. It finds the CRT model on up to three timeframes and adds the tools needed to read it: higher-timeframe candles, structure shifts, fair value gaps, liquidity sweeps, a bias table and SSMT divergence. Every module can be switched on or off. 1. CRT Model A CRT model is built from two candles of the chosen CRT timeframe. C1 is the range candle. C2 is the sweep candle: it takes the high or the low of C1 and closes back inside the
Currency Strength Wizard   est un indicateur très puissant qui vous offre une solution tout-en-un pour un trading réussi. L'indicateur calcule la puissance de telle ou telle paire de devises en utilisant les données de toutes les devises sur plusieurs périodes. Ces données sont représentées sous la forme d'un indice de devise facile à utiliser et de lignes électriques de devise que vous pouvez utiliser pour voir la puissance de telle ou telle devise. Tout ce dont vous avez besoin est d'attacher
ICT PO3 (Power of 3) AMD Protocol Framework Indicator True Time & Structure Integration   |  Non-Repainting | Real-Time  | Multi-Asset  | MT4 Version Available Full Setup Guide & Strategy Playbook: https://www.mql5.com/en/blogs/post/768683 The ICT Power of Three (PO3): The Complete Guide to Accumulation, Manipulation, and Distribution https://www.mql5.com/en/blogs/post/771729 MT4 Version: https://www.mql5.com/en/market/product/171742 Indicator Overview The ICT PO3 AMD Protocol Framework i
Advanced Supply Demand MT5
Bernhard Schweigert
4.53 (15)
La meilleure solution pour tout commerçant débutant ou expert ! Cet indicateur est un outil de trading unique, de haute qualité et abordable car nous avons intégré un certain nombre de fonctionnalités propriétaires et une nouvelle formule. Avec cette mise à jour, vous pourrez afficher des zones à double horaire. Vous pourrez non seulement afficher un TF plus élevé, mais afficher les deux, le graphique TF, PLUS le TF supérieur : AFFICHAGE DES ZONES NICHÉES. Tous les traders Supply Demand vont ado
Superhero
Ihor Otkydach
5 (3)
L'indicateur SUPERHERO est un système de trading multidevises conçu selon un principe « tout compris ». Cet indicateur analyse le marché de manière autonome et fournit des signaux indiquant quand ouvrir et clôturer des positions. Il utilise des ordres Stop Loss et Take Profit. Le rapport R:R est de 1:1. Ce système peut envoyer des notifications push sur votre smartphone, ce qui vous permet de passer des ordres « où que vous soyez », sans avoir à rester devant un ordinateur. C'est la solution idé
CGE Trading Suite
Carl Gustav Johan Ekstrom
5 (2)
Institutional-Grade Analytics for MT5 The full analytical edge of a professional trading desk, built into your MT5 chart. Standard retail platforms lack the depth required for professional market analysis. The CGE Trading Suite bridges this gap, transforming MetaTrader 5 into a comprehensive workspace. By integrating 22 proprietary modules into a single, unified chart interface, the suite eliminates fragmented analysis. It provides definitive clarity across market structure, timing, momentum,
Filtrer:
Aucun avis
Répondre à l'avis