SMC Insight Pro

SMC Insight Pro

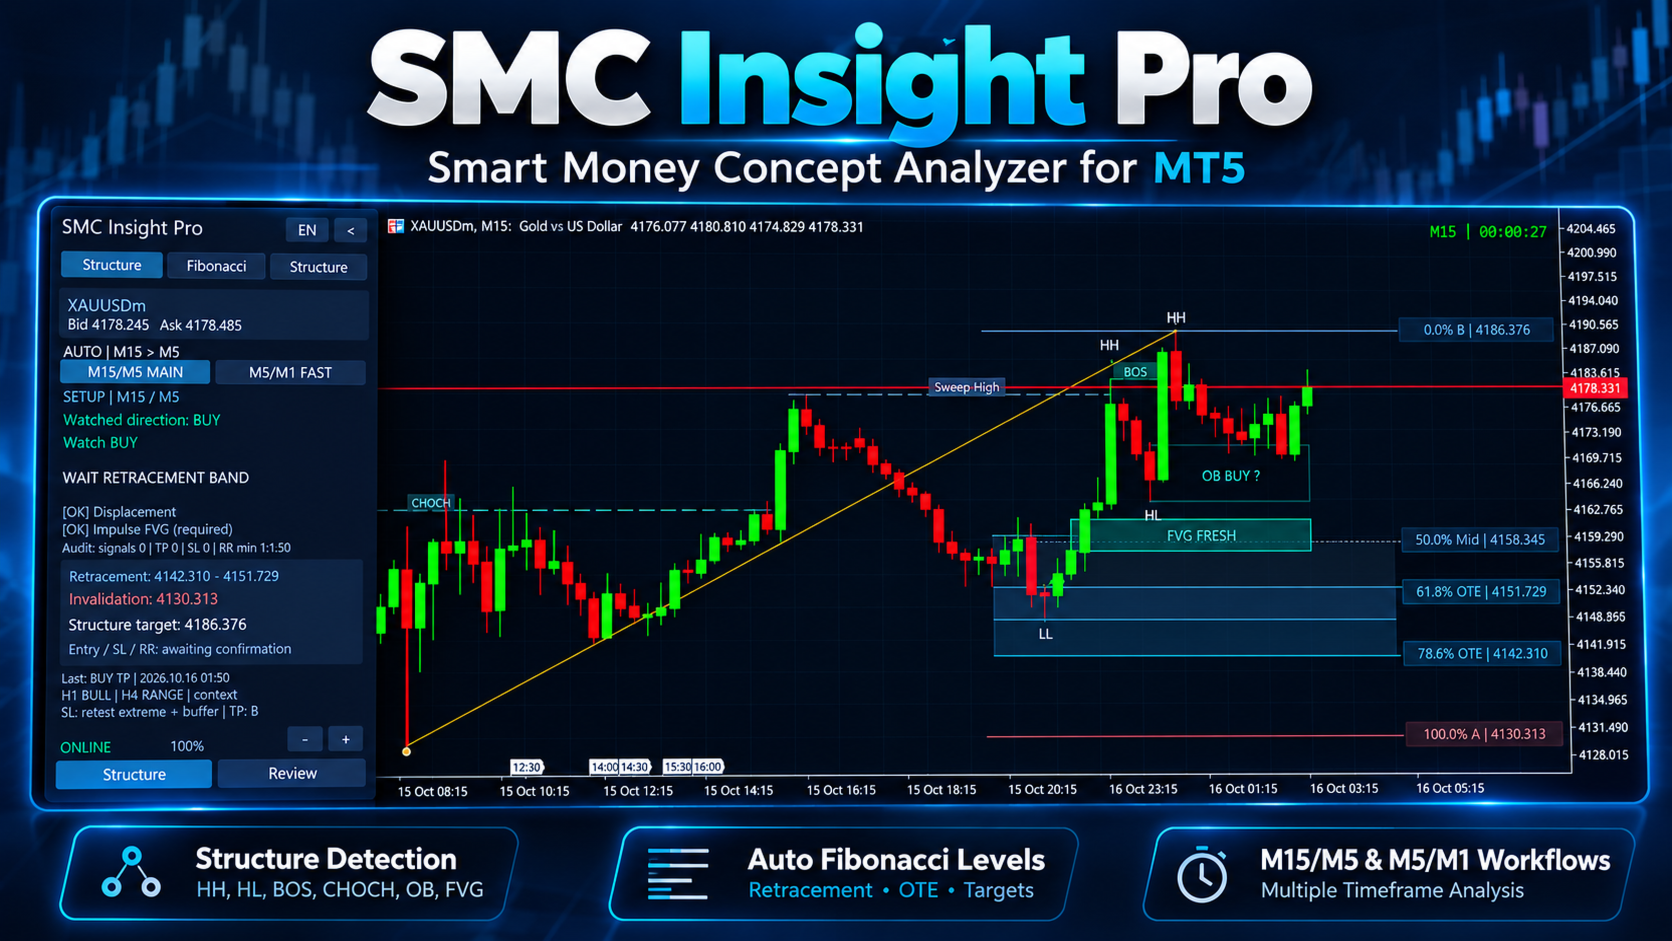
SMC Insight Pro is a visual analysis indicator for MetaTrader 5, developed by Eddy Gunawan. It combines market structure, automatic Fibonacci retracements, Fair Value Gap zones, and an interactive setup dashboard.

The indicator helps traders follow a structured analysis process: identify a qualifying impulse, monitor a retracement, wait for confirmation, and review analytical price references.

SMC Insight Pro does not open, modify, or close trades. All trading decisions and order execution remain under the user’s control.

Main Features

·        Market structure visualization, including swing highs and lows, Break of Structure (BOS), and Change of Character (CHoCH).

·        Fair Value Gap (FVG) zones and order block candidates for additional chart context.

·        Automatic Fibonacci retracements linked to qualifying structure-based impulses.

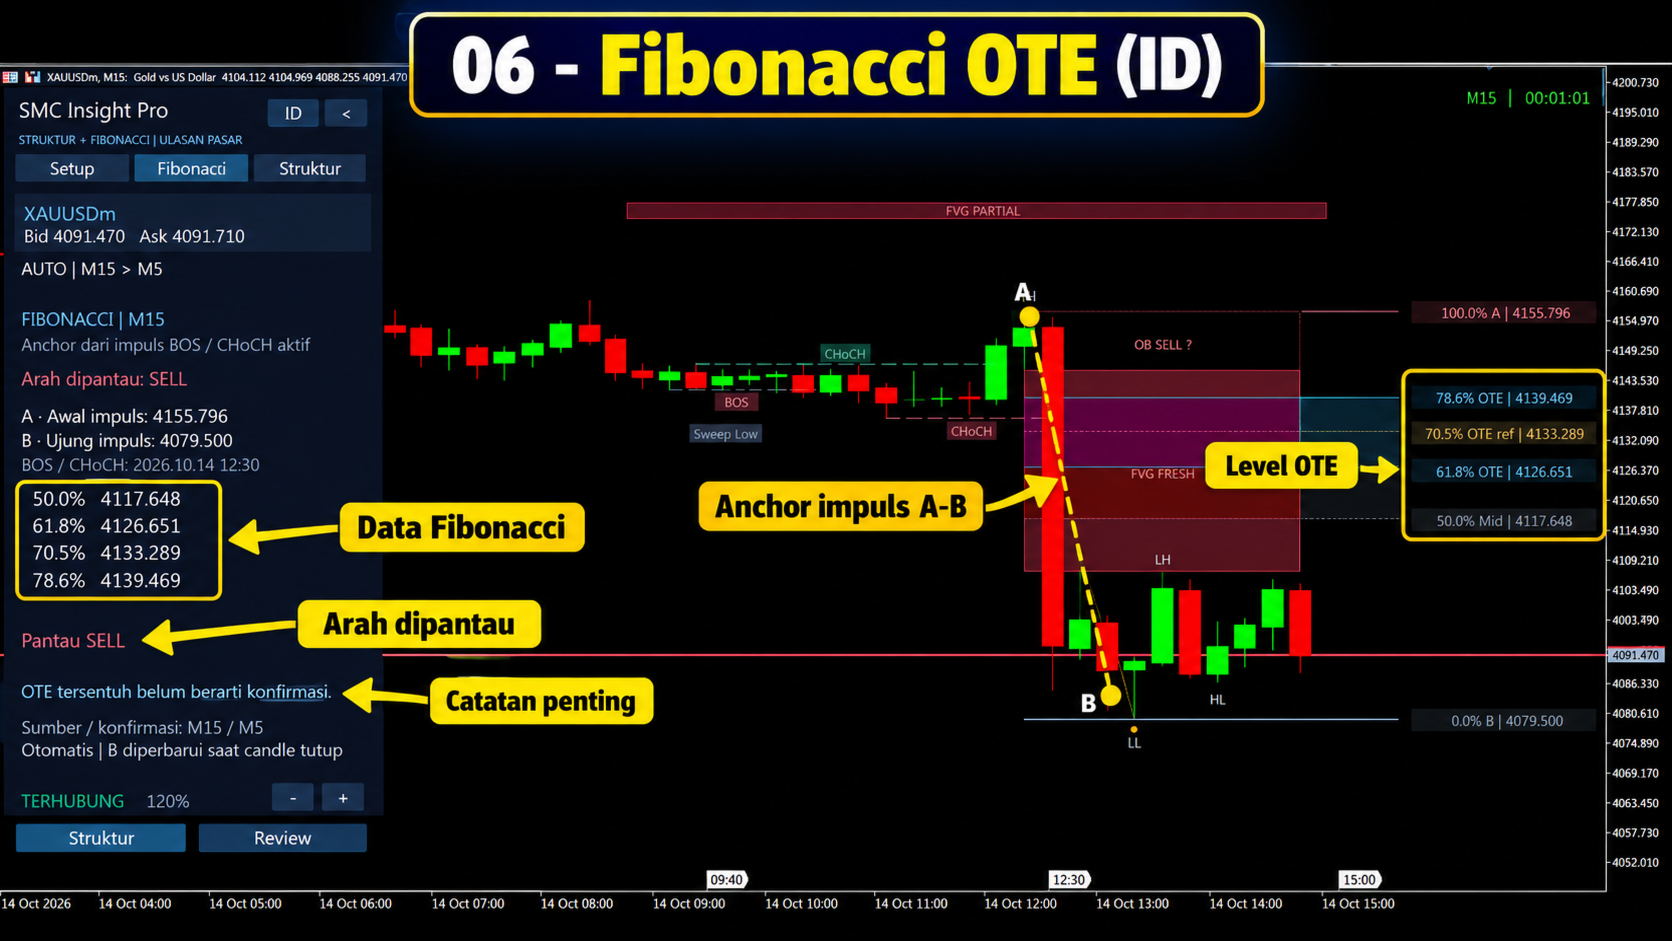
·        A highlighted Optimal Trade Entry (OTE) retracement zone.

·        A setup dashboard showing the monitored direction, current conditions, and confirmation status.

·        Reference entry, stop-loss, take-profit, and reward-to-risk information when a setup is confirmed.

·        Higher-timeframe structure context from H1 and H4.

·        English and Indonesian interface options, adjustable panel zoom, and chart display controls.

·        Optional popup and sound notifications when qualifying Fibonacci anchors become available.

·        Optional CSV audit exports for reviewing setup events and reference outcomes.

Timeframes and Setup Selection

The default setup uses M15 market structure with confirmation from closed M5 candles.

Start with an M15 chart to review the main structural setup. You can also view the same main setup on an M5 chart to inspect its confirmation timeframe.

An optional faster setup uses M5 market structure with M1 confirmation. This setup must be enabled separately in the inputs.

The run-mode input uses these identifiers:

·        RUN_SCALPING_ONLY: the default main M15/M5 setup.

·        RUN_INTRADAY_ONLY: the optional fast M5/M1 setup.

·        RUN_BOTH: enables both setups.

These input identifiers are retained from development. Follow the M15/M5 or M5/M1 labels on the dashboard when identifying the active setup.

When both setups are enabled, use the MAIN and FAST buttons to choose which setup to review. Each setup maintains its own analysis.

Changing the chart timeframe does not change the underlying analysis timeframes. For example, switching the default setup from an M15 chart to M5 does not convert it into the fast M5/M1 setup.

Fibonacci drawings are displayed on the selected setup’s associated chart timeframes:

·        Main setup: M15 and M5.

·        Fast setup: M5 and M1.

A qualifying active setup must exist before Fibonacci appears. M30 and H1 are not Fibonacci display timeframes for these fixed setups.

Getting Started

1.     Install SMC Insight Pro in your desktop MetaTrader 5 terminal.

2.     Open the symbol you want to analyse and select the M15 chart timeframe.

3.     Attach the indicator and begin with the default inputs.

4.     Keep the terminal connected and allow the required historical price data to load.

5.     Open the Setup page and check the displayed structure and confirmation timeframes.

6.     Monitor the setup status. Fibonacci appears automatically when the qualification rules are met.

7.     Review any confirmed entry, stop-loss, take-profit, and reward-to-risk references before making your own trading decision.

Manual Fibonacci drawing or anchor selection is not required. Opening the Fibonacci page does not create or confirm a setup.

The indicator analyses the chart symbol. It is not a multi-symbol scanner; use separate charts to review additional symbols.

Using the Dashboard

Setup

This page shows the monitored direction, setup status, relevant conditions, impulse checks, and available reference levels.

A watched BUY or SELL direction describes the setup being monitored. It does not, by itself, mean that an entry has been confirmed.

Fibonacci

This page provides information about the current Fibonacci anchors, retracement levels, and setup condition. Use it together with the chart to review the relationship between the impulse and its retracement.

Structure

This page provides a summary of the structure used by the selected setup, including its direction and relevant structural information.

Display Controls

Use the plus and minus buttons to adjust panel zoom. Use the language button to switch between English and Indonesian.

The lower Structure control displays the supporting market-structure drawings. Review hides those supporting drawings while retaining Fibonacci when it is valid and eligible for display.

The chart timeframe and the selected setup still determine which drawings can appear.

Understanding the Setup Process

Searching

The indicator is looking for a structure-based opportunity that meets its rules. No active entry reference is available.

Waiting for Impulse Qualification

A potential structure leg has been identified, but the required impulse conditions are not yet satisfied. A structure break alone does not guarantee that Fibonacci or a confirmed entry will appear.

Waiting for Retracement

A qualifying impulse is available. The indicator is waiting for price to return to the configured retracement area.

Waiting for Confirmation

Price has interacted with the relevant area, but the required closed-candle confirmation or other setup conditions are still pending.

Confirmed BUY or SELL

The configured confirmation and reference-level requirements have been met. The dashboard displays analytical entry, stop-loss, take-profit, and reward-to-risk information.

Invalidated or Expired

The setup has breached an applicable invalidation condition or exceeded its permitted lifetime. Wait for a new qualifying setup rather than continuing to treat the previous one as active.

Reference Outcome

The indicator may record that a take-profit or stop-loss reference was touched. These are observations of reference levels, not records of executed trades.

Automatic Fibonacci Behaviour

Fibonacci is linked to a qualifying structure leg. It is not drawn on every visible price swing.

While a setup remains unconfirmed, its impulse endpoint can update as new structure candles close. This can change the retracement levels and reset the waiting process.

Drawings can disappear when a setup is invalidated, expires, completes, or is replaced, or when the selected chart timeframe does not support the active setup’s Fibonacci display.

The presence of an OTE zone is not an entry confirmation. Wait for the status shown on the Setup page.

The indicator requires closed candles and confirmed pivots for relevant calculations. This introduces confirmation delay. It should not be described as identifying every swing or entry opportunity immediately.

Entry, Stop-Loss, Take-Profit and Reward-to-Risk

Entry ref is the analytical reference associated with a confirmed setup. It is not an instruction to enter at the current market price.

SL ref is calculated using the applicable stop model and buffer settings. TP ref is based on the applicable structural target rules.

The reward-to-risk figure compares the reference target and stop distances, including the indicator’s spread adjustment. It does not include every execution cost, such as commission or slippage.

If the required reference geometry or minimum reward-to-risk condition is not met, a confirmed entry reference may not be issued.

Once issued, the recorded entry, stop-loss, and take-profit references for that signal are retained for tracking. New setups can produce different references.

A displayed structure target or impulse invalidation level before confirmation should not be confused with a complete confirmed trade plan.

Higher-Timeframe Context

H1 and H4 readings provide additional market-structure context.

For the optional fast M5/M1 setup, enabled higher-timeframe filters can affect whether an entry reference is confirmed. These filters are configurable and do not guarantee a successful outcome.

If the required history is unavailable, the dashboard may show a waiting or unavailable-data condition. Allow the terminal to synchronise before interpreting the analysis.

Alerts

Optional popup and sound alerts notify you when qualifying Fibonacci anchors become available.

An anchor notification means that a Fibonacci setup is available for review. It is not an order execution message or a confirmed entry instruction.

Other setup developments should be monitored in the dashboard. This version does not provide a separate popup for every retracement, confirmation, invalidation, or reference outcome.

Historical loading does not replay old setup alerts. Keep MetaTrader 5 running and connected to receive eligible live notifications.

Audit Records

When enabled, CSV exports record setup events, closed-candle data, and session summaries.

Files are saved in the terminal’s shared Common\Files\SMC_AUDIT folder.

The dashboard’s audit counts describe recorded signal references and observed reference outcomes. They are not account trading statistics or verified profitability results.

Outcome tracking uses Bid candle data. If both the stop-loss and take-profit references are touched within the same observed candle, their sequence may be ambiguous. Actual execution can differ because of Ask prices, spreads, slippage, commissions, and broker conditions.

Frequently Asked Questions

Why is Fibonacci not visible?

Check that the selected setup is enabled, sufficient history has loaded, a qualifying setup exists, and you are viewing one of its associated chart timeframes. For the default main setup, use M15 or M5.

Why does the dashboard show BUY or SELL but no entry?

A monitored direction is different from a confirmed setup. Retracement, confirmation, risk geometry, or other requirements may still be pending.

Why are there no signals immediately after installation?

The indicator does not force signals. Available history and current market conditions must satisfy the configured rules.

Why does changing the chart timeframe not change the setup source?

The two setups use fixed analysis pairs: M15/M5 and M5/M1. The chart timeframe controls the view; it does not redefine those analysis pairs.

Does the indicator trade automatically?

No. It provides visual analysis and reference levels only.

Does the indicator detect actual institutional orders?

No. It applies rule-based interpretations of price structure, imbalances, and Fibonacci relationships. These interpretations do not establish the identity or intentions of market participants.

Usage Notes and Support

Begin with the default main M15/M5 setup and familiarise yourself with its status messages before enabling the optional fast setup or changing the qualification rules.

Broker price feeds, available history, spreads, and input settings can produce different observations. Evaluate the indicator on a demo account and on the symbol you intend to analyse.

SMC Insight Pro is an analytical tool. It does not guarantee profitable trades, a particular win rate, or future results.

For support, use the MQL5 product comments or private messaging. Include the product version, symbol, chart timeframe, selected setup, relevant inputs, and a screenshot. If an error occurs, include the corresponding Experts or Journal message.


Prodotti consigliati
AVVISO IMPORTANTE – LICENZA E ATTIVAZIONE RICHIESTE ==================================================== Istruzioni per l'attivazione: Dopo aver completato l'acquisto, contattaci immediatamente per ricevere la tua chiave di licenza, password o dati di attivazione. Senza questi, il software non funzionerà. Siamo qui per garantire un processo di attivazione senza intoppi e assisterti per qualsiasi domanda. --- Volume Delta Profile V2 Enhanced ================================ Strumento Pr

Here   our more valuable tools SMC Trend Trading   ,  Easy SMC Trading  ,  Institutional SMC Architect Volume Analysis Tools  ,  Volume flow Profile  ,  Market volume profile  , FVG with Volume  , Liquidity Heatmap Profile  ,  Volume Spread Analysis The    Liquidity Heatmap   is a sophisticated institutional trading tool designed to reveal where over-leveraged traders are trapped. By calculating estimated liquidation levels based on volume spikes and leverage, this indicator draws a dynamic "h
La Master Edition è uno strumento analitico di livello professionale progettato per visualizzare la struttura del mercato attraverso l'obiettivo del volume e del flusso di denaro. A differenza degli indicatori di volume standard, questo strumento visualizza un Profilo di Volume Giornaliero direttamente sul tuo grafico, permettendoti di vedere esattamente dove si è verificata la scoperta dei prezzi e dove è posizionato il "denaro intelligente". Questa Master Edition è progettata per chiarezza e v
AVVISO IMPORTANTE – RICHIESTI LICENZA E ATTIVAZIONE Istruzioni per l’attivazione: Dopo aver completato l’acquisto, contattaci immediatamente per ricevere la tua chiave di licenza, password o i dettagli di attivazione. Senza questi, il software non funzionerà. Siamo qui per garantire un processo di attivazione fluido e assisterti con qualsiasi domanda. Personalizzazione multilingue Per migliorare la tua esperienza di trading, offriamo una personalizzazione completa del software in dive
TradeAQ
Guo Sheng Zhao
LuoMo Volume & Price Structure 8.98 A multi-function chart indicator for   MetaTrader 4 and MetaTrader 5 , designed to display key volume, volatility, sentiment, and price-structure information directly on the main chart. Main Features Volume and price-based Support & Resistance Volume spike and exhaustion signals ATR volatility expansion alerts Volume Profile with HVN and LVN Bullish and bearish sentiment distribution Developing or fixed POC VAH and VAL levels Supply and Demand zones Volume-wei
Delta Profile Volume
Teresinha Moraes Correia
Technical Description of the Indicator – Delta Profile for MetaTrader 5 The Delta Profile is an indicator developed for MetaTrader 5 focused on detailed analysis of volume flow within a defined range of candles. It organizes and displays information about the imbalance of positive volumes (associated with upward movements) and negative volumes (associated with downward movements) at different price levels. The result is a clear view of the chart points where the highest concentration of trades o
Boom Crash SMC
Israr Hussain Shah
Here   our more valuable tools SMC Trend Trading   ,  Easy SMC Trading  ,  Institutional SMC Architect Volume Analysis Tools  ,  Volume flow Profile  ,  Market volume profile  , FVG with Volume  , Liquidity Heatmap Profile  ,  Volume Spread Analysis Deriv boom and crash index spike killer system you can use it only on m5 timeframe  follow the structure and get signal with alert on phone open trade set sl tp and enjoy easy analysis and trading made simple 
Strumento Avanzato di Analisi del Profilo dei Volumi per MetaTrader 5 Il Kecia Volume Profile Order Finder offre ai trader funzionalità di analisi del profilo dei volumi. Questo indicatore per MT5 combina la visualizzazione del profilo dei volumi con calcoli statistici per aiutare a identificare potenziali opportunità di trading e suggerisce livelli di entrata, stop loss e take profit basati sulla struttura del mercato. Visualizzazione del Profilo di Mercato Trasforma il tuo grafico con visualiz
UPD1 Profile Levels MT5
Vitaliy Kuznetsov
5 (4)
L'indicatore trova i livelli del volume di prezzo massimo e minimo (profilo di mercato) nell'istogramma di lavoro per il numero specificato di barre.   Profilo composito. L'altezza dell'istogramma è completamente automatica e si adatta a qualsiasi strumento e periodo di tempo. Viene utilizzato l'algoritmo dell'autore e non ripete analoghi noti. L'altezza dei due istogrammi è approssimativamente uguale all'altezza media della candela. Smart alert (smart alert) ti aiuta a comunicare il prezzo rela
Was: $249  Now: $99   Market Profile defines a number of day types that can help the trader to determine market behaviour. A key feature is the Value Area, representing the range of price action where 70% of trading took place. Understanding the Value Area can give traders valuable insight into market direction and establish the higher odds trade. It is an excellent addition to any system you may be using. Inspired by Jim Dalton’s book “Mind Over Markets”, this indicator is designed to suit the
Symbol: EURUSD Timeframe: 30 minutes (M30) For other symbols or timeframes, adjust the settings to match the market. Volume Profile POC Breakout builds a volume profile from recent candles, finds the Point of Control (POC) and marks clean breakouts of that level. Each breakout is shown as a complete trade plan with entry, stop loss and three take profit levels, filtered by the higher timeframe trend and rated by a quality score. The indicator does not open trades. It is a visual and analysis to
Here   our more valuable tools SMC Trend Trading   ,  Easy SMC Trading  ,  Institutional SMC Architect Volume Analysis Tools  ,  Volume flow Profile  ,  Market volume profile  , FVG with Volume  , Liquidity Heatmap Profile  ,  Volume Spread Analysis Transform Your Trading with Intelligent Market Insights! The 2025 Spike Killer Dashboard is a powerful MQL5 indicator that combines cutting-edge signal generation with an intuitive crystal dashboard for real-time market analysis. Designed for tra
BoxChart MT5
Evgeny Shevtsov
5 (7)
The market is unfair if only because 10% of participants manage 90% of funds. An ordinary trader has slim changes to stand against these "vultures". This problem can be solved. You just need to be among these 10%, learn to predict their intentions and move with them. Volume is the only preemptive factor that faultlessly works on any timeframe and symbol. First, the volume appears and is accumulated, and only then the price moves. The price moves from one volume to another. Areas of volume accumu
Volume Pressure Pro
Wojciech Jerzy Magda
Volume Pressure Pro See who really controls the market — before the move becomes obvious. Most indicators show you where price has been . Volume Pressure Pro shows you who is winning the battle right now — buyers or sellers. This is not another repainted RSI or MACD clone. It is a proprietary algorithm built from scratch, and its formula remains a trade secret — which is exactly why its signals look like nothing else on your chart. What you get Clear BUY/SELL signals — a green arrow to buy
Binary Rise Fall
Israr Hussain Shah
Here   our more valuable tools SMC Trend Trading   ,  Easy SMC Trading  ,  Institutional SMC Architect Volume Analysis Tools  ,  Volume flow Profile  ,  Market volume profile  , FVG with Volume  , Liquidity Heatmap Profile  ,  Volume Spread Analysis The Fractals_Price indicator is a technical analysis tool that identifies fractal patterns on price charts. Fractals are recurring patterns that signal potential trend reversals or continuation points. This indicator marks both upward and downward
Volume Profile Multiple — Profili di Volume Multipli con Buffer per il Trading Algoritmico Stanco di ridisegnare il Volume Profile blocco per blocco, ricalcolando tutto ogni volta che cambi timeframe? Volume Profile Multiple traccia automaticamente più profili di volume consecutivi sul grafico, rivelando dove si è realmente concentrato l'interesse istituzionale in ogni tratto del mercato — non solo nell'ultimo intervallo visibile. Cosa fa l'indicatore per te L'indicatore suddivide lo storico dei
ONNYX INDICATOR versione 1.14 Indicatore di domanda e offerta per MetaTrader 5 con segnali confermati senza repaint. Rileva swing confermati, adatta l'ampiezza delle zone tramite ATR, mostra la qualità in percentuale e disegna frecce BUY/SELL su candele chiuse. FUNZIONI PRINCIPALI - Zone di domanda e offerta con punteggio percentuale all'interno della zona. - Frecce BUY/SELL ingrandite dopo la chiusura della candela. - Filtro trend EMA e conferma opzionale del rifiuto. - Pannello con trend, live
VibeFox Volume Profile — Volume Profile per MetaTrader 5 VibeFox Volume Profile è un set di strumenti completo di Volume Profile per MetaTrader 5. Costruisce la distribuzione orizzontale del volume scambiato lungo il prezzo, così puoi vedere istantaneamente dove il mercato ha concentrato la maggiore attività, dove ha scambiato poco e quali livelli di prezzo agiranno probabilmente come magneti o barriere. Ogni profilo viene disegnato direttamente sul grafico e controllato da un pannello moderno,
VOLUME PROFILE SAF-XII Analisi Market Profile Professionale per MT5 (L'indicatore ideale per i trader che utilizzano strategie Grid) COS'È IL VOLUME PROFILE? Il Volume Profile è uno strumento istituzionale professionale che visualizza l'attività di trading a specifici livelli di prezzo, a differenza dei tradizionali indicatori di volume che mostrano il volume nel tempo. Rivela DOVE sono avvenuti gli scambi all'interno della finestra temporale scelta, aiutando a identificare: VALUE AREAS (VAH/VA
Risk Control Tool
Israr Hussain Shah
Here   our more valuable tools SMC Trend Trading   ,  Easy SMC Trading  ,  Institutional SMC Architect Volume Analysis Tools  ,  Volume flow Profile  ,  Market volume profile  , FVG with Volume  , Liquidity Heatmap Profile  ,  Volume Spread Analysis Overview (Short Description) A professional risk management indicator that helps traders calculate lot size, risk percentage, and reward ratio in real time. Perfect for Forex, Indices, Gold, and Synthetic Indices traders who want precise control ov
What if you could finally SEE where the market really wants to go? Most traders watch price. Pros watch VOLUME — where the money was actually traded. Volume Profile Fibo Confluence puts that reading right in front of you, in plain language, no jargon. WHAT YOU SEE ON YOUR CHART • The POC, the most-traded price: the market's natural magnet • The value area (VAH / VAL): the "house" where price spends its time • Automatic Fibonacci retracement + the golden pocket • Low-volume nodes
L'indicatore costruisce le quotazioni attuali, che possono essere confrontate con quelle storiche e su questa base fanno una previsione del movimento dei prezzi. L'indicatore ha un campo di testo per una rapida navigazione fino alla data desiderata. Opzioni: Simbolo - selezione del simbolo che visualizzerà l'indicatore; SymbolPeriod - selezione del periodo da cui l'indicatore prenderà i dati; IndicatorColor - colore dell'indicatore; HorisontalShift - spostamento delle virgolette disegnate d
CVD SmoothFlow Pro
Thalles Nascimento De Carvalho
CVD SmoothFlow Pro - Analisi del Volume Illimitata per Qualsiasi Attivo! CVD SmoothFlow Pro è la soluzione definitiva per i trader che cercano un'analisi del volume precisa e illimitata. Utilizzando il calcolo del Cumulative Volume Delta (CVD) con filtraggio avanzato del rumore, la versione Pro offre la flessibilità e la precisione necessarie per operare su qualsiasi strumento finanziario. Cosa offre CVD SmoothFlow Pro? Analisi Chiara : Filtra il rumore di mercato e mette in risalto i movi
Il Volume Profile è uno degli strumenti analitici più potenti utilizzati dai trader professionisti e istituzionali. A differenza dei tradizionali indicatori di volume che mostrano solo quando si sono verificate le transazioni nella parte inferiore dello schermo, il Volume Profile mostra esattamente a quali livelli di prezzo sono avvenute tali transazioni. Questo ti offre una chiara visione a raggi X della struttura del mercato, permettendoti di vedere esattamente dove la smart money (denaro inte
Rilevatore intelligente multistrato di breakout e pullback per MetaTrader 5 "Intelligente. Semplice. Veloce!" Sei stanco di perdere entrate su breakout ad alta probabilità? Passi ore a scansionare più grafici, cercando di allineare i breakout con la direzione del trend e il momentum delle valute — solo per perdere il movimento? Break Pullback risolve tutto questo con un solo indicatore. Cos'è Break Pullback? Break Pullback è un indicatore MetaTrader 5 di livello professionale, progettato speci
Smart trend pro
Israr Hussain Shah
Here   our more valuable tools SMC Trend Trading   ,  Easy SMC Trading  ,  Institutional SMC Architect Volume Analysis Tools  ,  Volume flow Profile  ,  Market volume profile  , FVG with Volume  , Liquidity Heatmap Profile  ,  Volume Spread Analysis Professional trend-following indicator with comprehensive visualization and control panel Key Features: Advanced Trend Detection Reliable Half Trend algorithm for precise trend identification Color-coded trend lines (Blue for bullish, Orange for
Here   our more valuable tools SMC Trend Trading   ,  Easy SMC Trading  ,  Institutional SMC Architect Volume Analysis Tools  ,  Volume flow Profile  ,  Market volume profile  , FVG with Volume  , Liquidity Heatmap Profile  ,  Volume Spread Analysis Boom: Take SELL signals only (price spikes up then crashes) Crash: Take BUY signals only (price drops then spikes up) SL goes beyond the line as labeled Interactive Market Watch Panel : A left-side sidebar showing real-time strength indicators (po
An ICT fair value gap is a trading concept that identifies market imbalances based on a three-candle sequence. The middle candle has a large body while the adjacent candles have upper and lower wicks that do not overlap with the middle candle. This formation suggests that there is an imbalance where buying and selling powers are not equal. Settings Minimum size of FVG (pips) -> FVGs less than the indicated pips will be not be drawn Show touched FVGs Normal FVG color -> color of FVG that hasn't
FREE
Do you use volume in your reading of the market? Certainly many traders use it, and do not imagine operating without it. The Color Histogram Volume Set indicator allows the user to choose the value that he considers interesting to monitor. When you pass this you will have visual confirmation and if you want you will also have the audible alert that is given by the indicator. Of course, there are other ways to try to find a high volume, such as assessing whether the volume is above av
Volume Profile For MT5
Abdelkhabir Yassine Alaoui
Volume Profile VPVR per MT5 Volume Profile VPVR è un indicatore potente e performante per MetaTrader 5, progettato per replicare l'avanzato Volume Profile (Visible Range) direttamente sul grafico. Fornisce una visione approfondita della struttura del mercato, visualizzando le aree in cui si concentra l'attività di trading e aiutando i trader a identificare con precisione i livelli di prezzo chiave. Questo indicatore analizza dinamicamente la distribuzione dei volumi sui diversi livelli di pre
Gli utenti di questo prodotto hanno anche acquistato
Trend Sniper X
Sarvarbek Abduvoxobov
4.9 (41)
Trend Sniper X è un indicatore trend-following multi-timeframe per MetaTrader 5 che aiuta i trader a identificare la direzione del trend e i potenziali punti di inversione con chiarezza e precisione. per MT4: https://www.mql5.com/en/market/product/193245 Informazioni sul prezzo: Il prezzo attuale è promozionale ed è soggetto a modifiche con il rilascio di futuri aggiornamenti e nuove funzionalità. Offerta Bonus: Per ricevere GRATIS l'Auto-Trade Assistant EA per questo indicatore, invia un messa
Smart Trend Trading System — MetaTrader 5 Dopo l'acquisto, inviami un messaggio su MQL5 per ricevere GRATUITAMENTE Smart Universal Expert Advisor, insieme al corso online, al manuale PDF e all'accesso al gruppo privato. STTS riunisce la direzione del trend, i segnali di entrata e uscita, le zone di inversione e i livelli di prezzo importanti direttamente sul grafico. Segui il sistema manualmente oppure collega un EA compatibile separato per eseguire le operazioni automaticamente con le impostazi
SuperScalp Pro
Van Minh Nguyen
4.56 (36)
SuperScalp Pro - Professional Multi-Layer Confluence Scalping System SuperScalp Pro è un indicatore avanzato per lo scalping che migliora il Supertrend classico attraverso diversi filtri intelligenti di conferma. Aiuta a identificare opportunità di Buy/Sell con una probabilità maggiore, riducendo significativamente i falsi segnali. Le frecce Buy e Sell vengono visualizzate direttamente sul grafico, mentre i livelli di Stop Loss e Take Profit basati sull’ATR vengono calcolati automaticamente in t
La leggenda ritorna: Entry Points Pro 10. Il rilancio del leggendario indicatore che per 3 anni è rimasto nella Top-3 del MQL5 Market. Centinaia di recensioni entusiaste (589 su due versioni), migliaia di trader lo usano ogni giorno per operare, 31.000+ download della demo   MT4+MT5 . Ho letto ogni vostra recensione degli ultimi cinque anni — e invece di promesse ho inserito nella versione 10 le risposte. Dall'autore che opera sui mercati dal 1999 e tiene all'onestà, alla propria reputazione e a
Neuro Poseidon MT5
Daria Rezueva
4.75 (52)
Neuro Poseidon is a new indicator by Daria Rezueva. It combines precise trading signals with adaptive TP/SL levels - creating best possible trades as a result! Message me and get  Neuro Poseidon Assistant  as a gift to automize your trading process! What makes it stand out? 1. Proven profitability on all assets and timeframes 2. Only confirmed BUY and SELL signals present on the chart 3. Adaptive TP & SL levels generated by the software for each trade 4. Easy to understand - suitable for al
Adaptive Price Action Engine Acquista un indicatore, ricevi l'EA gratis Analisi Auto-Ottimizzata del Trend e dei Pattern Candlestick Multi-Timeframe I mercati cambiano continuamente e non tutti i pattern di Price Action hanno lo stesso valore in ogni condizione di mercato. Adaptive Price Action Engine è progettato per adattarsi alle condizioni di mercato in continua evoluzione, combinando struttura del trend, analisi Multi-Timeframe, pattern Candlestick e ottimizzazione statistica in un unico fr
Auto Optimized SpeedAngle è un sistema di vettorizzazione del momento di livello istituzionale che elimina l'overfitting ( curve-fitting ) attraverso l'ottimizzazione continua Walk-Forward (WFO). Invece di affidarsi a input statici che si degradano quando i regimi di mercato cambiano, l'indicatore recalibra dinamicamente i suoi parametri utilizzando la validazione Out-of-Sample (OOS), assicurando che i segnali visualizzati rappresentino reali vantaggi statistici anziché anomalie storiche. Quadro
M1 Sniper MT5
Oleg Rodin
5 (7)
M1 SNIPER   è un sistema di indicatori di trading facile da usare. Si tratta di un indicatore a freccia progettato per l'intervallo temporale M1. L'indicatore può essere utilizzato come sistema autonomo per lo scalping sull'intervallo temporale M1 e come parte del tuo sistema di trading esistente. Sebbene questo sistema di trading sia stato progettato specificamente per il trading sull'intervallo temporale M1, può comunque essere utilizzato anche con altri intervalli temporali. Inizialmente ho p
Gann Made Easy è un sistema di trading Forex professionale e facile da usare che si basa sui migliori principi del trading utilizzando la teoria di mr. WD Gann. L'indicatore fornisce segnali ACQUISTA e VENDI accurati, inclusi i livelli di Stop Loss e Take Profit. Puoi fare trading anche in movimento utilizzando le notifiche PUSH. CONTATTAMI DOPO L'ACQUISTO PER RICEVERE GRATUITAMENTE LE ISTRUZIONI DI TRADING E OTTIMI INDICATORI EXTRA! Probabilmente hai già sentito parlare molte volte dei metodi d
ARIPoint
Temirlan Kdyrkhan
1 (4)
ARIPoint is a powerful trading companion designed to generate high-probability entry signals with dynamic TP/SL/DP levels based on volatility. Built-in performance tracking shows win/loss stats, PP1/PP2 hits, and success rates all updated live. Key Features: Buy/Sell signals with adaptive volatility bands Real-time TP/SL/DP levels based on ATR Built-in MA Filter with optional ATR/StdDev volatility Performance stats panel (Success, Profit/Loss, PP1/PP2) Alerts via popup, sound, push, or email Cu
Scalper Vault   è un sistema di scalping professionale che ti fornisce tutto il necessario per scalping di successo. Questo indicatore è un sistema di trading completo che può essere utilizzato dai trader di forex e opzioni binarie. L'intervallo di tempo consigliato è M5. Il sistema fornisce segnali di freccia accurati nella direzione della tendenza. Ti fornisce anche i segnali più alti e più bassi e i livelli di mercato di Gann. Gli indicatori forniscono tutti i tipi di avvisi, comprese le noti
Trend Catcher ind mt5
Ramil Minniakhmetov
5 (18)
INDICATORE TREND CATCHER L'indicatore Trend Catcher analizza i movimenti dei prezzi di mercato, utilizzando una combinazione di indicatori di analisi del trend proprietari dell'autore e personalizzati. Identifica la vera direzione del mercato filtrando il rumore a breve termine e concentrandosi sulla forza del momentum sottostante, sull'espansione della volatilità e sul comportamento della struttura dei prezzi. Utilizza inoltre una combinazione di indicatori personalizzati di smoothing e filtr
Entry In The Zone and SMC Multi Timeframe is a real-time market analysis tool based on Smart Money Concepts (SMC), designed to analyze market structure, price direction, and key trading zones. It supports both Single-Timeframe and Multi-Timeframe Analysis, providing a clearer view of overall market structure across multiple timeframes, with real-time BUY / SELL signals designed with a strict focus on No-Repaint principles. The signals are designed to help filter unclear setups and evaluate tradi
Ciao a tutti i trader! Molti investitori individuali utilizzano script web lenti. Un approccio sistematico è essenziale per un trading redditizio. L'indicatore Astro AI non è semplicemente una visualizzazione su un grafico. Si tratta di una sofisticata rete neurale composta da due agenti che operano direttamente all'interno del terminale. Dettagli tecnici del sistema: 1. Agente 1: Analista (Rete neurale grafica – GNN) Il mercato non è costituito da singole barre di prezzo, ma da una rete di
Divergence Bomber
Ihor Otkydach
4.89 (94)
Ogni acquirente dell’indicatore riceverà inoltre gratuitamente: L’utilità esclusiva “Bomber Utility”, che gestisce automaticamente ogni operazione, imposta i livelli di Stop Loss e Take Profit e chiude le posizioni secondo le regole della strategia I file di configurazione (set file) per adattare l’indicatore a diversi asset I set file per configurare il Bomber Utility in tre modalità: “Rischio Minimo”, “Rischio Bilanciato” e “Strategia di Attesa” Una guida video passo-passo per installare, con
Unix Scalper
Issam Kassas
4 (4)
Unix Scalper — MetaTrader 5 Dopo l'acquisto, inviami un messaggio su MQL5 per ricevere GRATUITAMENTE Smart Universal Expert Advisor, insieme al corso online, al manuale PDF e all'accesso al gruppo privato. Individua il setup. Esamina il piano. Scegli come operare. UNIX Scalper riunisce analisi di mercato, indicazioni BUY/SELL/WAIT e livelli Entry, Stop Loss, TP1 e TP2 in un unico pannello organizzato. VISUALIZZA IL SEGNALE E IL PIANO • Indicazioni chiare: BUY, SELL o WAIT. • Livelli definiti: E
Volatility Master for MetaTrader is a real-time dashboard tool that scans up to  50 symbols  to identify high-volatility , trending markets instantly. With bullish/bearish signals, customizable alerts, and a user-friendly interface, it helps you avoid range-bound conditions and focus on high-probability trades. Clarity leads to confidence. Trade confidently and protect your capital effectively with this powerful dashboard. We don't offer free or bonus indicators in exchange of reviews from you.
Quantum TrendPulse
Bogdan Ion Puscasu
5 (26)
Ecco   Quantum TrendPulse   , lo strumento di trading definitivo che combina la potenza di   SuperTrend   ,   RSI   e   Stocastico   in un unico indicatore completo per massimizzare il tuo potenziale di trading. Progettato per i trader che cercano precisione ed efficienza, questo indicatore ti aiuta a identificare con sicurezza le tendenze di mercato, i cambiamenti di momentum e i punti di entrata e uscita ottimali. Caratteristiche principali: Integrazione SuperTrend:   segui facilmente l'andame
Presentazione       Quantum Breakout PRO   , l'innovativo indicatore MQL5 che sta trasformando il modo in cui scambi le zone di breakout! Sviluppato da un team di trader esperti con un'esperienza di trading di oltre 13 anni,       Quantum Breakout PRO       è progettato per spingere il tuo viaggio di trading a nuovi livelli con la sua strategia innovativa e dinamica della zona di breakout. Quantum Breakout Indicator ti fornirà frecce di segnalazione sulle zone di breakout con 5 zone target di
Atomic Analyst MT5
Issam Kassas
4.48 (62)
Atomic Analyst — MetaTrader 5 Dopo l'acquisto, inviami un messaggio su MQL5 per ricevere GRATUITAMENTE Smart Universal Expert Advisor, insieme al corso online, al manuale PDF e all'accesso al gruppo privato. Atomic Analyst riunisce l’azione del prezzo, la direzione del trend, i segnali di entrata e uscita, lo Stop Loss e diversi livelli di Take Profit direttamente sul grafico. INDIVIDUA IL SEGNALE. COMPRENDI IL CONTESTO OPERATIVO. Atomic Analyst organizza la sua analisi in informazioni visive ch
PainX GainX Blue Spike Fusion AI Advanced Synthetic Index Spike Detection Indicator for MetaTrader 5 Discover potential spike setups with a clear, organized, and professional trading interface. PainX GainX Blue Spike Fusion AI is a specialized indicator designed for traders who monitor synthetic indices and want a structured way to observe potential price spike opportunities. The indicator combines signal monitoring, market-condition analysis, visual alerts, and event tracking in one convenient
PZ Divergence Trading MT5
PZ TRADING SLU
3.71 (7)
Unlock hidden profits: accurate divergence trading for all markets Tricky to find and scarce in frequency, divergences are one of the most reliable trading scenarios. This indicator finds and scans for regular and hidden divergences automatically using your favourite oscillator. [ Installation Guide | Update Guide | Troubleshooting | FAQ | All Products  ] Easy to trade Finds regular and hidden divergences Supports many well known oscillators Implements trading signals based on breakouts Displays
RelicusRoad Pro MT5
Relicus LLC
4.96 (25)
Basta andare a intuito nei tuoi trade. Sai quando entrare, dove uscire e da che parte va il mercato, tutto su un solo grafico. RelicusRoad Pro riunisce quasi venti strumenti in un unico indicatore, e attivi quelli che si adattano al tuo modo di operare. Ingressi chiari. Uscite chiare. Un piano su ogni grafico. Ti suona familiare? Compri, e un minuto dopo il prezzo ti va contro. Chiudi troppo presto, poi guardi il movimento proseguire senza di te. Cinque indicatori sul grafico, cinque risposte di
Quantum Direction è un indicatore professionale di trend following progettato per identificare la direzione del mercato, rilevare i cambiamenti iniziali del trend e fornire segnali filtrati di ingresso e uscita. Questo indicatore include gratuitamente Quantum Trade Assistant , uno strumento professionale per la gestione delle operazioni disponibile sul MQL5 Market. Può collegarsi direttamente a Quantum Direction e aprire automaticamente le operazioni quando appare un segnale valido, oppure chiud
OrderFlux – Indicatore Order Flow e Footprint per MetaTrader 5 OrderFlux è un indicatore professionale di flusso di ordini (Order Flow) e footprint per MetaTrader 5. Apre ogni singola candela e rivela cosa sta succedendo al suo interno: il volume scambiato ad ogni livello di prezzo, separato in compratori e venditori aggressivi. Da questi dati in tick, viene costruito in tempo reale un grafico Footprint completo, che include Delta, Imbalance, Volume Profile e Market Profile . Un grafico standard
Power Candles MT5
Daniel Stein
4.58 (12)
Power Candles V3 - Indicatore di forza ad ottimizzazione automatica Power Candles V3 trasforma la forza delle valute e degli strumenti in un piano di trading attuabile su ogni grafico a cui è collegato. Invece di limitarsi a colorare le candele, esegue un'auto-ottimizzazione in tempo reale in background e ti fornisce i migliori valori di Stop Loss, Take Profit e soglia di segnale per il simbolo che hai davanti. Basta un clic per adottarlo nel trading live: i raggi di ingresso, Stop Loss e Take P
FX Trend MT5 NG
Daniel Stein
5 (6)
FX Trend NG: La Nuova Generazione di Intelligenza di Trend Multi-Mercato Panoramica FX Trend NG è uno strumento professionale di analisi del trend multi-timeframe e monitoraggio dei mercati. Ti consente di comprendere la struttura completa del mercato in pochi secondi. Invece di passare tra numerosi grafici, puoi identificare immediatamente quali strumenti sono in trend, dove il momentum sta diminuendo e dove esiste un forte allineamento tra i timeframe. Offerta di Lancio – Ottieni FX Trend NG
IX Power MT5
Daniel Stein
4.92 (13)
IX Power: Scopri approfondimenti di mercato per indici, materie prime, criptovalute e forex Panoramica IX Power è uno strumento versatile progettato per analizzare la forza di indici, materie prime, criptovalute e simboli forex. Mentre FX Power offre la massima precisione per le coppie di valute utilizzando i dati di tutte le coppie disponibili, IX Power si concentra esclusivamente sui dati di mercato del simbolo sottostante. Questo rende IX Power una scelta eccellente per mercati non correlat
M1 Quantum MT5
Hamed Dehgani
4.2 (10)
Segnali di Trading Live con M1 Quantum: Segnale   (Operazione eseguita automaticamente dal Quantum Trade Assistant , incluso gratuitamente con questo prodotto.) Ultime notizie: La versione 1.64 è stata rilasciata. Ora tutte le operazioni hanno uno Stop Loss posizionato dietro le relative zone di Supporto/Resistenza. Anche la funzione Smart Close è stata migliorata per aumentare le prestazioni dell'EA in questa versione. Dal 9 agosto, il segnale live è in esecuzione sulla versione 1.64. Piano pr
CRT Pro is a complete Candle Range Theory toolkit for MetaTrader 5. It finds the CRT model on up to three timeframes and adds the tools needed to read it: higher-timeframe candles, structure shifts, fair value gaps, liquidity sweeps, a bias table and SSMT divergence. Every module can be switched on or off. 1. CRT Model A CRT model is built from two candles of the chosen CRT timeframe. C1 is the range candle. C2 is the sweep candle: it takes the high or the low of C1 and closes back inside the
Altri dall’autore
Eddy Candle Pulse — Smart Candle Countdown Timer for MT5 Eddy Candle Pulse is a lightweight and easy-to-use candle countdown indicator designed for MetaTrader 5. It displays the remaining time before the current candlestick closes, helping traders monitor candle timing directly on their trading charts. With a clean and minimalistic interface, Eddy Candle Pulse keeps the countdown visible near the current market price without interfering with candlestick analysis. Whether you trade Forex, Gold (X
FREE
Filtro:
Nessuna recensione
Rispondi alla recensione