CISD Detector MTF
- Индикаторы
-
Ravi Shakya
 I’m Ravi Shakya, an MT5 developer with 5 years of trading experience in NEPSE and Forex. I use Smart Money Concepts (SMC) and price action to create simple and useful trading indicators, tools, and Expert Advisors.
 - Версия: 1.7
- Активации: 10
In Smart Money Concepts (SMC) and ICT methodology, a Change in State of Delivery (CISD) marks the moment price stops delivering in one direction and starts delivering in the other. It is often the first confirmation of a market structure shift (MSS) or change of character (CHoCH), and it usually appears before a classic break of structure (BOS) forms. This indicator detects CISD objectively on any symbol and timeframe, and shows the delivery state across eight timeframes at once.
How it works
The indicator tracks the current order flow (bullish or bearish delivery) and the swing extreme that price is building. For each new extreme, it identifies the sequence of candles that delivered price there and anchors a level at the opening price of that sequence. When a candle closes back through this level, delivery has changed state:
- Bullish CISD: price closes above the opening price of the bearish candle sequence that created the latest low. Delivery shifts from sell-side to buy-side.
- Bearish CISD: price closes below the opening price of the bullish candle sequence that created the latest high. Delivery shifts from buy-side to sell-side.
After each CISD, the indicator switches state and begins tracking the next level in the new direction.
Features
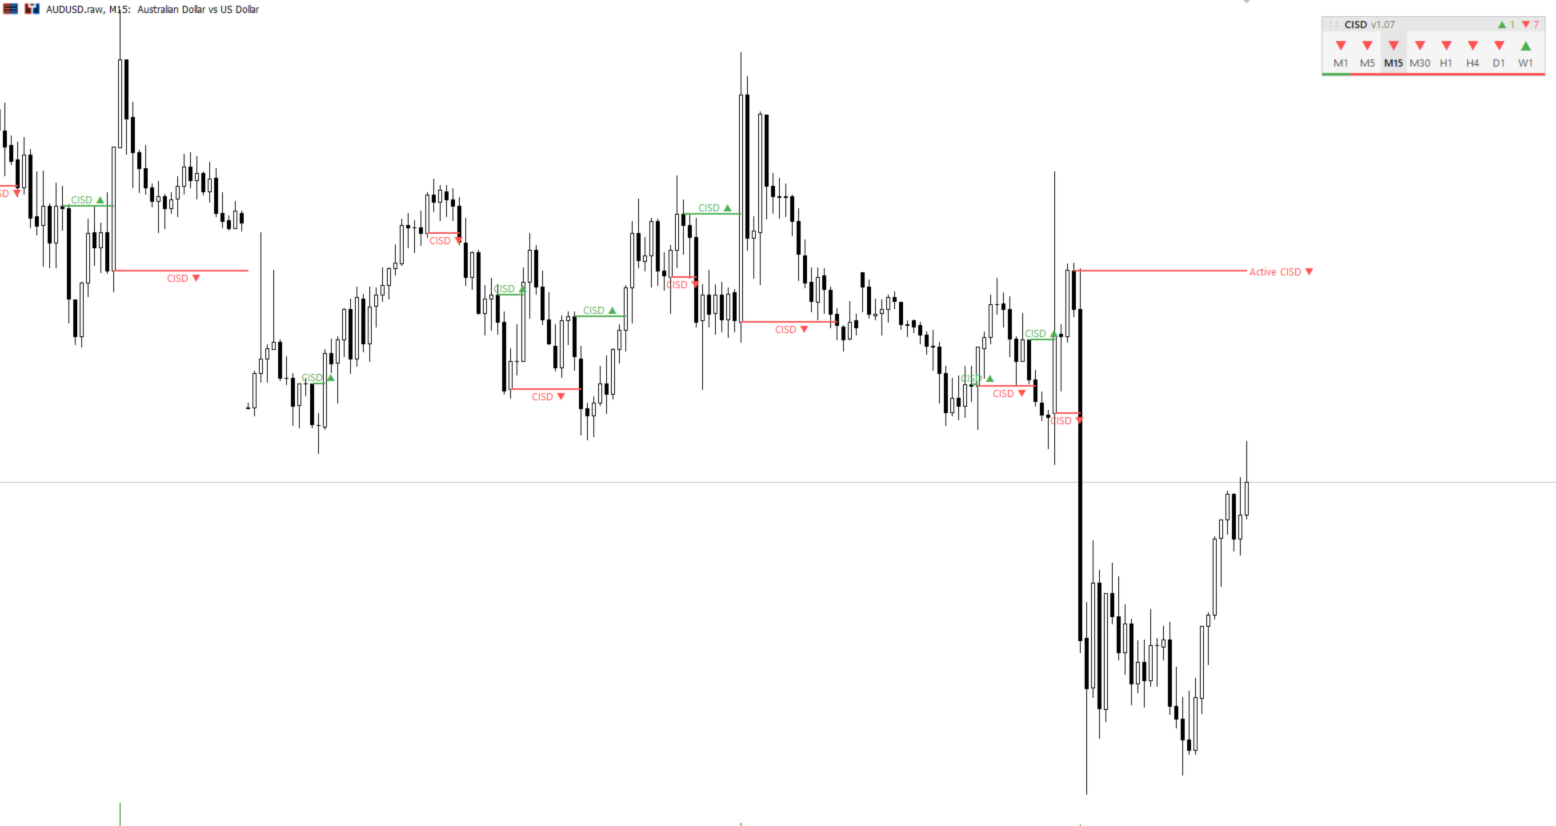
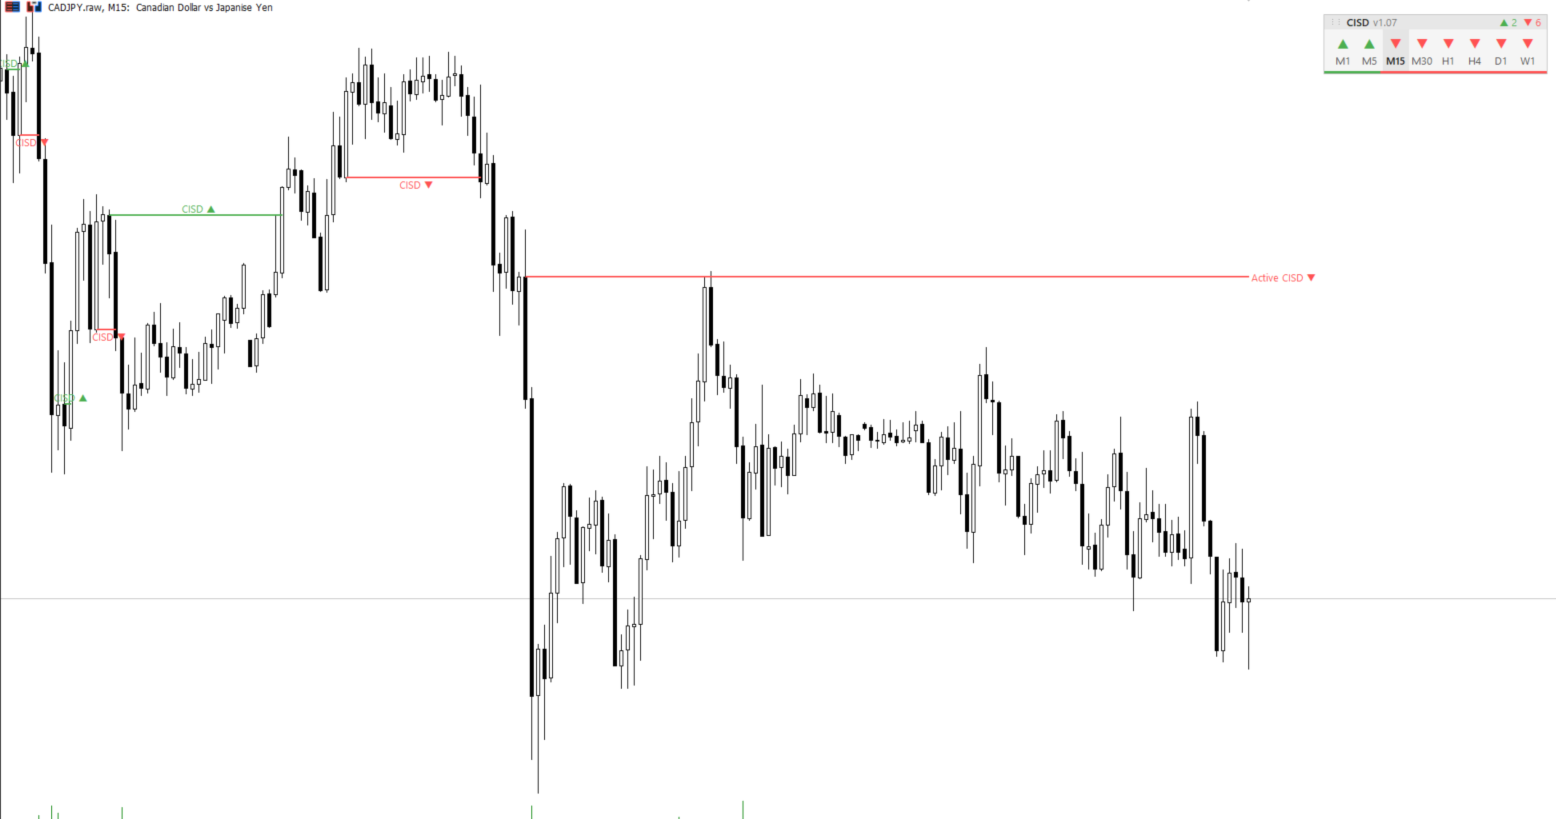
- Confirmed CISD levels: every triggered CISD is drawn as a horizontal level from its anchor candle to the confirmation candle, labelled CISD with an up or down arrow.
- Active CISD level: the level that would confirm the next change in state is always shown on the chart and updates live as the swing extends.
- Multi-timeframe strip: a compact panel shows the CISD state on M1, M5, M15, M30, H1, H4, D1 and W1. It includes a bullish/bearish count, a bias meter and a highlight on the current chart timeframe. Useful for top-down analysis and reading higher timeframe (HTF) bias against lower timeframe (LTF) execution.
- Draggable panel: move the strip anywhere on the chart; its position is remembered across timeframe changes.
- Adaptive design: the panel adjusts its colours to dark or light chart themes.
- Signal filter: show all signals, buy signals only, sell signals only, or hide them.
- Notifications: terminal popup, mobile push and email, triggered either on the live candle or only on candle close.
- Clean chart: optional automatic grid hiding and a limit on how many historical levels are displayed.
How traders use it
CISD is a confirmation tool. It is typically combined with other Smart Money Concepts, which this indicator does not draw itself:
- After a liquidity sweep (buy-side or sell-side liquidity raid, stop hunt or Judas swing), wait for a CISD in the opposite direction as confirmation of the reversal.
- When price reaches a point of interest (POI) such as an order block, breaker block, fair value gap (FVG), or premium/discount zone, use CISD on a lower timeframe as the entry trigger.
- Align lower timeframe CISD signals with higher timeframe delivery shown on the strip, for example taking only bullish CISD on M5 while H1 and H4 are bullish.
- Use the CISD level after displacement as a reference for invalidation and stop placement.
- Many traders focus on CISD during the London and New York killzones and within the Power of Three (accumulation, manipulation, distribution) model.
Input parameters
Display
- Signal Direction: All Signals / Buy Signals Only / Sell Signals Only / Hidden
- Limit Signal History: limit the number of historical levels shown
- Signals to Keep: number of levels kept when the limit is on
- Line Extension (bars): extend confirmed levels to the right
- Show Signal Text: show or hide the CISD labels
Diagnostics
- Show Swing Extreme Dots: plot the swing extreme being tracked
Timeframe Strip
- Show Timeframe Strip: show or hide the multi-timeframe panel
- Strip Corner: Upper Right / Right Center / Lower Right / Lower Left
- Strip Scale: Extra Small / Small / Medium / Large
Notifications
- Notify When: Disabled / On Signal (live candle) / On Candle Close
- Terminal Popup, Mobile Push, Email: choose the delivery channels
Chart and Performance
- Calculation Depth: number of bars to calculate (0 = full history)
- Strip History Depth: bars loaded per timeframe for the strip
- Hide Chart Grid: hide the chart grid while the indicator is attached
Notes
- Levels drawn on closed candles are final. On the live candle, a CISD can appear and disappear until the candle closes. Use "On Candle Close" notifications for confirmed signals only.
- The strip needs price history for each timeframe. On first load, a timeframe may show as loading until the terminal downloads its data.
- Daily and weekly states follow your broker's server time.
- Works on all symbols: forex, gold, silver, indices, crypto and more.
- This is an analysis tool. It does not open or manage trades and does not guarantee any trading result.