Fractal Trend Channel
- Индикаторы
- Версия: 1.0
- Активации: 5

# Fractal Trend Channel - Structural channel from confirmed swings
*Category: Trend | Difficulty: beginner | Window: chart window (overlaid on price) | Markets: Universal (Forex, indices, commodities, crypto, stocks) | Suggested timeframes: M15, M30, H1, H4, D1*
## Short description
> Step channel built from the last confirmed fractal swings, with a midline coloured by market structure: higher highs and lows, lower highs and lows, or mixed structure.
### Overview
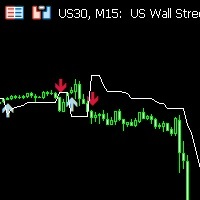
Reading structure through highs and lows is the foundation of price action, but doing it by eye across twenty different charts is slow and subjective. Fractal Trend Channel automates it without inventing anything: it locates swings with the classic fractal definition, a bar whose extreme exceeds that of the N bars on its left and on its right, and uses them to draw a step channel. The upper line reports the last confirmed swing high, the lower line the last swing low. The midline changes colour by comparing the last two swings of each kind: green when both the high and the low have risen, red when both have fallen, amber in all mixed cases that signal a sideways phase or a transition.
### How the calculation works
1. Every bar is tested as a swing candidate by comparing it with InpWing bars on its left and InpWing bars on its right.
2. The left comparison is strict and the right one permissive: with identical extremes the more recent swing prevails, avoiding duplicate signals.
3. A swing is confirmed only once all InpWing bars to its right have closed, so the level appears on the chart with that delay and is never moved afterwards.
4. The channel lines hold the last confirmed value until the next swing, producing the step appearance.
5. The previous state is stored in calculation buffers, so recalculating an already processed bar never alters the history already printed.
### How to use it
- Treat the upper line as active resistance and the lower one as active support: they are levels the market actually tested, not projections.
- The midline colour is the context filter: on green look only for longs, on red only for shorts, on amber stand aside or trade the range.
- A break of the upper line while the midline is already green is a continuation; the same break with an amber midline is often a false signal.
- The channel width, the distance between the two lines, is a natural risk measure: a stop placed inside the channel gets hit by ordinary noise.
- With InpUseWicks set to false the channel ignores the wicks and follows the bodies: better suited to markets with long stop hunting tails.
### Who it is for and on which timeframes
It is the right tool for anyone studying price action and market structure who wants to remove subjectivity from swing identification. It works well on every timeframe from M15 up; below M15 swings become too frequent and the channel loses meaning. It is especially useful for traders monitoring many instruments in the same session, because the midline colour makes a chart structural state readable in one second. Given its conceptual simplicity it also suits traders with limited technical analysis experience.
### Practical example of reading a signal
On GBPUSD H4 the midline is green: the last swing high sits at 1.2740, above the previous one, and the last swing low at 1.2610, also higher. Price falls towards 1.2620, leans just above the swing low and turns back up. This is the classic continuation entry: structure was not violated, the stop goes below 1.2610 and the natural first target is the upper line at 1.2740. Had price instead closed below 1.2610, on confirmation of the new swing the midline would have turned amber, signalling that the bullish structure had broken.
## Input parameters
| Parameter | Default | Description |
|---|---|---|
| `InpWing` | 3 | Number of bars required on the right and on the left for a bar to be recognised as a swing. Low values generate many minor swings, high values isolate only the major turning points. Raising it also raises the confirmation delay. |
| `InpUseWicks` | true | With true swings are computed on highs and lows including wicks; with false on candle bodies only, filtering out stop hunting excursions. |
## Advantages / strengths
- Turns a reading that normally depends on the observer eye, structure by highs and lows, into something objective and repeatable.
- No repaint: a drawn level is never moved or deleted by subsequent bars.
- Only two parameters: it takes minutes to learn and requires no optimisation.
- The levels produced are points where the market actually turned, hence useful as references for stops and targets too.
## Limitations and warnings
- Levels appear with a fixed delay of InpWing bars: this is the unavoidable price paid for not repainting.
- In strongly sideways markets the midline stays amber for long stretches and the indicator offers no operational guidance.
- After a major gap the first confirmed swing may sit far from price, leaving the channel temporarily wide and of little use.
- It does not distinguish major from marginal swings: two swings of the same size carry equal weight.
**No repaint:** values printed on a closed bar are never modified afterwards.
**Disclaimer.** This product is a technical analysis tool, not an automated trading system, and it offers no profit guarantee whatsoever. Financial markets carry the risk of total loss of the invested capital. Past performance is not indicative of future results. Every signal must be confirmed with your own analysis, a money management plan and prior testing on a demo account. The author is not responsible for trading decisions taken on the basis of this indicator.
## Suggested tags / keywords for MQL5
`price action`, `market structure`, `swing`, `fractal`, `support resistance`, `channel`, `no repaint`, `trend`