Momentum Entropy Filter
- Индикаторы
- Версия: 1.0
- Активации: 5

# Momentum Entropy Filter - Order versus randomness in thrusts
*Category: Momentum | Difficulty: advanced | Window: separate window below the chart | Markets: Universal (Forex, indices, commodities, crypto, stocks) | Suggested timeframes: M30, H1, H4, D1*
## Short description
> Computes the Shannon entropy of the recent momentum distribution and converts it into an order score from 0 to 100. It separates markets with recurring structure from those without regularity.
### Overview
Shannon entropy measures how much uncertainty a distribution contains: it is maximal when all outcomes are equally likely and minimal when a single one dominates. Applied to the recent momentum distribution it answers a very concrete question: do this market thrusts concentrate into a few recurring modes, or are they spread uniformly as they would be in a structureless process? Momentum Entropy Filter splits the window momentum values into five classes defined by their own dispersion, computes the entropy of the resulting distribution and converts it into an order score. High values describe a market with concentrated behaviour and therefore more describable by any model; low values describe thrusts spread without any recognisable regularity.
### How the calculation works
1. Raw momentum over InpMomPeriod bars is computed for every bar and stored in a working buffer.
2. Over the InpWindow window the mean and standard deviation of that series are estimated, defining the boundaries of the five classes.
3. The classes are bounded at minus one and a half, minus a half, plus a half and plus one and a half standard deviations from the mean: the partition self-adapts to volatility.
4. The number of values falling into each class is counted and the Shannon entropy of the observed distribution is computed.
5. The entropy is divided by its own maximum value, corresponding to a uniform distribution over the five classes.
6. The order score is one hundred minus the relative entropy in percentage terms: zero means maximum uncertainty, one hundred a fully concentrated distribution.
### How to use it
- Use it as an admission filter: above the high threshold the market has recognisable structure and applying a model is worthwhile, below the low one abstaining is wiser.
- High order does not indicate direction: it can arise from a concentration of bullish thrusts, of bearish ones, or from prolonged stillness.
- A rapid fall in the score signals the market is changing behaviour, often before price shows it.
- Always pair it with a directional indicator: alone it says whether the market is describable, not what it will do.
- Compare the score across instruments to choose where to apply a system that requires regularity.
### Who it is for and on which timeframes
It targets system developers who need an objective criterion for deciding when to switch systems off, and quantitative traders used to thinking in terms of distributions. It works from M30 to D1: below that threshold microstructure dominates the momentum distribution and the score loses meaning. It is not for traders looking for operational signals, because it provides none. Its value lies entirely in the preliminary decision of whether to trade that market at that moment.
### Practical example of reading a signal
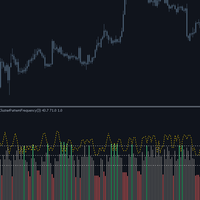
A trader runs a continuation system on four instruments. On three of them the order score oscillates between 35 and 45, above the high threshold: the system stays active. On the fourth the score has fallen to 9, in the red zone, after a phase change following a central bank announcement: thrusts have spread almost uniformly across all classes, the typical behaviour of a memoryless market. The system on that symbol is switched off. Over the next three weeks that instrument produces a string of false signals that would have eroded capital, while the other three keep working normally.
## Input parameters
| Parameter | Default | Description |
|---|---|---|
| `InpMomPeriod` | 5 | Horizon of the momentum whose distribution is studied. Short horizons describe microstructure, long ones underlying behaviour. |
| `InpWindow` | 100 | Number of observations the distribution is built on. Below 60 the five classes hold too few values and entropy becomes unstable. |
| `InpSignalPeriod` | 10 | Period of the signal average, useful because the raw score can be fairly jumpy. |
| `InpHighOrder` | 40.0 | Score beyond which the market is deemed structured and the histogram coloured green. |
| `InpLowOrder` | 15.0 | Score below which the market is deemed disordered and the histogram coloured red. If the two thresholds are inverted by mistake, the indicator reorders them itself. |
| `InpAppliedPrice` | PRICE_CLOSE | Price momentum is computed on. |
## Advantages / strengths
- It applies a rigorous information theory measure to a practical problem, knowing when a market is describable.
- The class partition adapts automatically to current volatility, so it needs no per-instrument calibration.
- It is complementary to any other indicator: it answers a question no directional oscillator asks.
- No repaint and explicit handling of degenerate cases, such as a zero variance distribution.
## Limitations and warnings
- It provides no directional information at all: used alone it is completely inoperable.
- Entropy estimated on one hundred observations across five classes carries a non-negligible estimation error.
- The number of classes is fixed at five by design: a reasonable compromise but not optimal for every market.
- It requires a minimum grasp of the entropy concept, otherwise the score risks being read as trend strength, which it is not.
**No repaint:** values printed on a closed bar are never modified afterwards.
**Disclaimer.** This product is a technical analysis tool, not an automated trading system, and it offers no profit guarantee whatsoever. Financial markets carry the risk of total loss of the invested capital. Past performance is not indicative of future results. Every signal must be confirmed with your own analysis, a money management plan and prior testing on a demo account. The author is not responsible for trading decisions taken on the basis of this indicator.
## Suggested tags / keywords for MQL5
`entropy`, `information theory`, `momentum`, `regime`, `market state`, `system filter`, `no repaint`, `statistics`