Red Indicator Quant Atlas

Red Indicator by Quant Atlas

Creator: https://www.quant-atlas.com/

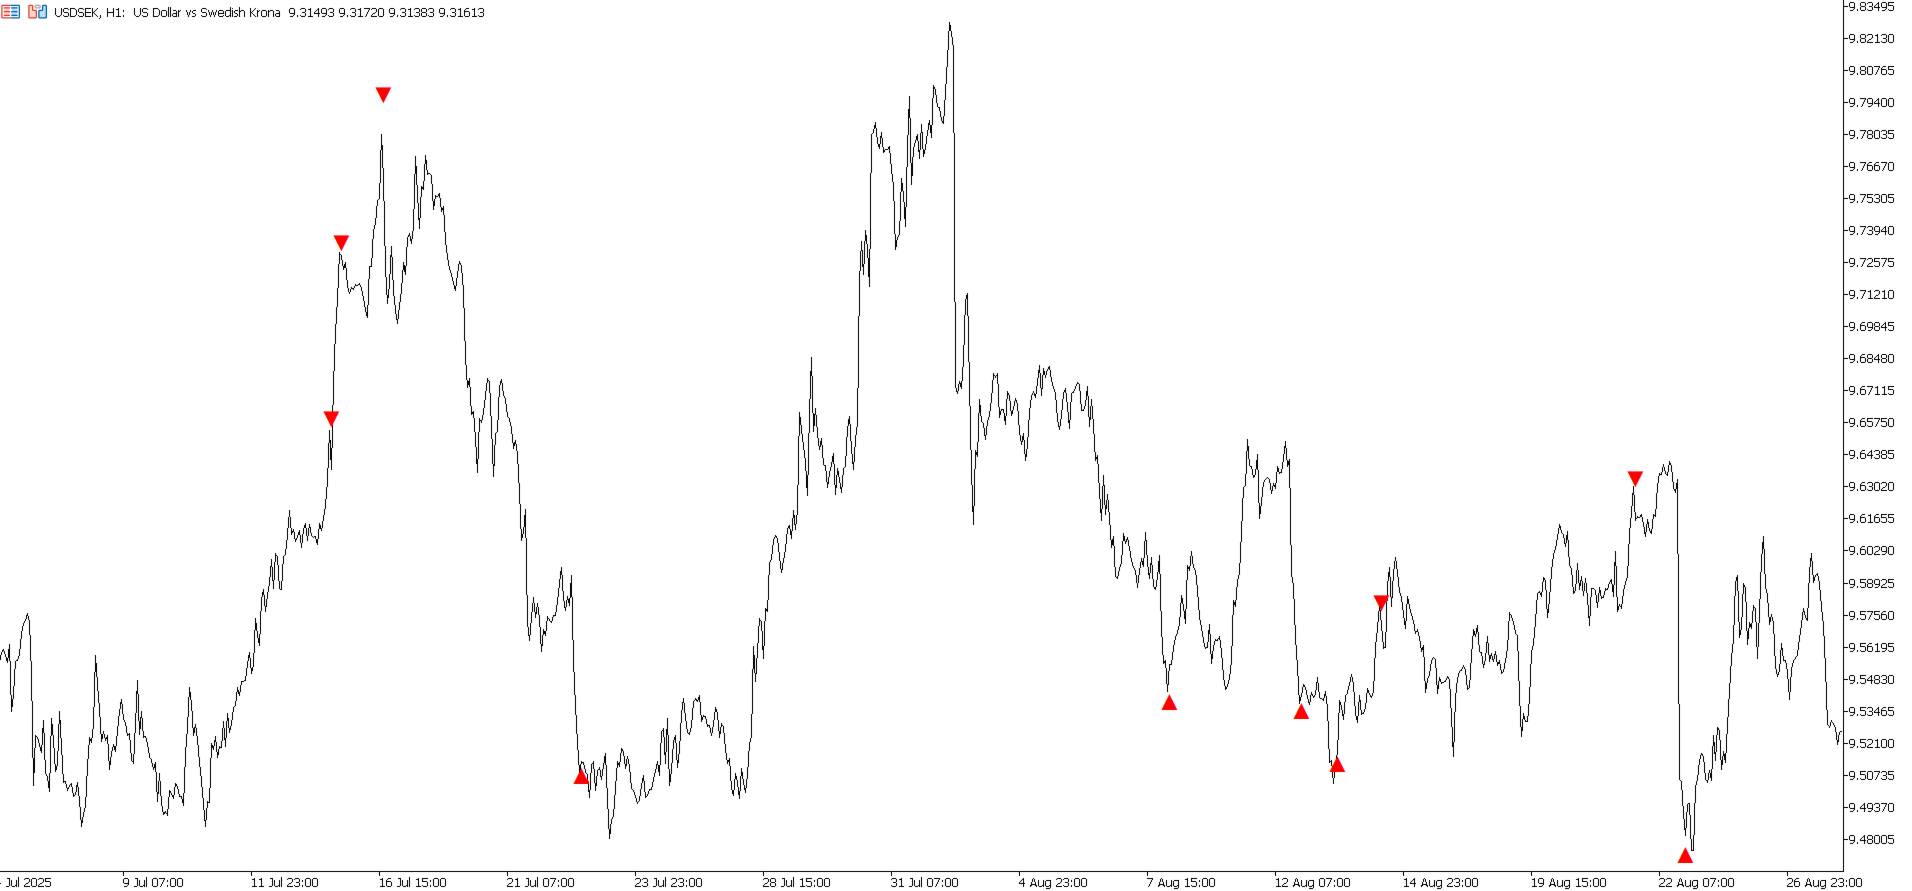
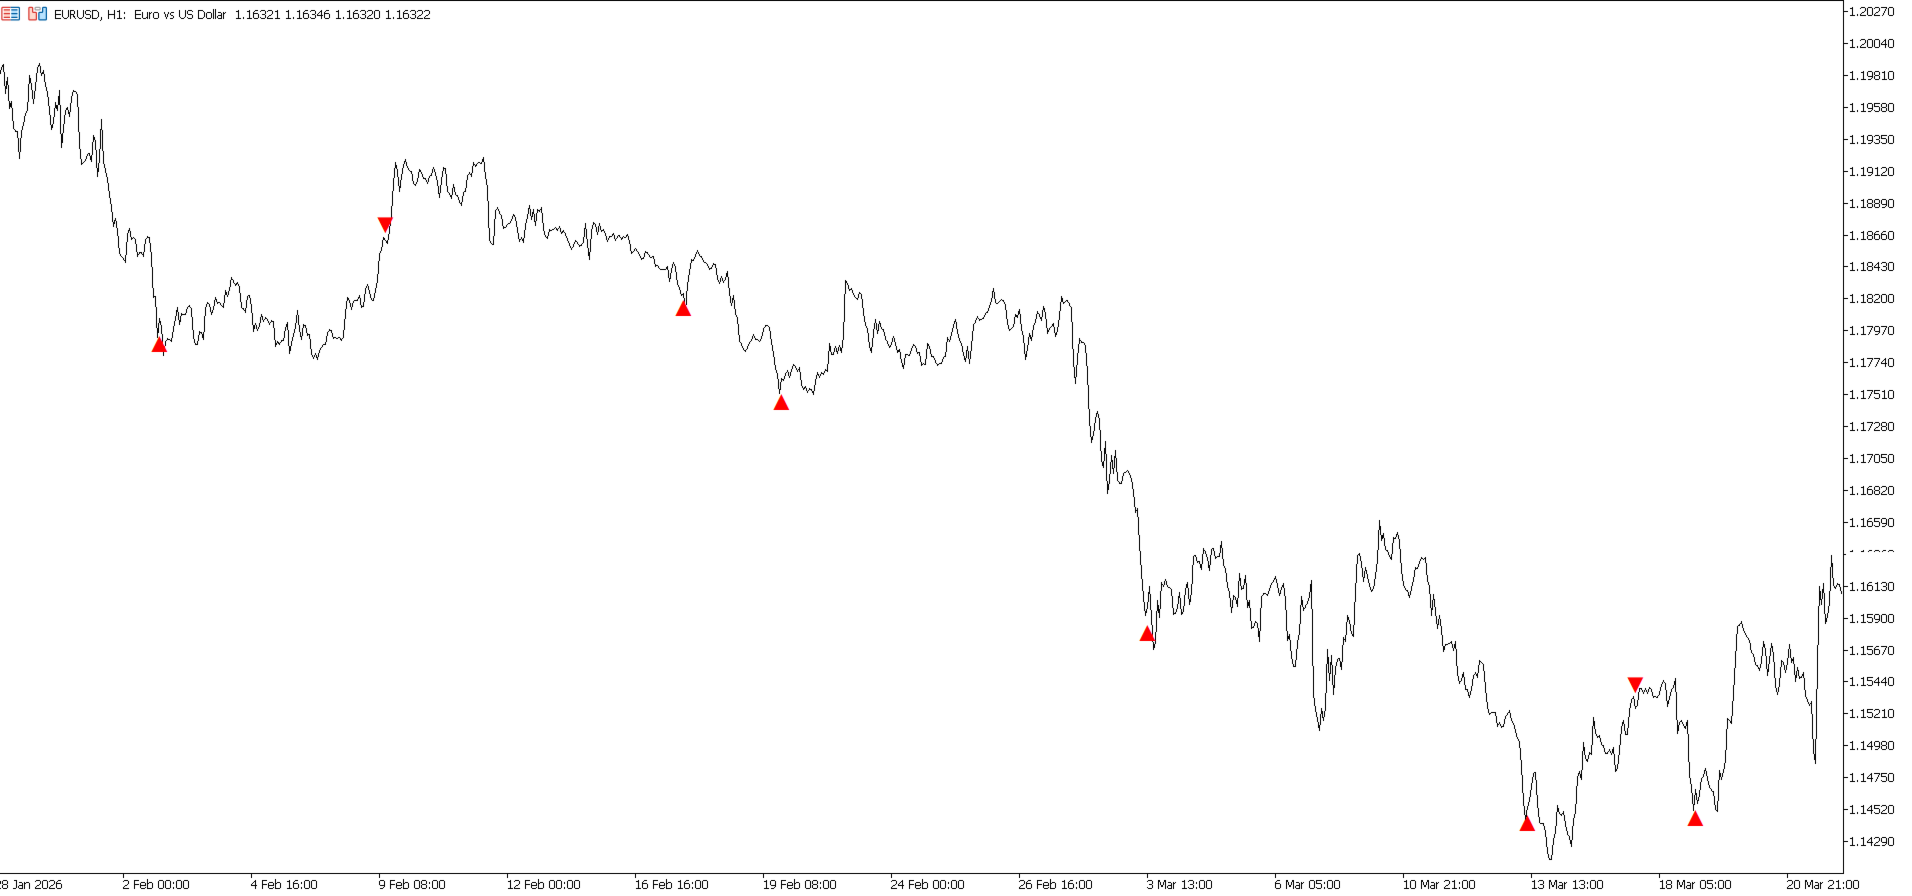
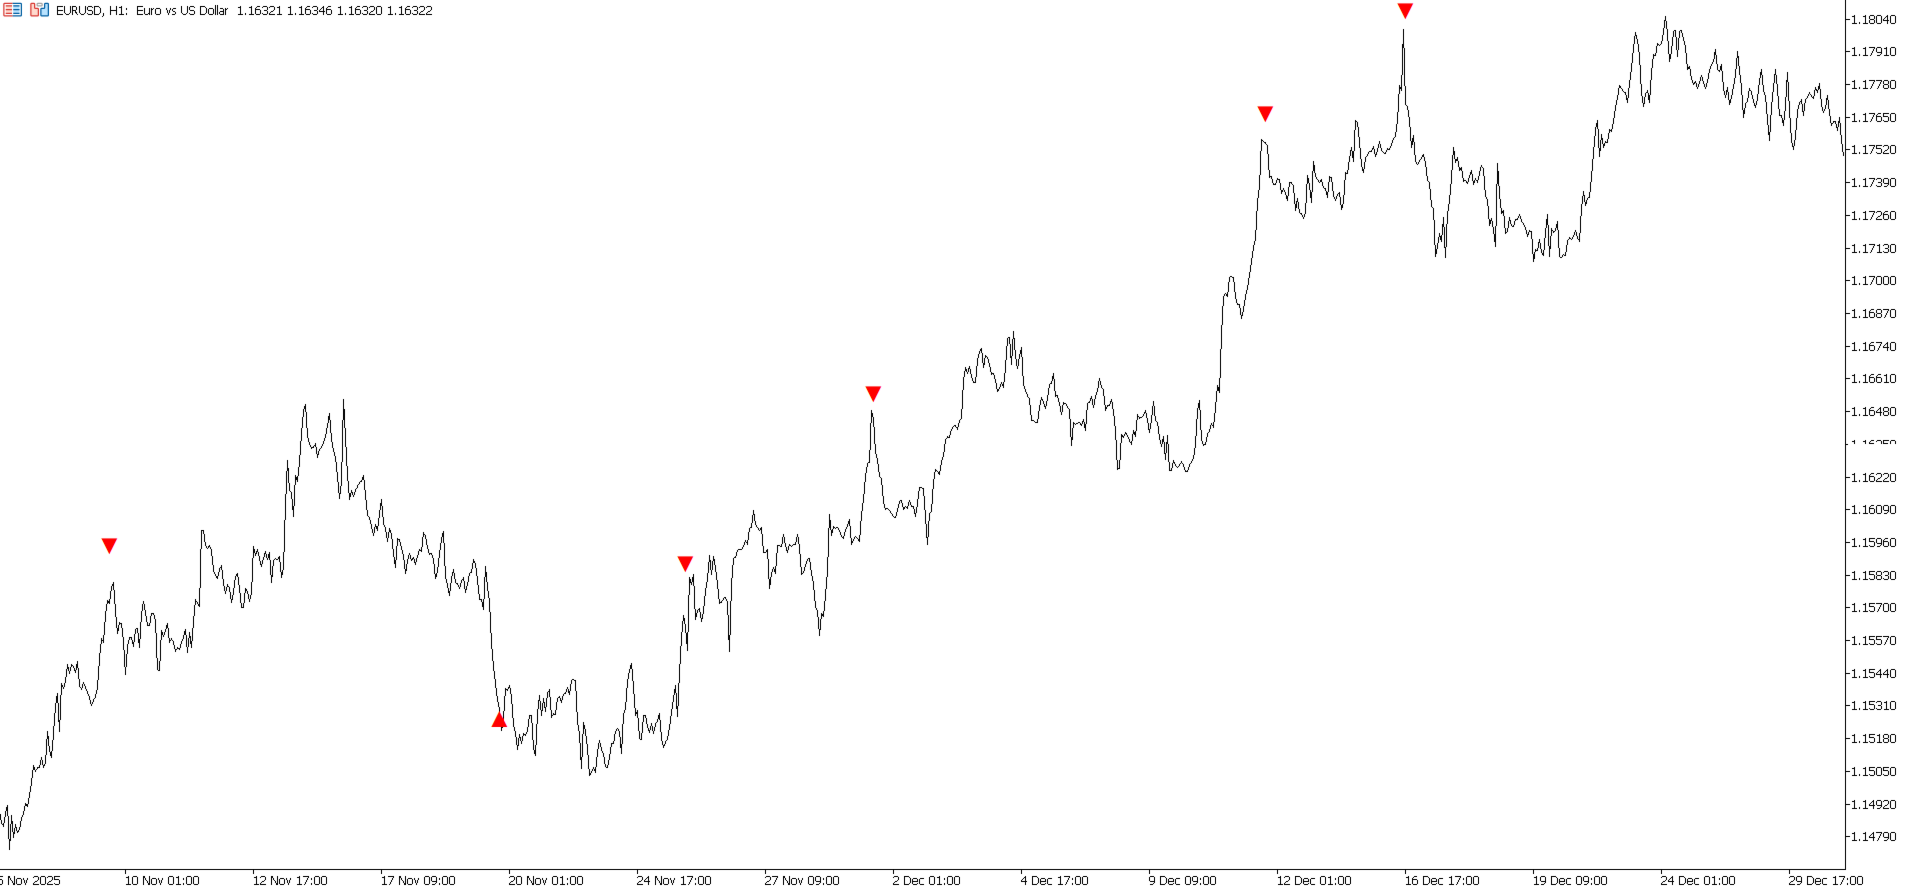
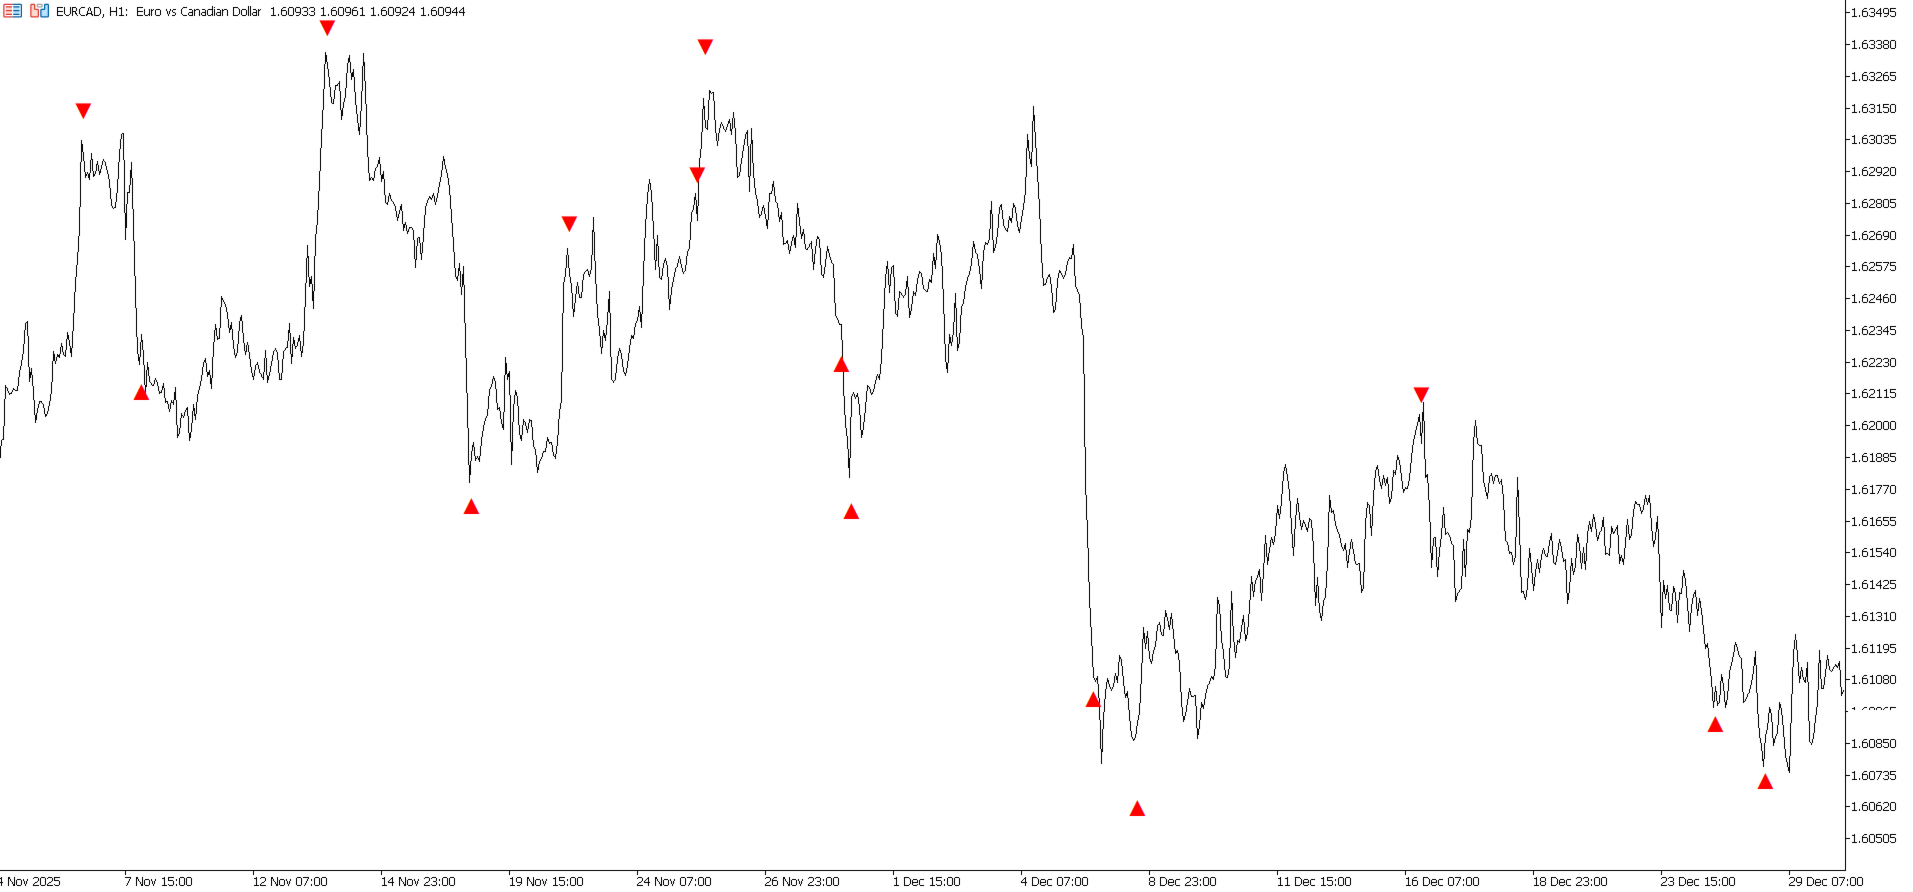
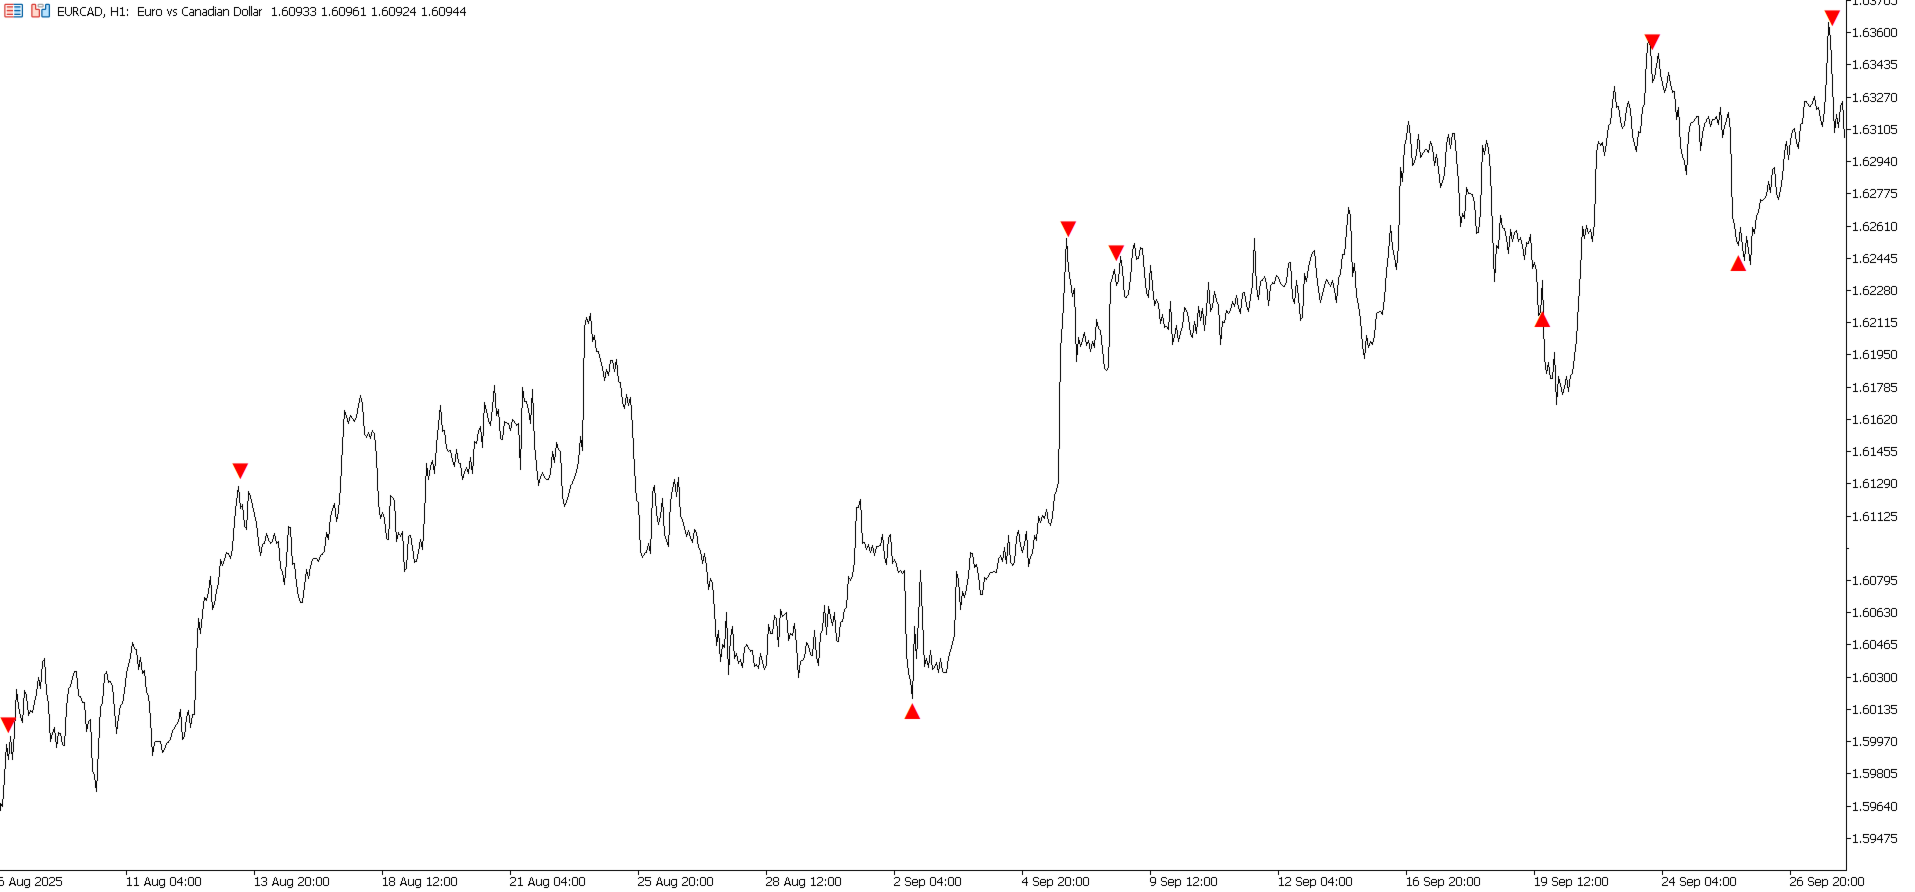
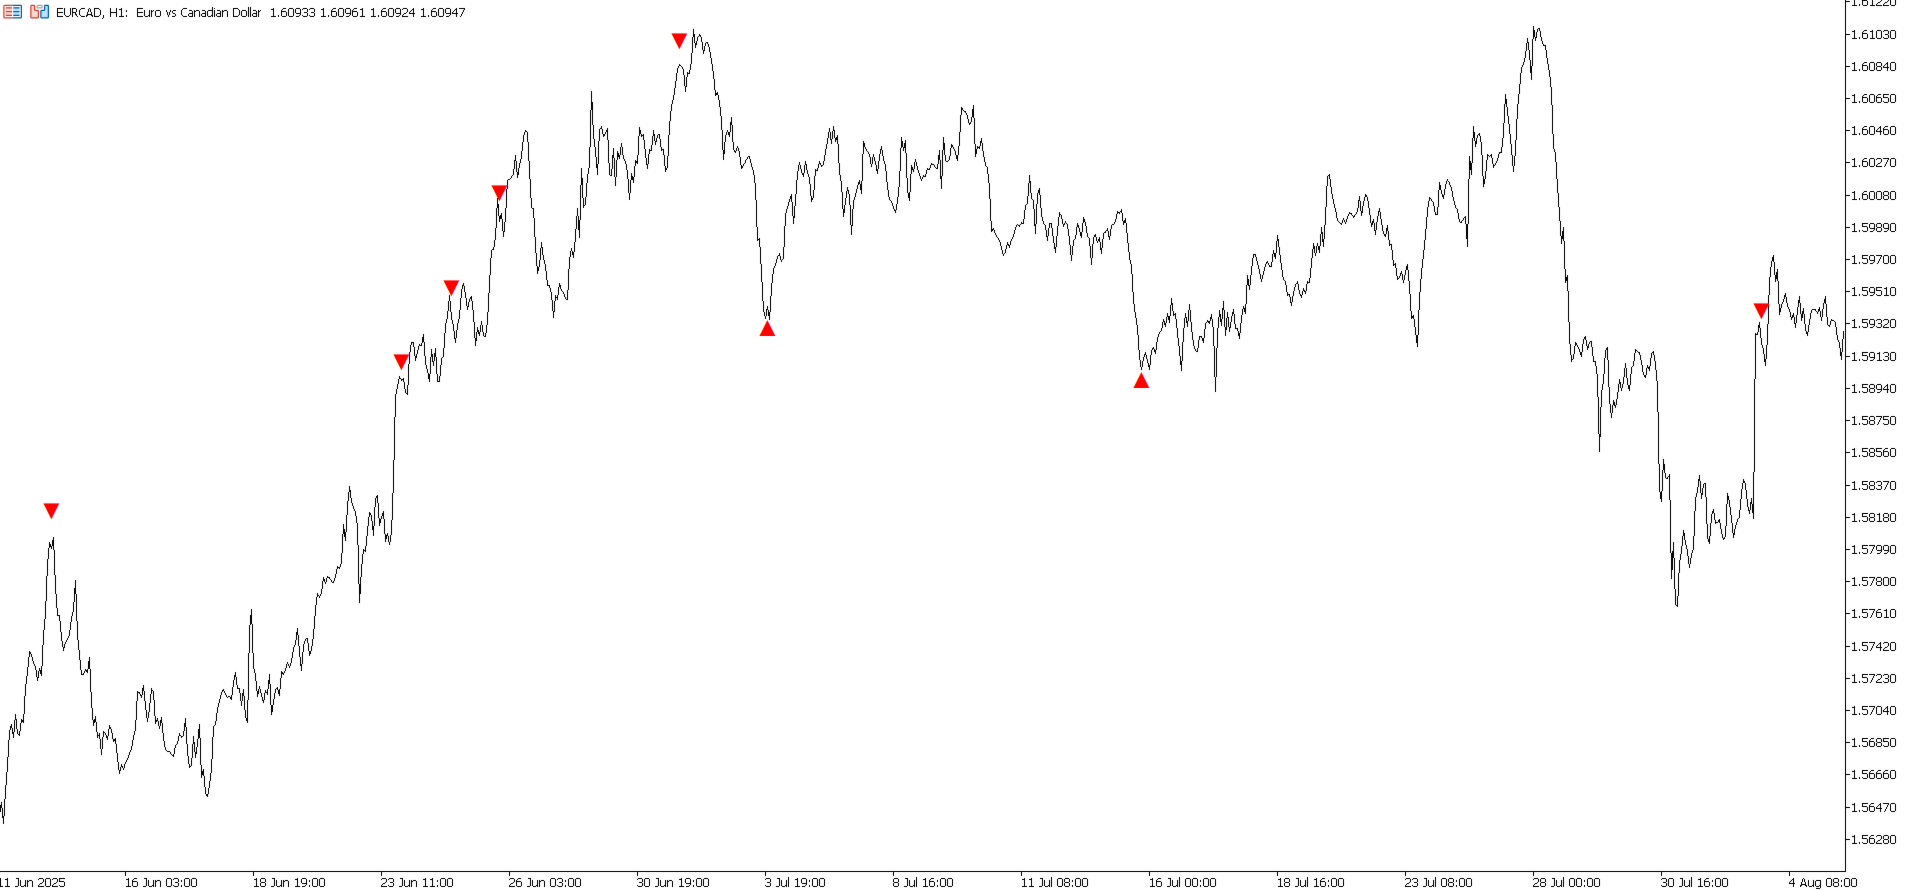
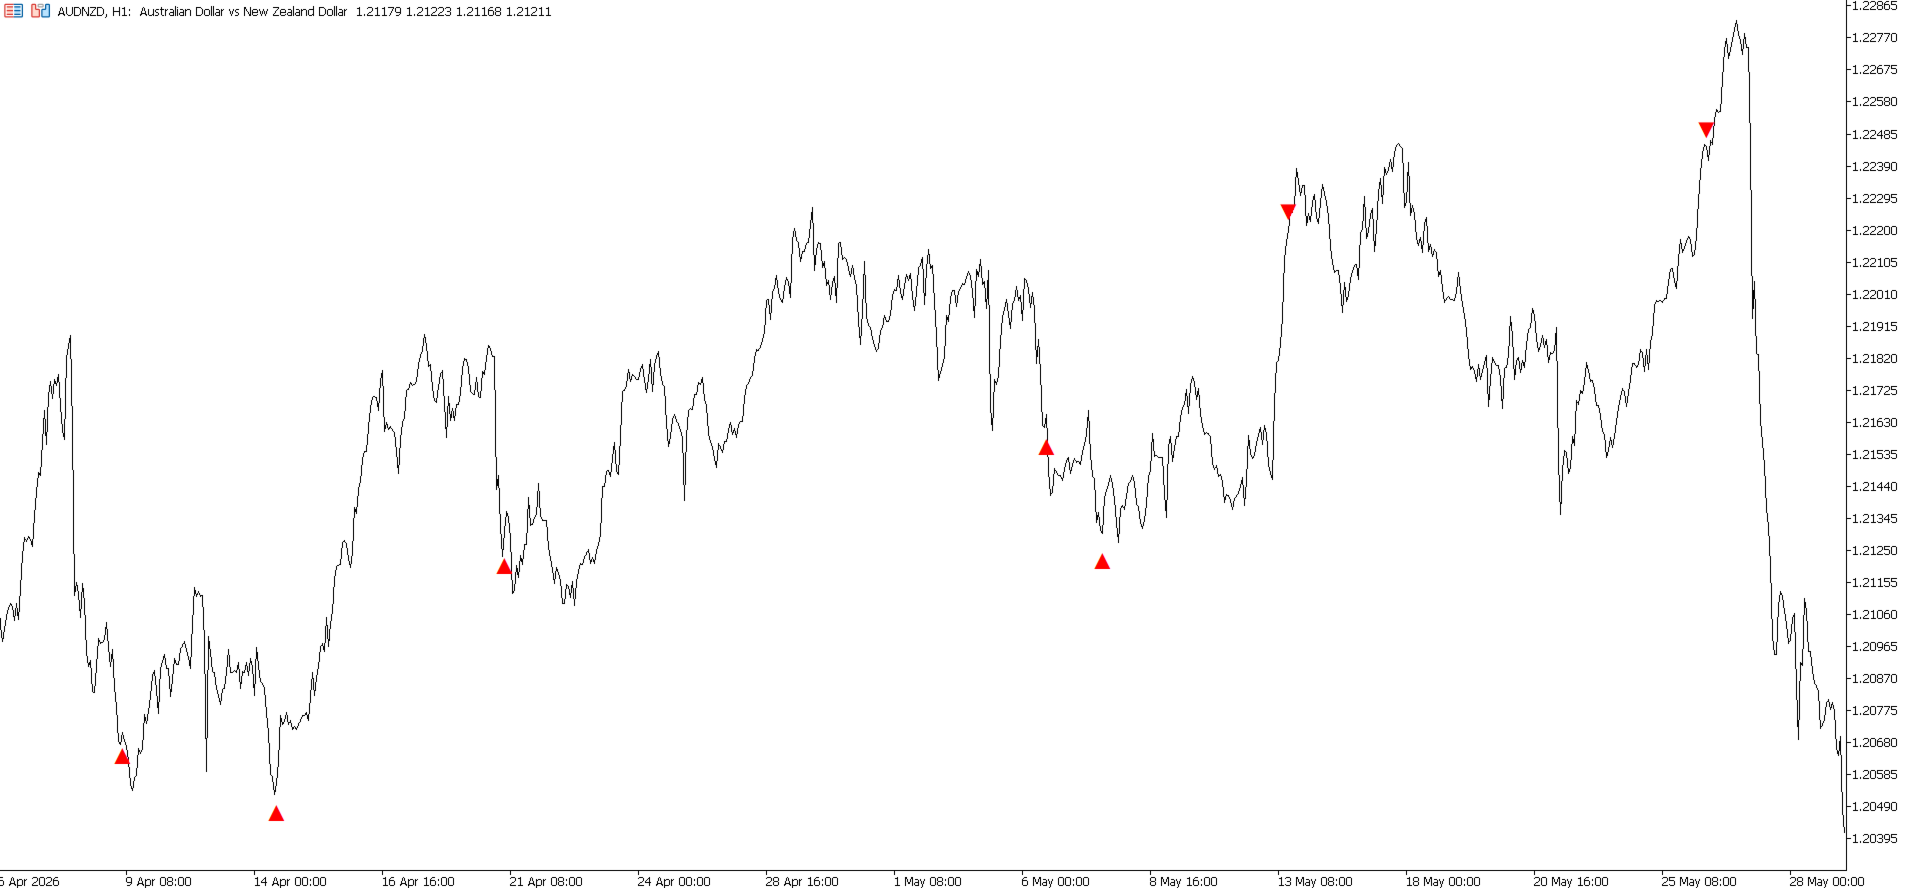
Red Indicator is a clean reversal focused tool designed to highlight moments where price may be moving away from an extreme condition and entering a potential turning zone.

The indicator uses a price derived volatility framework to detect areas where market pressure may have become stretched. When conditions align, it plots red triangle signals directly on the chart.

Both bullish and bearish signals use the same red visual identity, giving the indicator a simple, sharp, and recognizable look.

Signal Display

• Red upward triangle: potential bullish reversal area
• Red downward triangle: potential bearish reversal area

The goal of Red Indicator is to help traders identify possible exhaustion points without cluttering the chart or relying on complex visual panels.

Key Features

• Clean red signal markers
• Bullish and bearish reversal detection
• Minimal chart design
• Works directly on the main price chart
• Suitable for multiple markets and timeframes
• Designed for traders who want simple visual confirmation
• Can be combined with support and resistance, trend context, or price action analysis

How to Use

  • A red upward triangle suggests that downside pressure may be weakening and that a potential bullish reversal zone may be forming.
  • A red downward triangle suggests that upside pressure may be weakening and that a potential bearish reversal zone may be forming.

Red Indicator is best used as a confirmation tool within a broader trading process. It can help traders focus on areas where price behavior deserves closer attention.

Important

Red Indicator is a decision support tool. It does not guarantee future market direction and should not be used as a standalone trading system. Traders should test it on their preferred symbols and timeframes before using it in live trading conditions.


Другие продукты этого автора
Orange Indicator by Quant Atlas Creator:  https://www.quant-atlas.com/ Orange Indicator is a clean reversal focused indicator for MetaTrader 5, designed to highlight potential turning points directly on the chart using simple orange buy and sell markers. The indicator focuses on moments where price may be transitioning out of short term exhaustion and into a possible reaction phase. When a bullish setup appears, an orange upward triangle is displayed below the candle. When a bearish setup appear
FREE
Vision: описание продукта Vision от Quant Atlas — это многокомпонентный индикатор разворотных сигналов, разработанный для выявления краткосрочных зон бычьего и медвежьего истощения на ликвидных рынках. Модель объединяет несколько независимых слоев технических подтверждений, включая поведение импульса, давление возврата к среднему, условия на основе волатильности, взаимодействие с трендом, временную структуру и подтверждения, связанные со скользящими средними. Итоговый результат преобразуется в в
K’s Reversal Indicator I   by Quant Atlas Creator:  https://www.quant-atlas.com/ K’s Reversal Indicator I is a clean reversal focused indicator designed to help traders identify potential bullish and bearish turning points directly on the chart. The indicator highlights moments where the market may be approaching exhaustion and where a tactical reversal setup may be forming. Signals are displayed with simple visual triangles, making the tool easy to read without cluttering the chart. Key idea Ma
Three Dimensional Reversal Indicator  by Quant Atlas Creator:  https://www.quant-atlas.com/ Three Dimensional Reversal Indicator is a clean and focused reversal tool designed to identify potential market turning points through a three dimensional view of price behavior. The model combines three key dimensions: • Time How long market pressure has remained one sided. • Price Where price is currently positioned relative to its recent behavior. • Price Derived Structure A transformed view of pric
Violet Indicator  by Quant Atlas Creator:  https://www.quant-atlas.com/ Violet Indicator is a clean reversal focused trading tool designed to identify moments where price may be shifting away from an extended directional condition. The indicator uses a price derived trend framework to detect moments where market structure may be changing. When conditions align, it plots violet triangle signals directly on the chart. Both bullish and bearish signals use the same violet visual identity, giving the
FREE
Fibonacci Moving Average by Quant Atlas Fibonacci Moving Average is a visual trend structure indicator built around a layered Fibonacci based moving average framework. The indicator plots two dynamic average lines directly on the price chart, creating a clean view of how price behaves relative to broader trend structure. The lines automatically change color depending on the position of price, making market direction easier to read at a glance. Visual Logic • Blue line state: price is trading abo
Фильтр:
Нет отзывов
Ответ на отзыв