RSI Echo

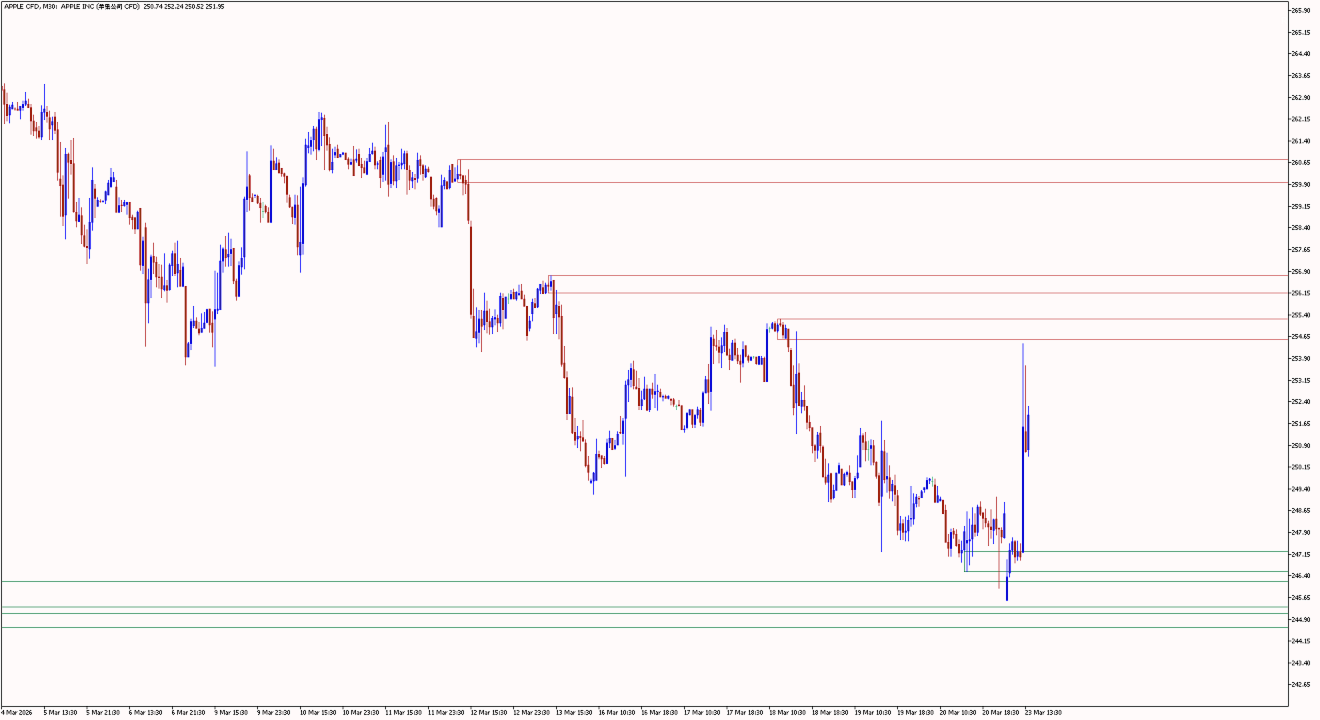
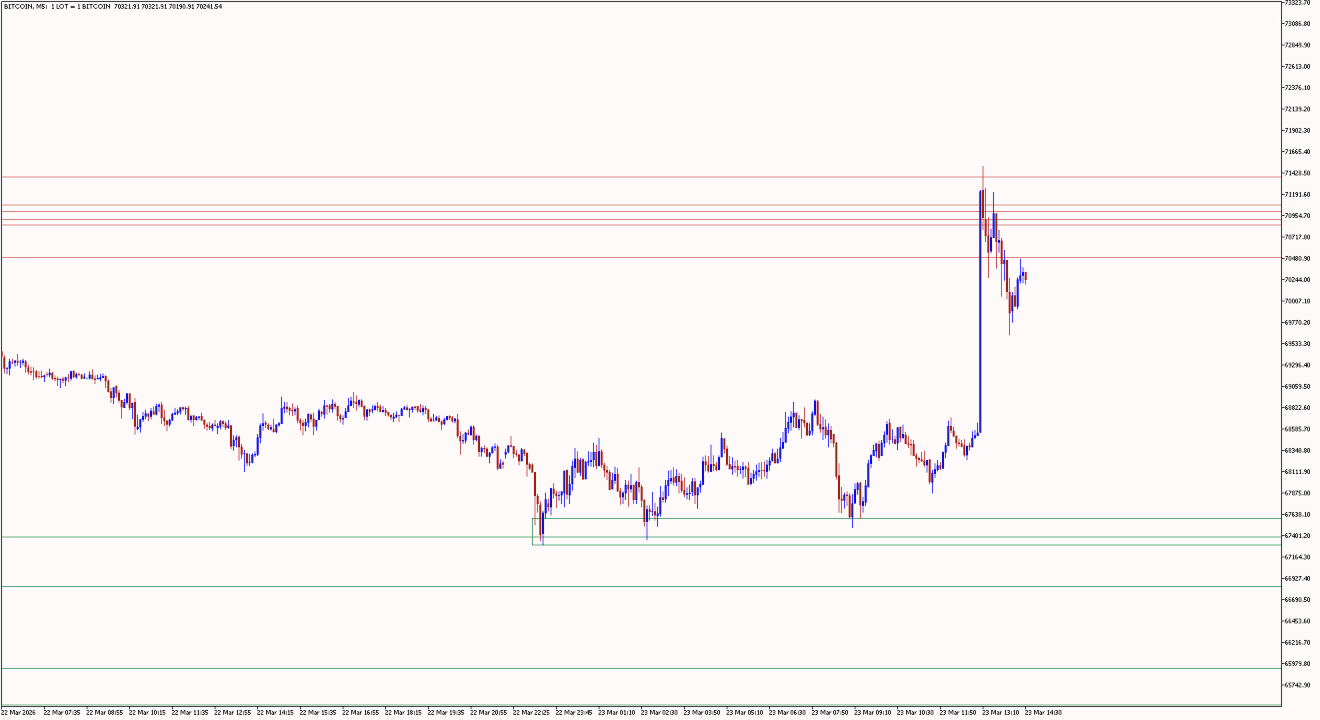
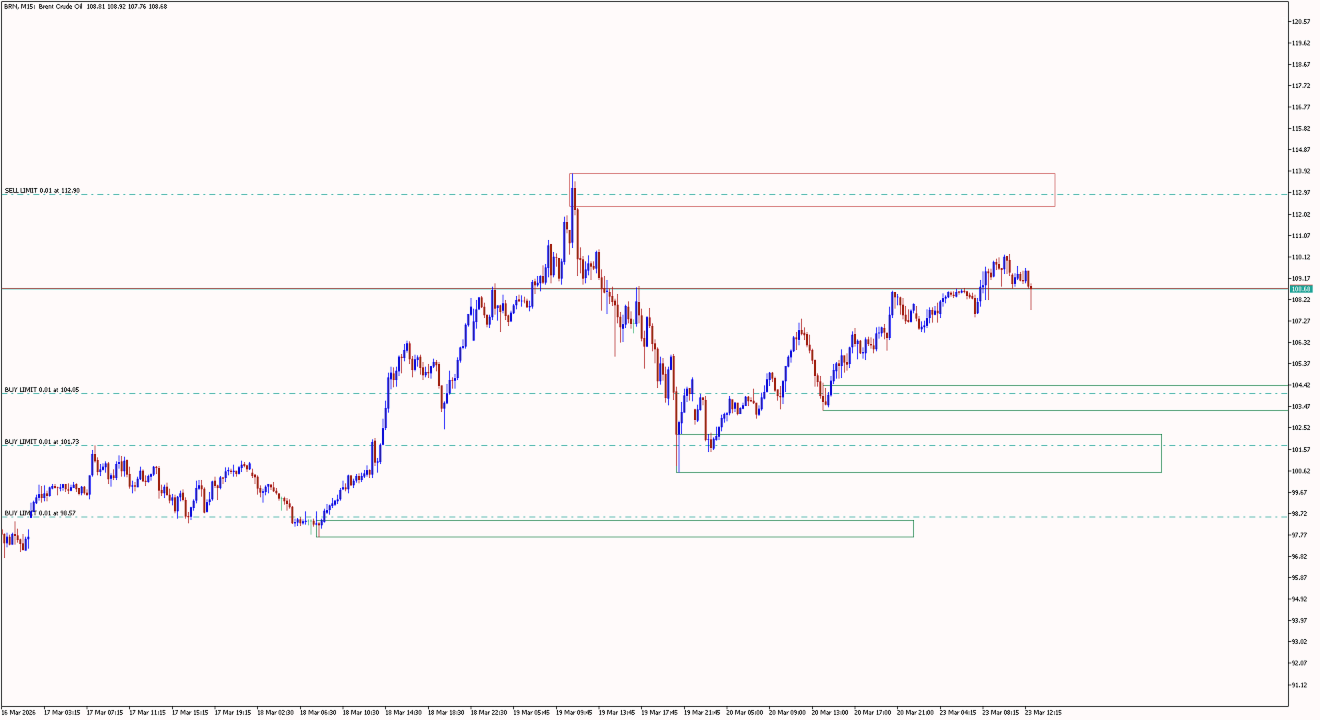
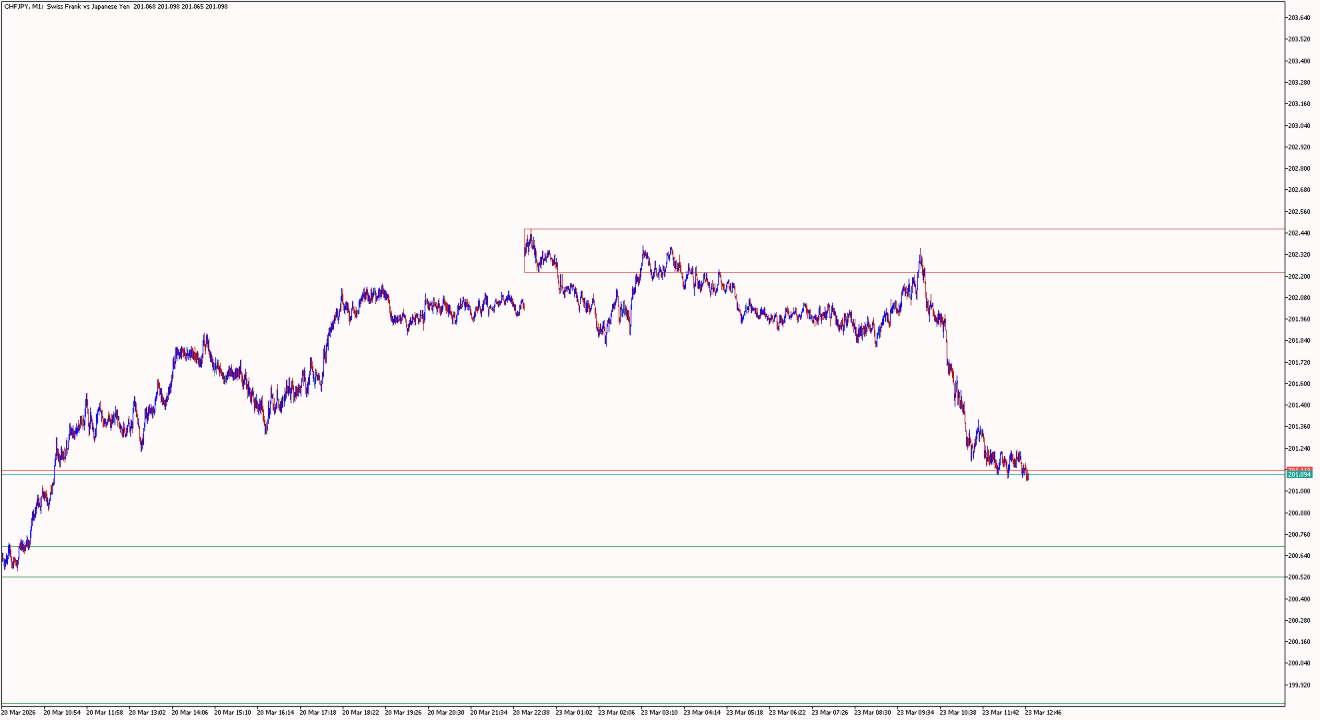
RSI Echo is a structured market analysis indicator designed to identify and maintain relevant supply and demand zones across different market regimes.

The indicator focuses on clean structure visualization, continuously adapting to market conditions and removing outdated zones automatically.

🔹 Regime-Based Market Logic

RSI Echo adapts its analysis depending on the chart timeframe:

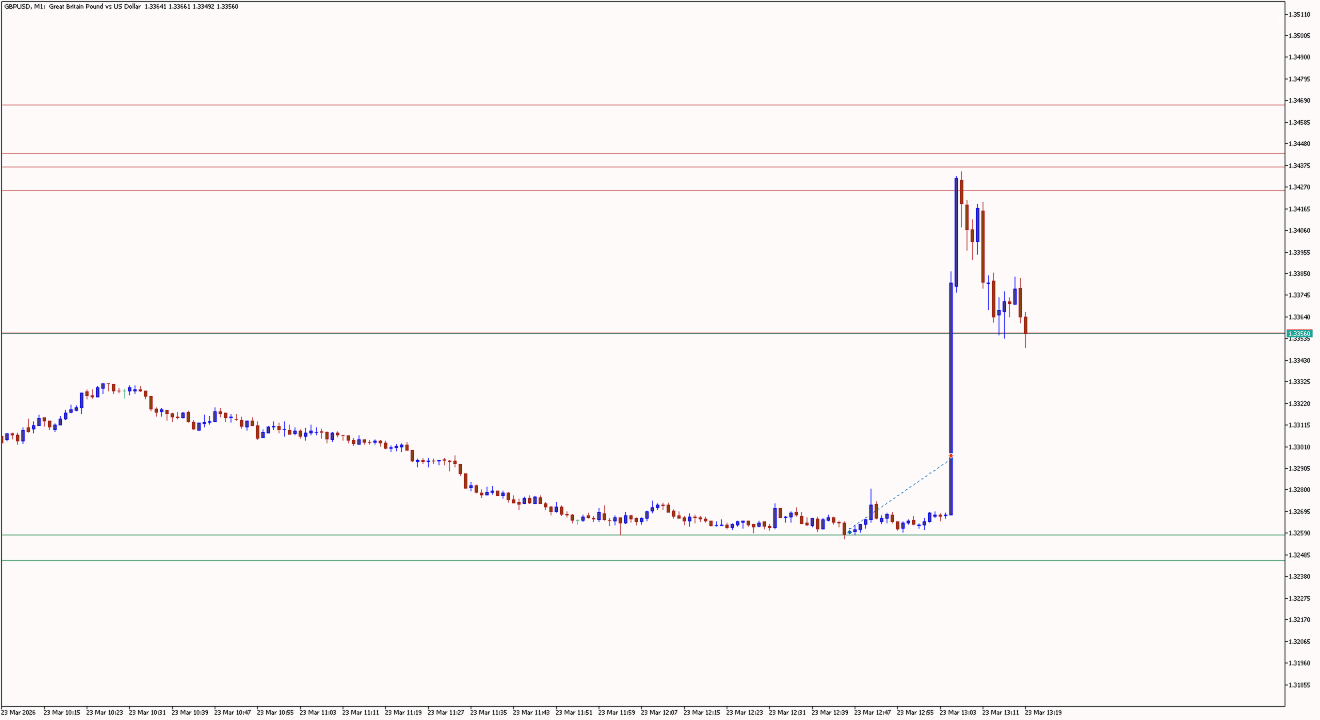
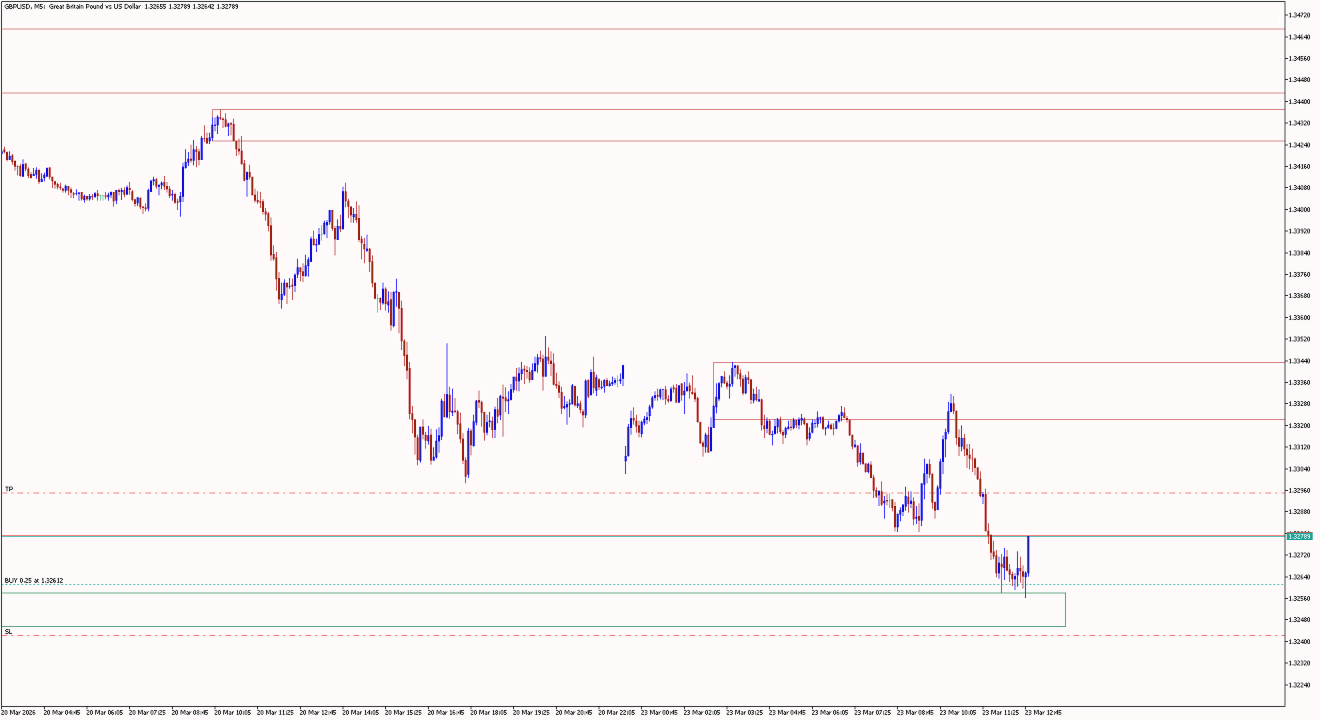
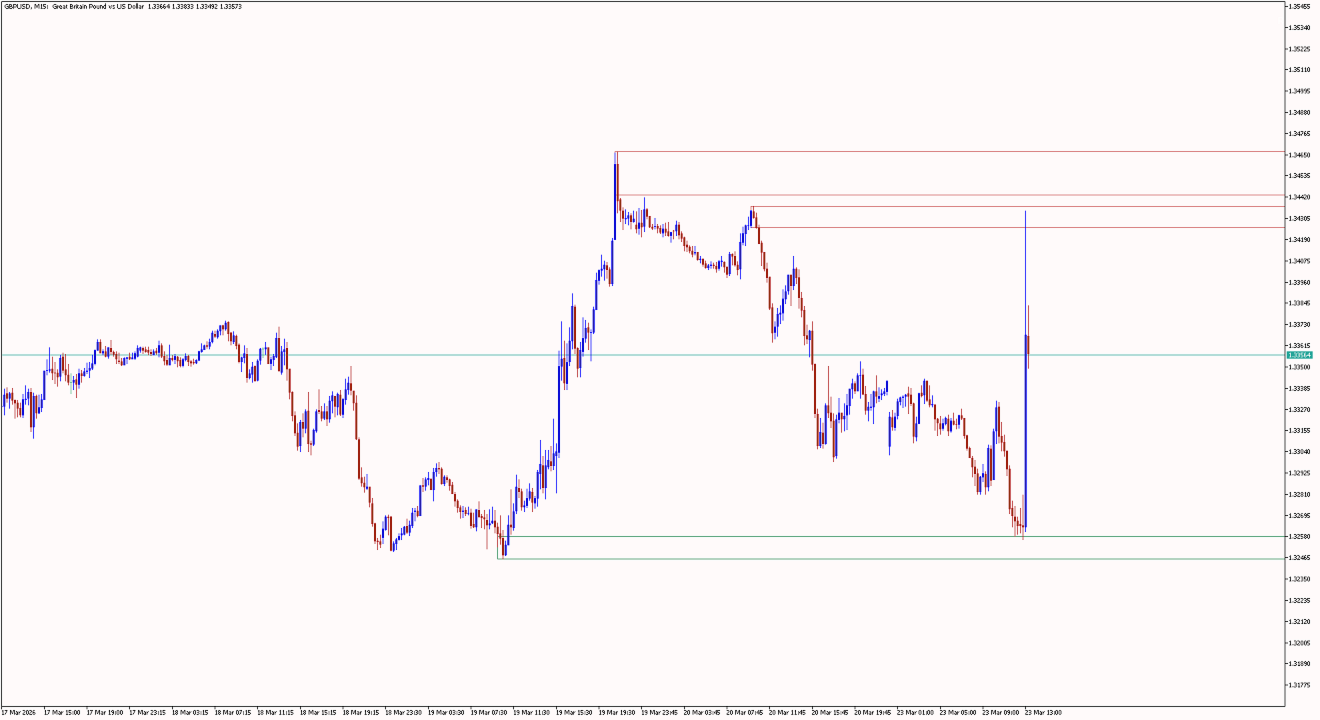
  • M1 to M30 → unified intraday structure
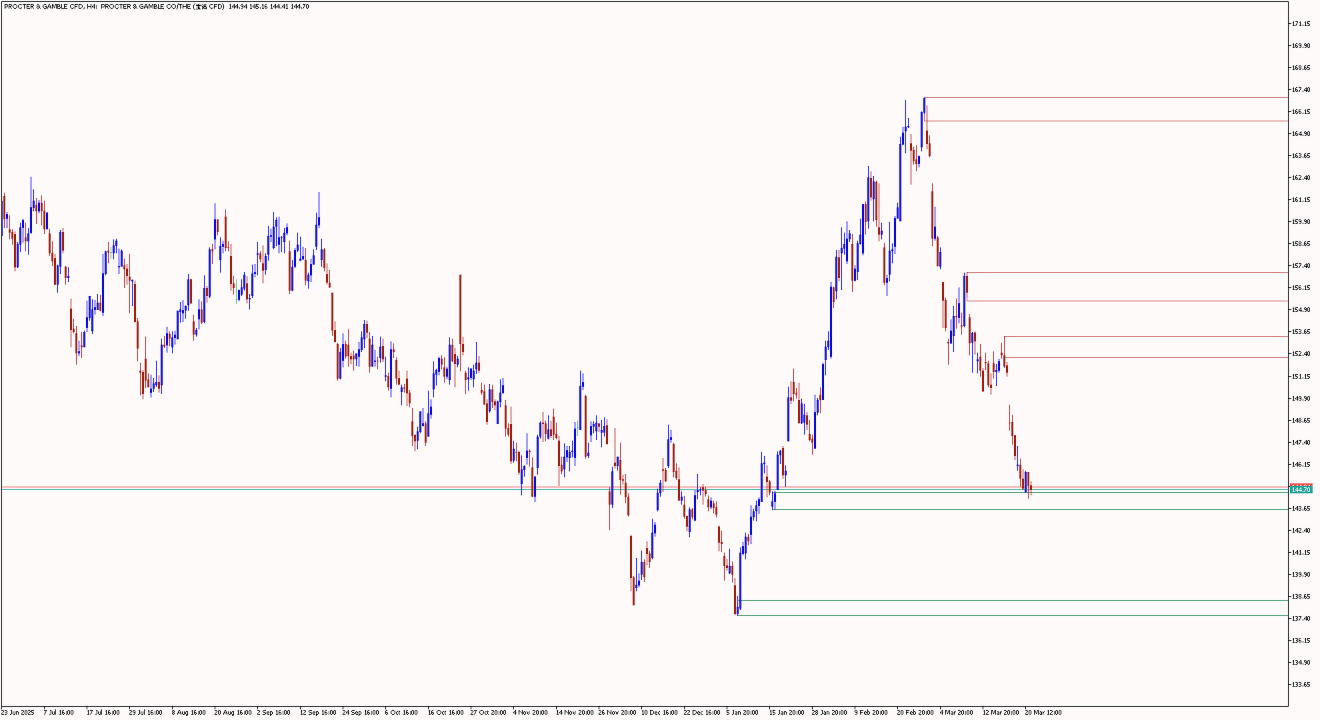
  • H1 to H4 → higher timeframe structure
  • D1 and above → macro market structure

This allows traders to maintain consistency across lower timeframes while still respecting broader market context.

🔹 Core Features

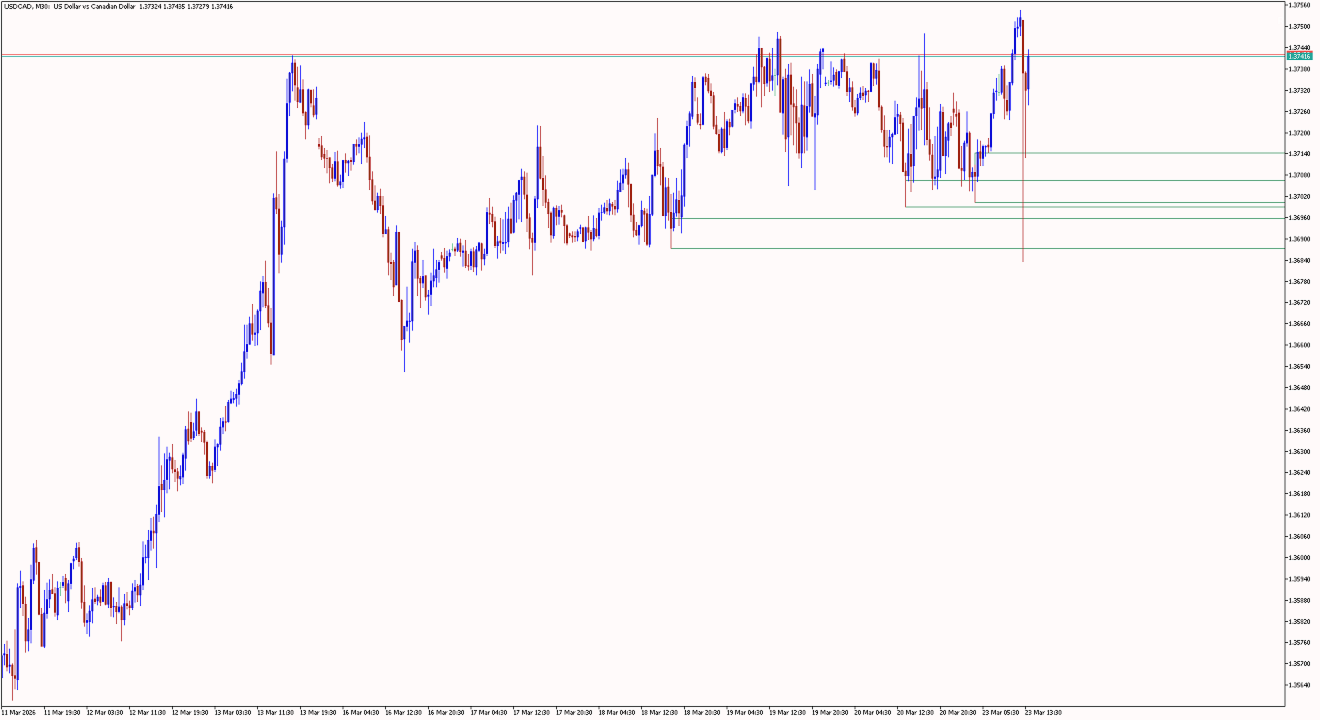
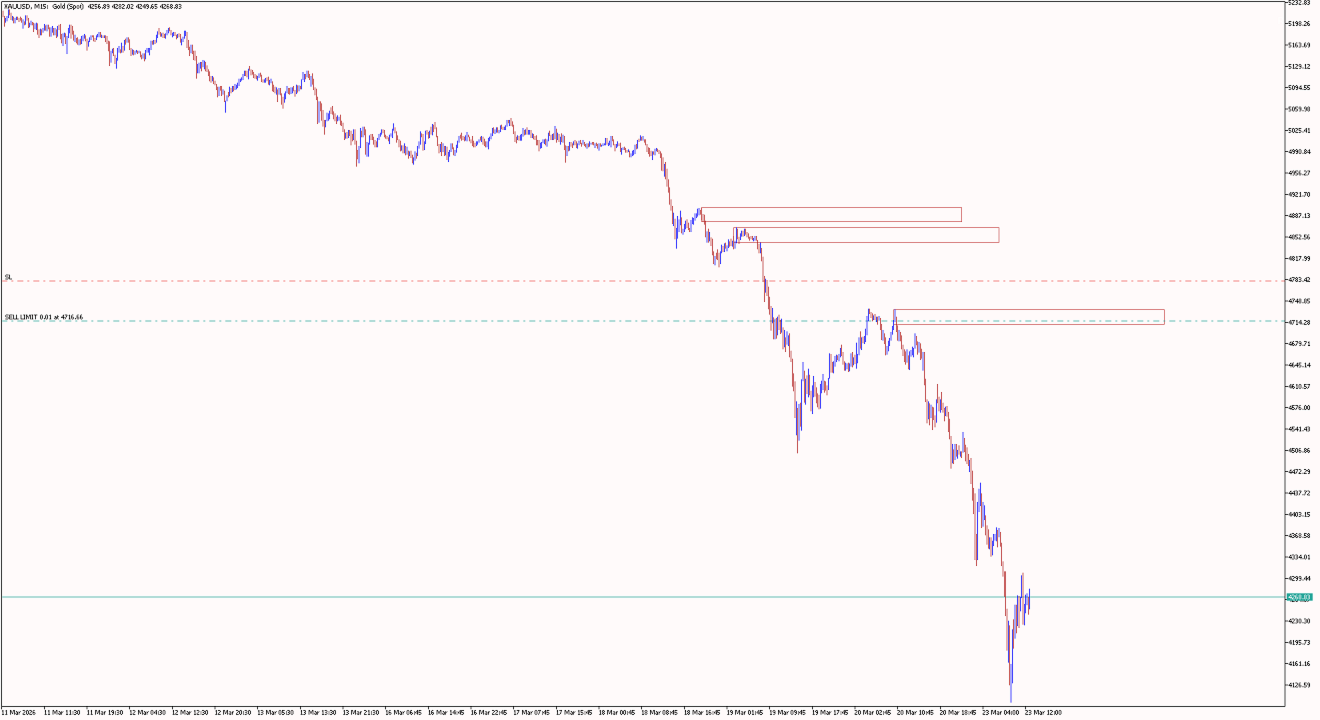
  • Automatic supply & demand zones
  • Continuous zone validation and replacement
  • Broken zones removed automatically
  • New valid zones created dynamically
  • Regime-based multi-timeframe logic
  • Auto-refresh without reattaching
  • Clean chart with limited active zones

🔹 How It Works

  1. The indicator scans price structure to identify supply and demand zones
  2. Zones are continuously monitored for validity
  3. If a zone is broken, it is removed automatically
  4. New zones are created based on updated market structure
  5. Only active and relevant zones remain on the chart

This ensures the chart stays clean and focused on current market conditions.

🔹 Best Use Cases

  • Gold (XAUUSD) intraday trading
  • Forex major/minor pairs
  • Commodities & Indices (HTF)
  • Stocks (Intraday - 15-30 Min charts)
  • Market structure analysis
  • Supply and demand trading
  • Discretionary trading setups

🔹 Recommended Settings

For intraday use:

  • Low Regime TF: H1
  • Mid Regime TF: H4
  • High Regime TF: D1
  • Swing Size: 3
  • ATR Multiplier: 0.70
  • Scan Bars: 1200
  • Zones: 2–3 active
  • Refresh: 1 second


🔹 Inputs Explanation

Regime Mapping

  • Defines how the indicator adapts across timeframes

Zone Engine

  • Controls how zones are detected and filtered

Display

  • Controls visual elements and refresh behavior
⚠️ Important

RSI Echo is a market structure visualization tool.

It does not generate automated trade signals and should be used as part of a broader trading strategy.

Рекомендуем также
Adaptive Trend Lines
Henri Salvatore Bigatti
4.76 (25)
This indicator shows the TLH and TLL and some trendlines that allow us to estimate the trend of market.  It also shows the values of the angles of the lines in percentage in points (pip) , the standard deviation, and the trend of each line, and when it breaks the lines of support and resistance (TLH and TLL). And finally, it also shows the points identified as supports and resistances through the fractal algorithm in the graph. The high and low trend lines are supported by the highs and lows, th
FREE
1. Overview The Scalping PullBack Signal indicator is a powerful technical analysis tool designed to help traders identify scalping opportunities based on potential pullback and reversal signals. This tool is particularly useful on lower timeframes (below 15 minutes) but can also be applied on higher timeframes for longer-term trades. This indicator integrates several key analytical components, providing a comprehensive view of trends and potential entry/exit points, helping you make quick and e
FREE
RSI abcd
Francisco Gomes Da Silva
4.33 (3)
RSI ABCD Pattern Finder: Technical Strategy 1. How the Indicator Works Combines the classic RSI with automatic detection of ABCD harmonic patterns . Key Components Standard RSI (adjustable period) Peak and Trough Markers (arrows) ABCD Patterns (green/red lines) Overbought (70) and Oversold (30) Filters 2. MT5 Setup period = 14 ; // RSI period size = 4 ; // Maximum pattern size OverBought = 70 ; // Overbought level OverSold = 30 ; // Oversold level Filter = USE_FILTER_ YES ; // Confirmation filte
FREE
Super Trend eu
Emin Ulucanli
4.83 (6)
SUPERTREND ; Это индикатор следования за трендом, основанный на SuperTrend ATR, созданном Оливье Себаном. Его можно использовать для обнаружения изменений в направлении тренда и обнаружения стопов. Когда цена падает ниже кривой индикатора, она становится красной и указывает на нисходящий тренд. И наоборот, когда цена движется выше кривой, индикатор становится зеленым, указывая на восходящий тренд. Как и другие индикаторы, он хорошо работает с SuperTrend в сочетании с другими индикаторами, такими
FREE
Caicai L&S Yield Histogram Important Notice: This indicator is an integral tool of the automated EA Caicai Long and Short Pair Trading . This indicator visually displays the percentage deviation (Yield %) of a pair's current spread relative to its own historical mean. It is an excellent tool for quickly visualizing the gross financial potential of a market distortion in Long & Short operations. Main Features: Percentage Visualization: Understand the size of the distortion in palpable percentage
PROMETHEUS TECHNICAN VERSION Free | By THE SONS A gift from The Sons — no strings, no trial, no expiry. Every trader deserves access to professional-grade market intelligence. That belief is why Prometheus Technical Version exists, and why it costs nothing. Consider it our handshake to the trading community. What You're Getting This is not a simplified tool dressed up as a gift. Prometheus Technican Version is a fully built, institutional-quality technical analysis indicator running a dual-model
FREE
GDXM Session Open Line PO3
Gustavo Barros Alexandre D Almeida
This indicator is a specialized utility for traders following the ICT (Inner Circle Trader) methodology, specifically focusing on the Power of Three (PO3) concept: Accumulation, Manipulation, and Distribution. The ICT PO3 Open Line automatically identifies and plots critical opening prices from specific market sessions, allowing you to visualize price action relative to the "True Open" of the day or specific sessions. Key Features 1. Daily PO3 Open Levels The indicator tracks and draws horizonta
FREE
Unmask Institutional Market Shifts with Precision Institutional Divergence Reversal Pro Most divergence indicators fail because they are "noisy"—they find every tiny curve in the market, leading to false signals. Institutional Divergence Reversal Pro is engineered to filter out retail noise and identify high-probability reversal zones where "Smart Money" is active. By combining multi-timeframe monitoring with a proprietary Quality Scoring System , this tool ensures you only focus on the setups t
Расширенный Индикатор Экономического Календаря Этот индикатор отображает все предстоящие экономические события прямо на графике, показывая наиболее важные новости для выбранной валютной пары или инструмента. Он позволяет заранее прогнозировать периоды высокой волатильности и более точно планировать торговые стратегии. Основные функции Отображение будущих событий на срок до 5 дней вперед (настраивается). Фильтрация по уровню важности новостей (высокая, средняя, низкая). Возможность включать верти
FREE
SPECIAL LAUNCH OFFER: $30 (1-Month Rent) Limited time offer to build our community and gather feedback! AmbM GOLD Institutional Scalper A high-precision M5 algorithm for XAUUSD (Gold) , engineered to trade exclusively at Institutional Liquidity Levels ($5/$10 psychological marks). PERFORMANCE DATA (BUY ONLY) • Win Rate: 87.09%. • Safe Growth: +$4,113 profit on $10k (13.75% Max Drawdown). • Extreme Stress Test: Successfully generated +$22,997 in a 5-year stress test (2020-2026), proving
Bounce Zone MT5
Nguyen Thanh Cong
4.56 (9)
Introduction The Bounce Zone indicator is a cutting-edge non-repainting technical tool built to identify key areas on the price chart where market sentiment is likely to cause a significant price reversal. Using advanced algorithms and historical price data analysis, this indicator pinpoints potential bounce zones. Combined with other entry signal, this indicator can help forex traders place the best trades possible Signal A possible buy signal is generated when price is in the green zone an
FREE
Best SAR MT5
Ashkan Hazegh Nikrou
4.33 (3)
Описание :  мы рады представить наш новый бесплатный индикатор, основанный на одном из профессиональных и популярных индикаторов на рынке форекс (PSAR), этот индикатор является новой модификацией оригинального индикатора Parabolic SAR, в индикаторе pro SAR вы можете видеть пересечение между точками и графиком цены, это пересечение не является сигналом, а говорит о возможности окончания движения, вы можете начать покупать с новой синей точки, и разместить стоп-лосс за один атр до первой синей т
FREE
Necessary for traders: tools and indicators Waves automatically calculate indicators, channel trend trading Perfect trend-wave automatic calculation channel calculation , MT4 Perfect trend-wave automatic calculation channel calculation , MT5 Local Trading copying Easy And Fast Copy , MT4 Easy And Fast Copy , MT5 Local Trading copying For DEMO Easy And Fast Copy , MT4 DEMO Easy And Fast Copy , MT5 DEMO The homeopathic indicator is also called the CCI indicator. The CCI indicator was proposed
FREE
FlatBreakout  MT5 (Бесплатная версия) Детектор флэта и пробоев для MT5 — только для GBPUSD FlatBreakout   MT5  — это бесплатная версия профессионального индикатора FlatBreakoutPro MT5, специально предназначенная для анализа флэта и поиска точек пробоя только по паре   GBPUSD . Идеально для трейдеров, которые хотят познакомиться с уникальной фрактальной логикой FlatBreakout MT5  и протестировать сигналы пробоя диапазона на реальном рынке. Для кого этот продукт Для трейдеров, предпочитающих торгов
FREE
This indicator automatically identifies demand and supply zones on a number of 1000 candles or more, and you can change that number of settings.  It also carries a high level of accuracy in describing the type of each zone, as it contains: Weak areas . Untested areas . Strong areas . Role-taking areas . Areas tested + number of times visited . Areas to which a return is expected, depending on the direction . The indicator contains alert zones. For signals and more free indicators, you can foll
FREE
VFI Quantum
Nikita Berdnikov
5 (1)
Представляем VFI (Volume Flow Indicator) – индикатор для торговли, который анализирует соотношение объема и движения цены для выявления ключевых торговых возможностей. Индикатор отображает силу и направление потока объемов, предоставляя четкие сигналы о потенциальных точках входа и выхода. Сигналы формируются на основе пересечения нулевой линии, пересечения линии VFI и ее экспоненциальной скользящей средней (EMA), а также при выходе индикатора из зон перекупленности и перепроданности. Внимание!
FREE
This indicator uses the metaquotes ZigZag indicator as base to plot fibonacci extension and fibonacci retracement based in the Elliot waves. A fibonacci retracement will be plotted on every wave draw by the ZigZag. A fibonacci extension will be plotted only after the 2nd wave. Both fibonacci will be updated over the same wave tendency. Supporting until 9 consecutive elliot waves. Parameters: Depth: How much the algorithm will iterate to find the lowest and highest candles Deviation: Amount of
Daily HiLo
Nicanor Jr Cagape Layco
DailyHiLo Indicator Master the daily range like a pro. This indicator automatically plots the previous day’s high and low levels —a core element in the (Beat The Market Maker) trading approach—directly on your chart. These levels act as natural boundaries for intraday price action, helping traders identify potential reversal zones, breakout points, and liquidity targets. Key Features Accurate plotting of yesterday’s high and low for any symbol and timeframe. Works seamlessly with BTMM-inspired
FREE
Индикатор Rocket Trend трендовый. Индикатор рисует вдоль графика двухцветные точки соединенные между собой линиями. Это трендовый индикатор, представляет из себя алгоритмический индикатор. Прост в работе и понимании при появлении синего кружка необходимо покупать, при появлении красного - продавать. Индикатор используется для скальпинга и пипсовки, не плохо себя зарекомендовал. Rocket Trend доступный для анализа направления тренда за конкретный отрезок времени. Идеально подходит для начинающих
В MetaTrader построение нескольких   горизонтальных линий   и отслеживание их ценовых уровней может быть утомительным. Этот индикатор автоматически строит горизонтальные линии на равных интервалах для установки ценовых оповещений, отображения уровней поддержки и сопротивления и других ручных целей. Этот индикатор идеально подходит для начинающих трейдеров на рынке Форекс, стремящихся быстро заработать на покупке и продаже. Горизонтальные линии помогают определить возможные зоны для входа в рынок
OmniSignal Navigator – Умный скальпинг на ключевых уровнях Торгуйте как профессионал с этим дневным/еженедельным индикатором High-Low-Close, разработанным для скальпинга и точной торговли на пробой. Почему это работает Идеально подходит для скальпинга: Ориентируется на ключевые зоны (PDH/PDL/PDC и PWH/PWL/PWC) на таймфреймах M2, M3, M5 и M15. (Меньшие таймфреймы = больше сигналов, большие таймфреймы = меньше сигналов) Не требуется анализ графика: просто ждите push-уведомлений (телефо
FREE
Cybertrade Keltner Channels - MT5 Created by Chester Keltner, this is a volatility indicator used by technical analysis. It is possible to follow the trend of financial asset prices and generate support and resistance patterns. In addition, envelopes are a way of tracking volatility in order to identify opportunities to buy and sell these assets. It works on periods longer than the period visible on the chart. All values ​​are available in the form of buffers to simplify possible automations.
FREE
Hunter’s Scope: Индикатор волатильности и силы тренда (MT5) Hunter’s Scope — это высокоэффективный моментум-индикатор для MetaTrader 5, который выявляет расширение цены путем фильтрации как направленной силы, так и волатильности. Он разработан для обнаружения значимых импульсных свечей, предоставляя четкие и объективные сигналы для моментум-трейдинга. Основная логика: Двухуровневый фильтр Вместо запаздывающих пересечений Hunter’s Scope использует двухфакторную модель подтверждения: Сила тренда
Auto Support and Resistances
Flavio Javier Jarabeck
4.57 (70)
Are you tired of drawing Support & Resistance levels for your Quotes? Are you learning how to spot Support & Resistances? No matter what is your case, Auto Support & Resistances will draw those levels for you! AND, it can draw them from other timeframes, right into you current chart, no matter what timeframe you are using... You can also Agglutinate regions/zones that are too much closer to each other and turning them into one single Support & Resistance Level. All configurable. SETTINGS Timefr
FREE
The one minute chart has a bug, but the one-day chart can still be used after deleting the bug and reloading the indicators, This indicator can be used to determine how far the indicator goes up to place an order to buy, how far it goes down to place an order to sell, and not placing an order until it reaches this distance, which is considered oscillation, open an account gift index
FREE
Range Directional Force Indicator – Designed for You to Optimize! The Range Directional Force Indicator is a cutting-edge tool designed to empower traders by visualizing market dynamics and directional strength. Built to offer insights into market trends and reversals, this indicator is an invaluable asset for traders seeking precision in their strategies. However, it is important to note that this indicator is not optimized, leaving room for you to tailor it to your unique trading preferences.
Уникальный индикатор, реализующий профессиональный и количественный подход к торговле на возврате к среднему. Он использует тот факт, что цена отклоняется и возвращается к среднему предсказуемым и измеримым образом, что позволяет использовать четкие правила входа и выхода, которые значительно превосходят неколичественные торговые стратегии. [ Installation Guide | Update Guide | Troubleshooting | FAQ | All Products ] Четкие торговые сигналы Удивительно легко торговать Настраиваемые цвета и разме
Santa Donchian
Marco Aurelio Cestari
4.5 (2)
Santa Donchian Indicator  is an efficient way to detect support, resistence and break outs in any market. The Donchian channel measures the high and the low of a previously defined range.  Typically, a trader would look for a well-defined range and then wait for the price to break out to either one side for a trade entry trigger. Advantages Never repaints, never backpaints, never recalculates. Works in all symbols and all timeframes. Perfect trend filter for any strategy or expert advisor. Full
FREE
Ищет сильные движения цены и  по их завершении рисует уровни. Силу движения вы определяете самостоятельно, указав в настройках количество пунктов и количество свечей одинакового цвета подряд в одном направлении.  В настройках есть 2 типа построения:  extrenum - high/low close - цена закрытия Так же можно регулировать количество отображаемых уровней и число свечей для расчетов. По умолчанию в настройках указано 5 уровней для 360 свечей. То есть будет вычислено 5 уровней для сильных движений вверх
FREE
Trend Flip Detector is a simple visual tool designed to help you understand when market direction is shifting - and more importantly, when not to chase price. It does not try to predict the market. Instead, it focuses on clarity and timing - showing when trend conditions are stable, weakening, or potentially flipping. Why this tool exists Many traders face the same issue: entering too late after a strong move reacting to momentum without context confusing pullbacks with real reversals This tool
FREE
С этим продуктом покупают
ARIBot is a powerful trading companion designed to generate high-probability entry signals with dynamic TP/SL/DP levels based on volatility. Built-in performance tracking shows win/loss stats, PP1/PP2 hits, and success rates — all updated live. Key Features: Buy/Sell signals with adaptive volatility bands Real-time TP/SL/DP levels based on ATR Built-in MA Filter with optional ATR/StdDev volatility Performance stats panel (Success, Profit/Loss, PP1/PP2) Alerts via popup, sound, push, or email Cus
SuperScalp Pro
Van Minh Nguyen
4.63 (24)
SuperScalp Pro – Продвинутая скальпинговая индикаторная система с множественными фильтрами SuperScalp Pro — это продвинутый скальпинговый индикатор, который сочетает классический Supertrend с несколькими интеллектуальными фильтрами подтверждения для поиска торговых возможностей. Он эффективно работает на различных таймфреймах от M1 до H4, с оптимизированной производительностью на XAUUSD, BTCUSD и основных валютных парах Forex. Индикатор предоставляет четкие сигналы Buy и Sell, а также автоматиче
Каждый покупатель этого индикатора получает дополнительно Бесплатно: Авторскую утилиту "Bomber Utility", которая автоматически сопровождает каждю торговую операцию, устанавливает уровни Стоп Лосс и Тейк профит и закрывает сделки согласно правилам этой стратегии, Сет-файлы для настройки этого индикатора на различных активах, Сет-файлы для настройки Bomber Utility в режимы: "Минимум Риска", "Взвешенный Риск" и "Стратегия Выжидания", Пошаговый видео-мануал, который поможет вам быстро установить, на
Entry In The Zone and SMC Multi Timeframe is a real-time 2-in-1 market analysis tool that combines market structure analysis and a No Repaint BUY / SELL signal system into a single indicator, built on Smart Money Concepts (SMC) — a widely adopted framework used by professional traders to understand market structure. This indicator helps you see the market more clearly, make decisions based on structure rather than guesswork, and focus on high-probability zones where price is more likely to react
Gold Entry Sniper – Профессиональная Мульти-Таймфрейм ATR Панель для Скальпинга и Свинг-Трейдинга на Золоте Gold Entry Sniper — это передовой индикатор для MetaTrader 5, разработанный для точных сигналов на покупку/продажу по XAUUSD и другим инструментам. Основан на логике ATR Trailing Stop и мульти-таймфрейм анализе , этот инструмент идеально подходит как для скальперов, так и для среднесрочных трейдеров, обеспечивая чёткие точки входа с высокой вероятностью . Основные возможности и преимуществ
Power Candles V3 — самооптимизирующийся индикатор силы Power Candles V3 преобразует силу валюты и инструмента в готовый к использованию торговый план на каждом графике, к которому он прикреплен. Вместо того, чтобы просто раскрашивать свечи, он выполняет автоматическую оптимизацию в режиме реального времени в фоновом режиме и предоставляет вам оптимальные значения Stop Loss, Take Profit и порог сигнала для выбранного вами символа. Один клик — и все готово для реальной торговли: на графике появляю
Если вы покупаете этот индикатор, вы получите мой профессиональный Trade Manager + EA БЕСПЛАТНО. Прежде всего стоит подчеркнуть, что эта торговая система является индикатором без перерисовки, без повторной отрисовки и без задержки, что делает ее идеальной как для ручной, так и для роботизированной торговли. Онлайн курс, руководство и загрузка пресетов. «Smart Trend Trading System MT5» - это комплексное торговое решение, созданное для новичков и опытных трейдеров. Он объединяет более 10 премиаль
SignalTech MT5 is a fully rule based trading system for EURUSD, USDCHF, USDJPY, AUDUSD, NZDUSD, EURJPY, AUDJPY, NZDJPY, CADJPY.  All the winning trades with chart setups are published on the comments page. 2025-12 1174 Pips 2026-01 2624 Pips 2026-02 2937 Pips 2026-03 2165 Pips 2026-04 2243 Pips It can generate signals with Buy/Sell Arrows and Pop-Up/Sound Alerts. Each signal has clear Entry and Stop Loss levels, which should be automatically flagged on the chart, as well as potential Targets 1,
Gann Made Easy   - это профессиональная, но при этом очень простая в применении Форекс система, основанная на лучших принципах торговли по методам господина У.Д. Ганна. Индикатор дает точные BUY/SELL сигналы, включающие в себя уровни Stop Loss и Take Profit. ПОЖАЛУЙСТА, СВЯЖИТЕСЬ СО МНОЙ ПОСЛЕ ПОКУПКИ, ЧТОБЫ ПОЛУЧИТЬ ТОРГОВЫЕ ИНСТРУКЦИИ И ОТЛИЧНЫЕ ДОПОЛНИТЕЛЬНЫЕ ИНДИКАТОРЫ БЕСПЛАТНО! Вероятно вы уже не раз слышали о торговли по методам Ганна. Как правило теория Ганна отпугивает от себя не только
Представляем       Quantum Breakout PRO   , новаторский индикатор MQL5, который меняет ваш способ торговли в зонах прорыва! Разработан командой опытных трейдеров со стажем торговли более 13 лет,       Квантовый прорыв PRO       разработан, чтобы поднять ваше торговое путешествие к новым высотам с его инновационной и динамичной стратегией зоны прорыва. Quantum Breakout Indicator покажет вам сигнальные стрелки на зонах прорыва с 5 целевыми зонами прибыли и предложением стоп-лосса на основе поля
Azimuth Pro
Ottaviano De Cicco
5 (7)
Azimuth Pro V2: Синтетический фрактальный структурный анализ и подтверждённые входы для MT5 Обзор Azimuth Pro — многоуровневый индикатор свинговой структуры от Merkava Labs . Четыре вложенных уровня свингов, привязанный к свингам VWAP, определение ABC-паттернов, трёхтаймфреймная структурная фильтрация и подтверждённые входы на закрытой свече — один график, один рабочий процесс от микро-свингов до макро-циклов. Это не слепой сигнальный продукт. Это рабочий процесс, основанный на структуре, для т
Прежде всего стоит подчеркнуть, что этот Торговый Инструмент является Неперерисовывающимся Нерепейнтинговым Индикатором, что делает его идеальным для профессиональной торговли. Онлайн-курс, руководство пользователя и демонстрация. Индикатор Концепций Умного Действия Цены - очень мощный инструмент как для новичков, так и для опытных трейдеров. Он объединяет более 20 полезных индикаторов в одном, комбинируя передовые торговые идеи, такие как анализ Inner Circle Trader и стратегии торговли концеп
Давайте сначала будем честны. Ни один индикатор сам по себе не сделает вас прибыльным. Если кто-то говорит вам обратное — он продаёт вам мечту. Любой индикатор, который показывает идеальные стрелки покупки/продажи, можно сделать безупречным — просто увеличьте нужный участок истории и сделайте скриншот успешных сделок. Мы так делать не будем. SMC Intraday Formula — это инструмент. Он считывает структуру рынка за вас, определяет зоны с наивысшей вероятностью движения цены и точно показывает, как
RelicusRoad Pro: Квантовая Рыночная Операционная Система СКИДКА 70% ПОЖИЗНЕННЫЙ ДОСТУП (ОГРАНИЧЕНО) - ПРИСОЕДИНЯЙТЕСЬ К 2000+ ТРЕЙДЕРАМ Почему большинство трейдеров теряют деньги даже с «идеальными» индикаторами? Потому что они торгуют Единичными Концепциями в вакууме. Сигнал без контекста — это лотерея. Чтобы выигрывать стабильно, вам нужна КОНФЛЮЭНЦИЯ . RelicusRoad Pro — это не простой стрелочный индикатор. Это полная Количественная Рыночная Экосистема . Она отображает «Дорогу Справедливой Сто
Meridian Pro
Ottaviano De Cicco
5 (2)
Meridian Pro 2.00: профессиональная multi-timeframe матрица тренда для MT5 Meridian Pro 2.00 - профессиональная адаптивная матрица тренда для MetaTrader 5. Она объединяет оригинальный трендовый движок Meridian, чистый chart ribbon, сигнальные стрелки по закрытому бару, dashboard на 8 таймфреймов, Fuel momentum, weighted consensus, synthetic HTF processing и chart-native линии контекста старших таймфреймов. Цель простая: читать текущий тренд, multi-timeframe структуру, силу, momentum и EA-ready с
Quantum TrendPulse
Bogdan Ion Puscasu
5 (25)
Представляем   Quantum TrendPulse   , совершенный торговый инструмент, который объединяет мощь   SuperTrend   ,   RSI   и   Stochastic   в один комплексный индикатор, чтобы максимизировать ваш торговый потенциал. Разработанный для трейдеров, которые ищут точность и эффективность, этот индикатор помогает вам уверенно определять рыночные тренды, сдвиги импульса и оптимальные точки входа и выхода. Основные характеристики: Интеграция SuperTrend:   легко следуйте преобладающим рыночным тенденциям и п
FX Trend NG: Следующее поколение интеллектуального анализа трендов на разных рынках Обзор FX Trend NG — это профессиональный инструмент анализа трендов и мониторинга рынка с поддержкой нескольких таймфреймов. Он позволяет за секунды получить полное структурное понимание текущего состояния рынка. Вместо переключения между десятками графиков вы мгновенно видите, какие инструменты находятся в тренде, где импульс ослабевает и где наблюдается сильная синхронизация между таймфреймами. Специальное пр
Прежде всего стоит подчеркнуть, что этот торговый индикатор не перерисовывается, не перерисовывает и не отставает, что делает его идеальным как для ручной, так и для роботизированной торговли. Руководство пользователя: настройки, вводы и стратегия. Атомный аналитик - это индикатор ценового действия PA, который использует силу и импульс цены, чтобы найти лучший край на рынке. Оборудованный расширенными фильтрами, которые помогают убирать шумы и ложные сигналы, и повышают торговый потенциал. Испо
FX Power: Анализируйте силу валют для более эффективной торговли Обзор FX Power — это ваш незаменимый инструмент для понимания реальной силы валют и золота в любых рыночных условиях. Определяя сильные валюты для покупки и слабые для продажи, FX Power упрощает принятие торговых решений и выявляет высоковероятные возможности. Независимо от того, хотите ли вы следовать за трендами или предсказывать развороты с использованием экстремальных значений дельты, этот инструмент идеально адаптируется под
Большинство стрелочных индикаторов дают сигнал и оставляют вас самостоятельно разбираться со всем остальным. KT Alpha Hunter Arrows дает вам полный торговый план. Каждая сигнальная стрелка появляется вместе с уже готовым планом: линия входа, стоп-лосс, четыре уровня тейк-профита и живой вердикт по преимуществу, который показывает, стоит ли сейчас торговать данный символ и таймфрейм. В комплект входит Trade Manager EA, который берет на себя сопровождение сделки после вашего входа, помогая сохраня
Market Structure Order Block Dashboard MT5 — это индикатор MT5, разработанный для трейдеров, которые хотят читать рыночную структуру и основные зоны реакции цены прямо на графике. Он объединяет BOS, ChoCH, Order Blocks, Fair Value Gaps (FVG), Ликвидность, Kill Zones, Volume Profile и компактную панель для быстрого анализа. Индикатор предназначен для трейдеров, использующих рыночную структуру, концепции ICT и Smart Money как основу для принятия решений. Он помогает выявлять продолжения тренда, во
Btmm state engine pro
Garry James Goodchild
5 (4)
BTMM State Engine Pro is a MetaTrader 5 indicator for traders who use the Beat The Market Maker approach: Asian session context, kill zone timing, level progression, peak formation detection, and a multi-pair scanner from a single chart. It combines cycle state logic with a built-in scanner dashboard so you do not need the same tool on many charts at once. What it does Draws the Asian session range; session times can follow broker server offset or be set in inputs. Tracks level progression (L
Раскройте силу торговли трендами с помощью индикатора Trend Screener: вашего идеального решения для торговли трендами, основанного на нечеткой логике и мультивалютной системе! Повысьте уровень своей торговли по тренду с помощью Trend Screener, революционного индикатора тренда, основанного на нечеткой логике. Это мощный индикатор отслеживания тренда, который сочетает в себе более 13 инструментов и функций премиум-класса и 3 торговые стратегии, что делает его универсальным выбором для превращения
Представляю Вам отличный технический индикатор GRABBER, который работает, как готовая торговая стратегия "Все включено"! В одном программном коде интегрированы мощные инструменты для технического анализа рынка, торговые сигналы (стрелки), функции алертов и Push уведомлений.  Каждый покупатель этого индикатора получает дополнительно БЕСПЛАТНО:  Grabber Утилиту для автоматического управления открытыми ордерами, Пошаговый видео-мануал : как установить, настроить и торговать, Авторские сет-файлы дл
Топовый индикатор МТ5, дающий сигналы для входа в сделки без перерисовки! Идеальные точки входа в сделки для  валют, крипты, металлов, акций, индексов !  Смотрите  видео  (6:22) с примером отработки всего одного сигнала, окупившего индикатор. Версия индикатора для MT4 Преимущества индикатора Сигналы на вход без перерисовки Если сигнал появился, он никуда НЕ исчезает! В отличие от индикаторов с перерисовкой, которые ведут к потере депозита, потому что могут показать сигнал, а потом убрать его. Б
Индикатор Trend Forecaster использует уникальный авторский алгоритм для определения точек входа в сделку по пробойной стратегии. Индикатор определяет ценовые скопления и анализирует движение цены возле уровней и показывает сигнал, когда цена пробивает уровень. Индикатор Trend Forecaster подходит для любых финансовых активов: валюты (Форекс), металлы, акции, индексы, криптовалюты. Также индикатор можно настроить для работы на любых тайм-фреймах, однако в качестве рабочего тайм-фрейма все же реком
Эта панель показывает последние доступные   гармонические паттерны   для выбранных символов, так что вы сэкономите время и будете более эффективны /   MT4 версия . Бесплатный индикатор:   Basic Harmonic Pattern Колонки индикатора Symbol:   отображаются выбранные символы Trend   :   бычий или медвежий Pattern   :   тип паттерна (Гартли, бабочка, летучая мышь, краб, акула, шифр или ABCD) Entry   :   цена входа SL:   цена стоп-лосса TP1:   цена первого тейк-профита TP2:   цена второго тейк-профи
TREND LINES PRO   помогает понять, где рынок действительно меняет направление. Индикатор показывает реальные развороты тренда и места, где крупные участники входят повторно. Вы видите   BOS-линии   смены тренда и ключевые уровни старших таймфреймов — без сложных настроек и лишнего шума. Сигналы не перерисовываются и остаются на графике после закрытия бара. VERSION MT4     -     Раскрывает свой максимальный потенциал в связке с индикатором  RFI LEVELS PRO Что показывает индикатор: Реальные смены
Индикатор точно показывает точки разворота и зоны возврата цены, где входят   крупные игроки . Вы видите, где формируется новый тренд, и принимаете решения с максимальной точностью, держа контроль над каждой сделкой. VERSION MT4     -    Раскрывает свой максимальный потенциал в связке с индикатором  TREND LINES PRO Что показывает индикатор: Разворотные конструкции и разворотные уровни с активацией в начале нового тренда. Отображение уровней  TAKE PROFIT  и  STOP LOSS  с минимальным соотношением
Super Signal Market Slayer Без перерисовки | Высокая точность | Интеллектуальный мульти-рыночный трендовый индикатор В трейдинге самое сложное — не открыть сделку, а вовремя распознать начало тренда среди рыночного шума. Именно для этого был создан Market Slayer. Это интеллектуальный индикатор без перерисовки, разработанный для внутридневной торговли. Благодаря многоуровневому подтверждению и фильтрации тренда он показывает чёткие и надёжные сигналы Buy / Sell только в ключевые моменты. Ключевы
Другие продукты этого автора
This indicator contains Pivot Levels of: Traditional Fibonacci Woodie Classic Demark Camarilla  Calculation periods can be set to auto / Daily / Weekly / Monthly / Yearly.  Number of Levels are editable.  Options to hide level labels and price labels.  Pivots Points are price levels chartists can use to determine intraday support and resistance levels. Pivot Points use the previous days Open, High, and Low to calculate a Pivot Point for the current day. Using this Pivot Point as the base, three
A heatmap is a graphical representation of data in two dimensions, using colors to display different factors. Heatmaps are a helpful visual aid for viewers, enabling the quick dissemination of statistical or data-driven information. The MP Heatmap indicator provides a graphical representation of the relative strengths of major currencies compared to others, organizing data from pairs into color-coded results and producing a clear overview of the entire Forex market. The MP Heatmap indicator dis
FREE
A pin bar pattern consists of one price bar, typically a candlestick price bar, which represents a sharp reversal and rejection of price. The pin bar reversal as it is sometimes called, is defined by a long tail, the tail is also referred to as a “shadow” or “wick”. The area between the open and close of the pin bar is called its “real body”, and pin bars generally have small real bodies in comparison to their long tails. The tail of the pin bar shows the area of price that was rejected, and t
FREE
An “inside bar” pattern is a two-bar price action trading strategy in which the inside bar is smaller and within the high to low range of the prior bar, i.e. the high is lower than the previous bar’s high, and the low is higher than the previous bar’s low. Its relative position can be at the top, the middle or the bottom of the prior bar. The prior bar, the bar before the inside bar, is often referred to as the “mother bar”. You will sometimes see an inside bar referred to as an “ib” and its m
FREE
The MP Andean Oscillator is used to estimate the direction and also the degree of variations of trends. It contains 3 components: Bull component, Bear component and Signal component. A rising Bull component indicates that the market is up-trending while a rising Bear component indicates the presence of down-trending market. Settings: Oscillator period: Specifies the importance of the trends degree of variations measured by the indicator. Signal line per: Moving average period of the Signal line
FREE
MP Squeeze Momentum is a volatility and momentum indicator derivated of "TTM Squeeze" volatility indicator introduced by John Carter. It capitalizes on the tendency for price to break out strongly after consolidating in a tight range. Introduction: The volatility component of MP Squeeze Momentum measures price compression using Bollinger Bands and Keltner Channels. If the Bollinger Bands are completely enclosed within the Keltner Channels, that indicates a period of very low volatility. This st
FREE
MP Candle Countdown indicator with a progress bar is a tool used in technical analysis that displays the time remaining until the current candlestick on a chart closes, along with a progress bar that shows visually the amount of time that has elapsed since the candlestick opened. This indicator can be helpful for traders who use candlestick charting to make trading decisions, as it provides both a visual representation of the time left until a candlestick closes and an indication of how much ti
FREE
This trend scanner indicator is using two main indicators to identify trends. Frist the EMAs to provide a view on Bullish / Bearish momentum. When the shorter EMA (calculated off more recent price action) crosses, or is above, the slower moving EMA (calculated off a longer period of price action), it suggests that the market is in an uptrend. Second the Stochastic RSI, When RSI is < 20 it is considered oversold, and when > 80 it is overbought. These conditions suggests that momentum is very str
FREE
Candle size oscillator is an easy to use tool to figure out candle size from highest to lowest price of each candle. It's a powerful tool for price action analysts specifically for those who works intraday charts and also a perfect tool for short term swing traders. Kindly note that you can also edit the Bullish and Bearish candles with different colors. #Tags: Candle size, oscillator, price action, price range, high to low, candle ticks __________________________________________________________
FREE
This indicator is stand alone version from  MP Pivot Levels  (All in one) containing Demark's Pivots. Calculations:     PP = X / 4     R1 = X / 2 - LOWprev     S1 = X / 2 - HIGHprev Uses: When the pair currency price may change the direction of movement. Possible constraints of support and resistance that creates plateaus for the currency pair prices. Tendency identification by comparing the present prices according to current day's pivot point and also the prior day's pivot points. ____________
FREE
The purpose of using Smart money index (SMI) or smart money flow index is to find out investors sentiment. The index was constructed by Don Hays and measures the market action. The indicator is based on intra-day price patterns. The beginning of the trading day is supposed to represent the trading by retail traders. The majority of retail traders overreact at the beginning of the trading day because of the overnight news and economic data. There is also a lot of buying on market orders and shor
FREE
This creative simple indicator will provide a precise framework for market sentiment within technical analysis of different timeframes. For instance, for traders like me that uses   "Mark Fisher"   strategy regularly, this is a perfect indicator for having an insight to markets from short term to long term point of view, using Break points of candles' lows and highs and perfect to combine with   "Price Action" . For more options and modifications you can also edit the low timeframe candles withi
FREE
MP Price Change Indicator is a tool to calculate the price movement by percentage. The Value of this indicator can be adjusted to look back of the percent of price change within certain timeframes. This is a powerful tool when used by other indicators as well, such as ATR and ADR, for understanding price fluctuations and tolerance in different strategies. ___________________________________________________________________________________ Disclaimer: Do NOT trade or invest based upon the analysi
FREE
This indicator is stand alone version from  MP Pivot Levels  (All in one) containing Woodie Pivots. Woodie’s pivot points are made up of multiple key levels, calculated from past price points, in order to frame trades in a simplistic manner. The key levels include the ‘pivot’ itself, and multiple support and resistance levels (usually up to three each). Traders use these levels as a guide for future price movements when setting up trades. The pivot : (Previous high + previous low + 2 x previous
FREE
MP Price Change Indicator is a tool to calculate the price movement by percentage. The Value of this indicator can be adjusted to look back of the percent of price change within certain timeframes. This is a powerful tool when used by other indicators as well, such as ATR and ADR, for understanding price fluctuations and tolerance in different strategies. ___________________________________________________________________________________ Disclaimer: Do NOT trade or invest based upon the analysi
FREE
This indicator is stand alone version from  MP Pivot Levels  (All in one) containing Demark's Pivots. Calculations:     PP = X / 4     R1 = X / 2 - LOWprev     S1 = X / 2 - HIGHprev Uses: When the pair currency price may change the direction of movement. Possible constraints of support and resistance that creates plateaus for the currency pair prices. Tendency identification by comparing the present prices according to current day's pivot point and also the prior day's pivot points. ____________
FREE
This indicator is stand alone version from  MP Pivot Levels  (All in one) containing Woodie Pivots. Woodie’s pivot points are made up of multiple key levels, calculated from past price points, in order to frame trades in a simplistic manner. The key levels include the ‘pivot’ itself, and multiple support and resistance levels (usually up to three each). Traders use these levels as a guide for future price movements when setting up trades. The pivot : (Previous high + previous low + 2 x previous
FREE
This utility identifies certain candle open times on chart, this can help you to see your favorite candle open and use it as it fits in your strategy. This tool is very useful for intraday charting and indicating your sessions. ___________________________________________________________________________________ Disclaimer: Do NOT trade or invest based upon the analysis presented on this channel. Always do your own research and due diligence before investing or trading. I’ll never tell you what
FREE
This creative simple indicator will provide a precise framework for market sentiment within technical analysis of different timeframes. For instance, for traders like me that uses   "Mark Fisher"   strategy regularly, this is a perfect indicator for having an insight to markets from short term to long term point of view, using Break points of candles' lows and highs and perfect to combine with   "Price Action" . For more options and modifications you can also edit the low timeframe candles withi
FREE
MP Relative Bandwidth Filter (RBF) is created to be used to identify your trading zones based on volatility. This easy to use technical indicator attempts to compare between Bandwidth of higher length and ATR of lower length to identify the areas of low and high volatility: Relative Bandwidth = Bandwidth / ATR The Bandwidth is based on Bollinger Band which its length ideally needs to be higher and ATR length needs to be ideally lower. After calculating Relative Bandwidth, the Bollinger Band is
FREE
The MP Andean Oscillator is used to estimate the direction and also the degree of variations of trends. It contains 3 components: Bull component, Bear component and Signal component. A rising Bull component indicates that the market is up-trending while a rising Bear component indicates the presence of down-trending market. Settings: Oscillator period: Specifies the importance of the trends degree of variations measured by the indicator. Signal line per: Moving average period of the Signal line
FREE
A pin bar pattern consists of one price bar, typically a candlestick price bar, which represents a sharp reversal and rejection of price. The pin bar reversal as it is sometimes called, is defined by a long tail, the tail is also referred to as a “shadow” or “wick”. The area between the open and close of the pin bar is called its “real body”, and pin bars generally have small real bodies in comparison to their long tails. The tail of the pin bar shows the area of price that was rejected, and t
FREE
MP Close By Loss Or Profit for MT5 The Reason I made this Expert is because I want traders who already found out how to be profitable in the market use an easier tool throughout their trading days. This Expert will consider your exposure of trades and close them based on profit targets and losses you set for your own Risk Management. I want to thank my friend who helped me on this Expert, and his brilliant work is now shared here with you. A bit of advice after running the expert on your platfo
FREE
MP Inside Bar
Pierre Ksachikian
5 (2)
An “inside bar” pattern is a two-bar price action trading strategy in which the inside bar is smaller and within the high to low range of the prior bar, i.e. the high is lower than the previous bar’s high, and the low is higher than the previous bar’s low. Its relative position can be at the top, the middle or the bottom of the prior bar. The prior bar, the bar before the inside bar, is often referred to as the “mother bar”. You will sometimes see an inside bar referred to as an “ib” and its m
FREE
This utility identifies certain candle open times on chart, this can help you to see your favorite candle open and use it as it fits in your strategy. This tool is very useful for intraday charting and indicating your sessions. ___________________________________________________________________________________ Disclaimer: Do NOT trade or invest based upon the analysis presented on this channel. Always do your own research and due diligence before investing or trading. I’ll never tell you what
FREE
MP Gradient Adaptive RSI oscillator uses AMA with the basic RSI to cover the retracements with minimum lag. Trigger line crossing the oscillator will provide an entry point for trader. Settings: RSI period: period of the oscillator Sensitivity of the oscillator: controls the sensitivity of the oscillator to retracements, with higher values minimizing the sensitivity to retracements. RSI applied price: source input of the indicator Number of bars to draw: is used when the Fill Type option is no
FREE
Candle size oscillator is an easy to use tool to figure out candle size from highest to lowest price of each candle. It's a powerful tool for price action analysts specifically for those who works intraday charts and also a perfect tool for short term swing traders. Kindly note that you can also edit the Bullish and Bearish candles with different colors. #Tags: Candle size, oscillator, price action, price range, high to low, candle ticks __________________________________________________________
FREE
This indicator helps to identify market sessions, It's High/Low, Open Range (OR), range of the sessions in pips and percentage of previous day (change%) under OHLC. It is also editable for any brokerage market watch time. For traders who use session trading strategies such as Mark B. Fisher ACD it can be super effective, where they can edit OR from the settings to either line or box.  We tried to make the settings easier to edit, for traders' use on different markets, charts and brokerage time.
This indicator contains Pivot Levels of: Traditional Fibonacci Woodie Classic Demark Camarilla Calculation periods can be set to auto / Daily / Weekly / Monthly / Yearly. Number of Levels are editable. Options to hide level labels and price labels. Pivots Points are price levels chartists can use to determine intraday support and resistance levels. Pivot Points use the previous days Open, High, and Low to calculate a Pivot Point for the current day. Using this Pivot Point as the base, three resi
MACD (short for M oving A verage C onvergence/ D ivergence) is a popular trading indicator used in technical analysis of securities prices. It is designed to identify changes in the strength, direction, momentum, and duration of a trend in a security's price. History Gerald Appel created the MACD line in the late 1970s. Thomas Aspray added the histogram feature to Appel's  MACD in 1986. The three major components and their formula 1. The MACD line: First, "PM Colored MACD" employs two Moving
Фильтр:
Нет отзывов
Ответ на отзыв