MP Demark Pivot Levels
- Индикаторы
- Версия: 1.0

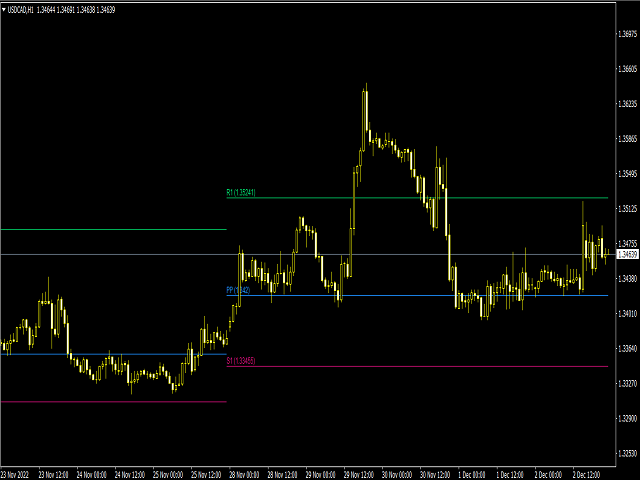
This indicator is stand alone version from MP Pivot Levels (All in one) containing Demark's Pivots.
Calculations:
PP = X / 4
R1 = X / 2 - LOWprev
S1 = X / 2 - HIGHprev
Uses:
- When the pair currency price may change the direction of movement.
- Possible constraints of support and resistance that creates plateaus for the currency pair prices.
- Tendency identification by comparing the present prices according to current day's pivot point and also the prior day's pivot points.
___________________________________________________________________________________
Disclaimer:
Do NOT trade or invest based upon the analysis presented on this channel. Always do your own research and due diligence before investing or trading. I’ll never tell you what to do with your capital, trades or investments. I’ll also never recommend for you to buy, sell, long or short any asset, commodity, security, derivative or cryptocurrency related instrument as it's extremely HIGH RISK! You should always consult with a professional/licensed financial adviser before trading or investing in any type of assets.
Good Indicator. Thanks for sharing. Give it a try