Yearly Candles MT5
- Индикаторы
- Arinze Michael Ejike
- Версия: 1.0
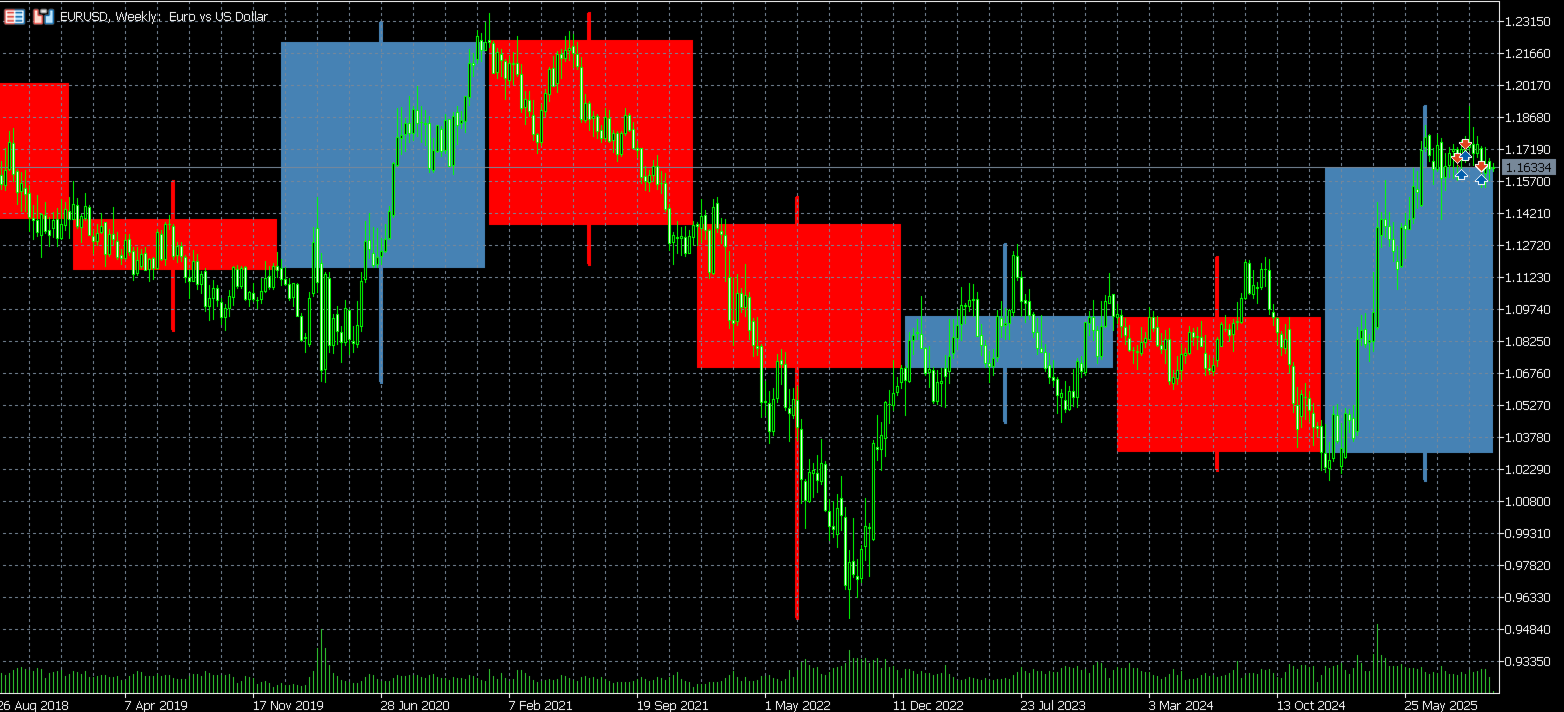
Yearly Candles transforms the way traders analyze long-term market trends by compressing an entire year's worth of price action into a single candlestick formation. Instead of scrolling through hundreds of bars to understand yearly performance, this indicator automatically constructs yearly open, high, low, and close values, displaying them as clear, visual candles directly on your chart. It eliminates the need for manual calculations or switching between timeframes, giving you instant insight into multi-year price behavior and trend strength.
Each yearly candle is automatically color-coded—bullish years appear in steel blue while bearish years are marked in red—making it effortless to identify winning and losing periods at a glance. The indicator plots not just the body of each yearly candle, but also the upper and lower wicks, revealing the full range of price movement throughout the year. This complete picture helps traders spot key resistance and support zones that have held significance over multiple years, as well as identify years where price experienced extreme volatility or tight consolidation.
The visual representation updates automatically as new data arrives, maintaining historical accuracy while adapting to current market conditions. Yearly Candles is particularly valuable for swing traders, position traders, and investors who need to understand the broader market context before making long-term decisions. By overlaying yearly structures on top of your regular chart, you can see exactly how current price action relates to historical yearly patterns, making it easier to anticipate potential breakouts, reversals, or continuation moves based on years of accumulated price behavior.