KT Knoxville Divergence MT5
- Индикаторы
-
KEENBASE SOFTWARE SOLUTIONS
 Welcome to Keenbase Trading,
📢 Join our Telegram for real-time updates & algo trading tips: https://t.me/keenbasetrading - Версия: 1.0
- Активации: 10
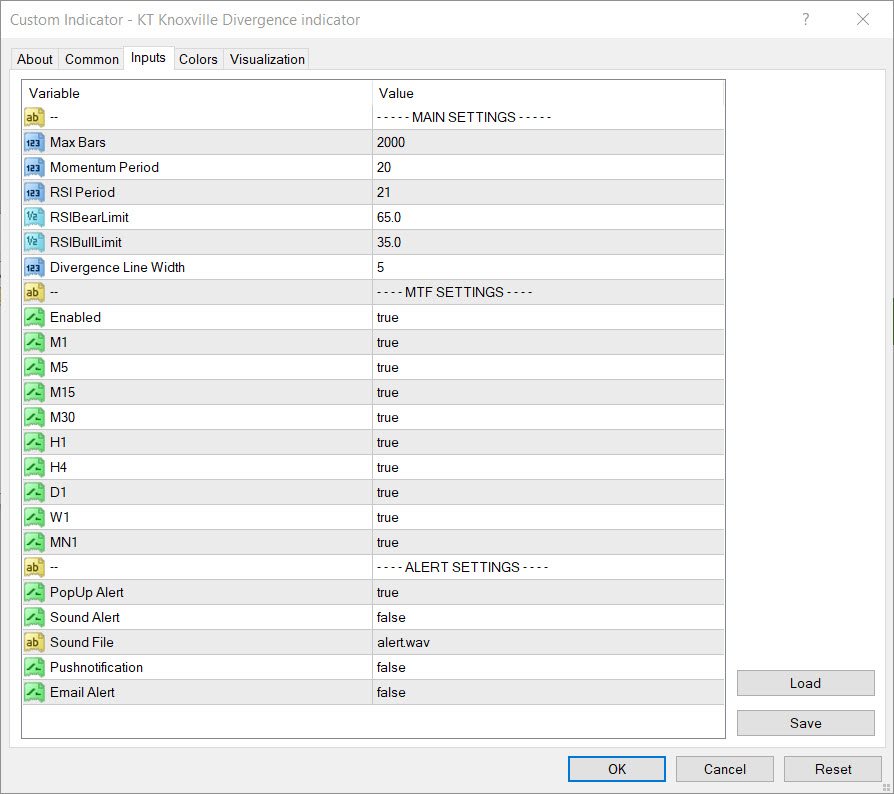
KT Knoxville Divergence — это мощный инструмент, который выявляет уникальные ценовые дивергенции на финансовых рынках, используя тщательно подобранную комбинацию индикатора относительной силы (RSI) и индикатора импульса. Этот индикатор эффективно фиксирует тонкие изменения рыночной динамики и помогает трейдерам точнее находить потенциально прибыльные торговые возможности.
Knoxville Divergence — это тип дивергенции в трейдинге, разработанный Робом Букером. Дивергенция возникает, когда цена актива движется в противоположном направлении по отношению к техническому индикатору (осциллятору). Такое расхождение может служить сигналом к ослаблению текущего тренда и возможному его развороту.
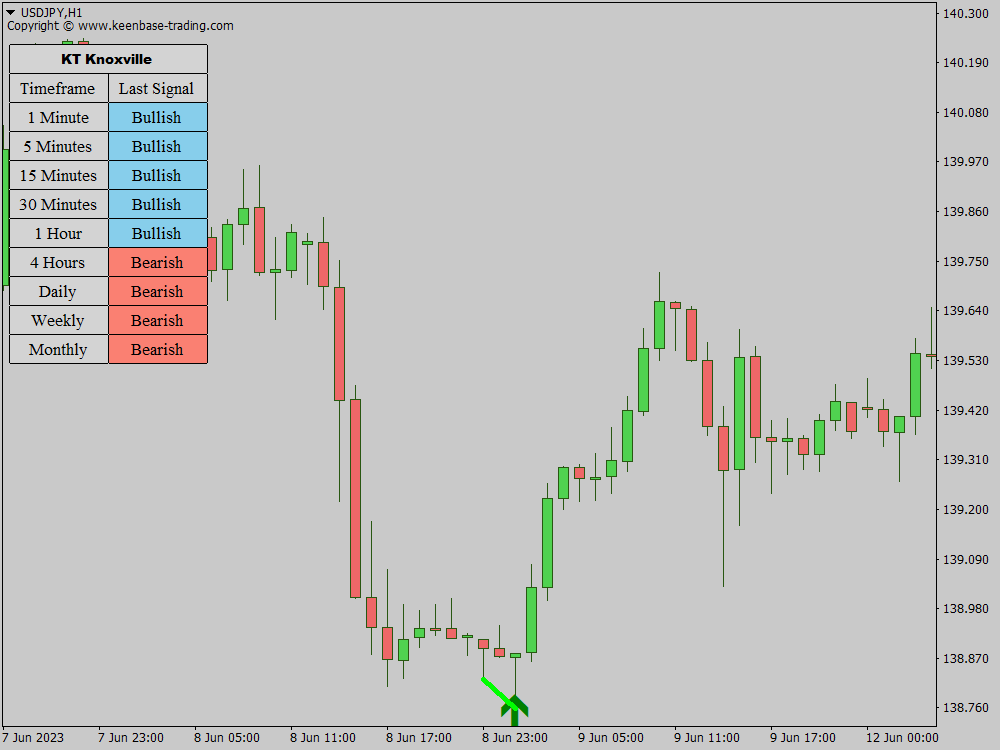
Этот инструмент особенно полезен трейдерам, которые ищут оптимальные точки входа и выхода. Индикатор отображает визуальные сигналы на графике цены каждый раз, когда возникает дивергенция Knoxville.
Понимание дивергенции Knoxville
Дивергенцию Knoxville можно использовать как для торговли против тренда, так и для поиска коротких откатов перед продолжением долгосрочного тренда. Поэтому она считается контртрендовым индикатором. Его формирование основано на двух ключевых компонентах, работающих вместе.
Первый компонент — это индикатор импульса (Momentum). Когда цена актива растет, но импульс начинает падать, это первый признак возможной дивергенции Knoxville. Однако одного импульса недостаточно. Второй обязательный компонент — индекс относительной силы (RSI).
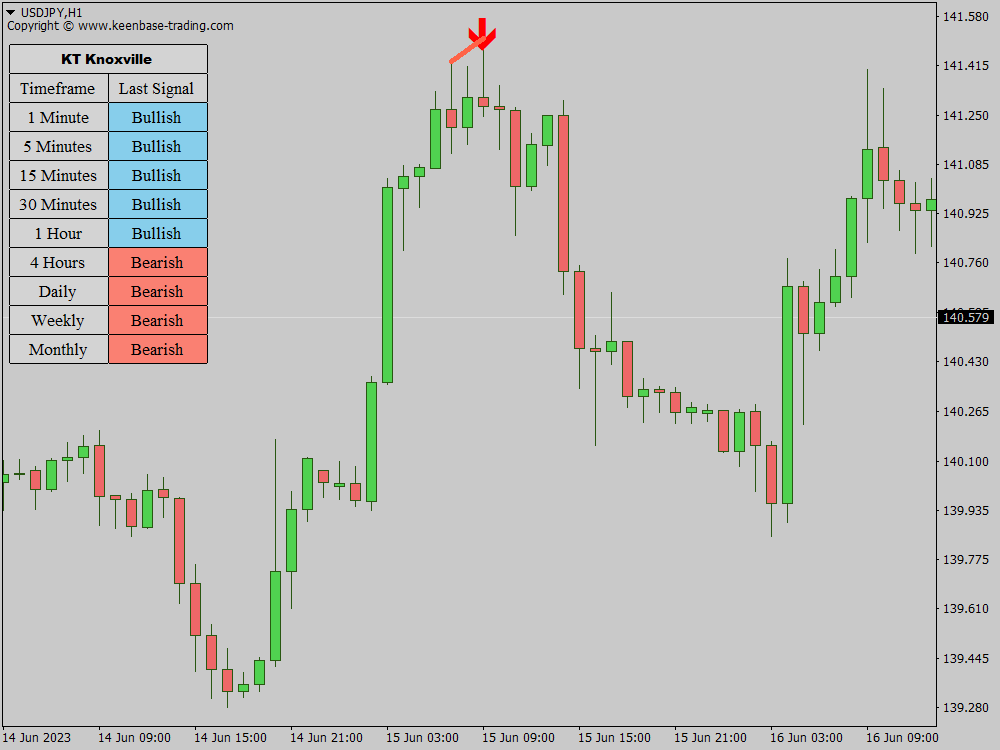
Если в это же время RSI входит в зону перекупленности или перепроданности, это завершает картину и подтверждает дивергенцию Knoxville, после чего на графике появляется линия KD.
Как использовать дивергенцию Knoxville
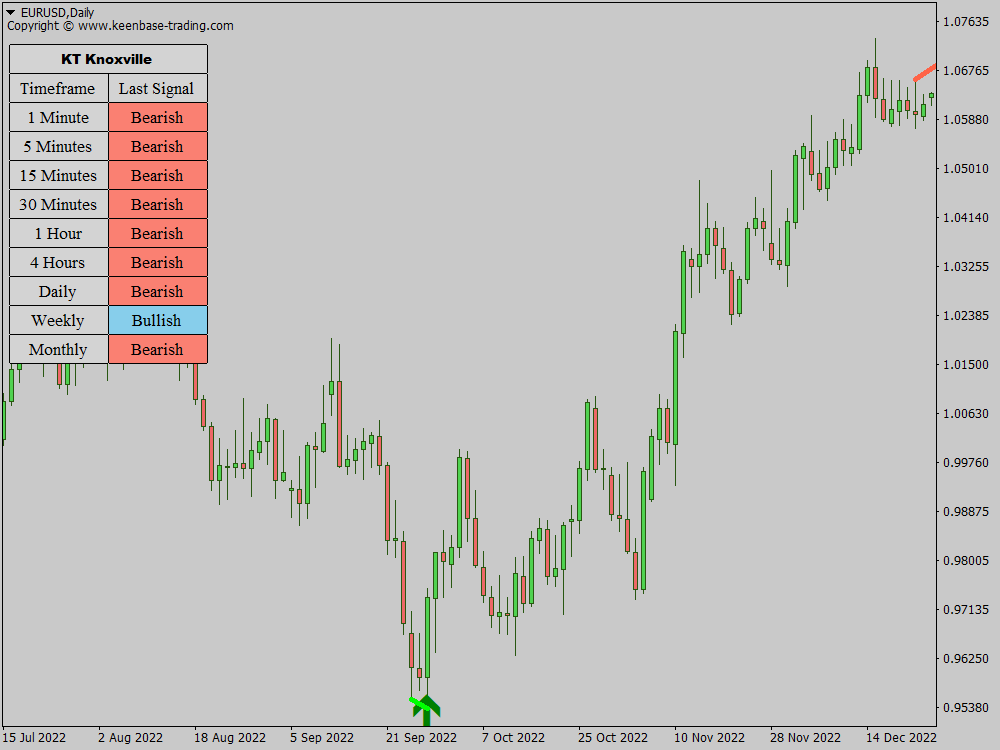
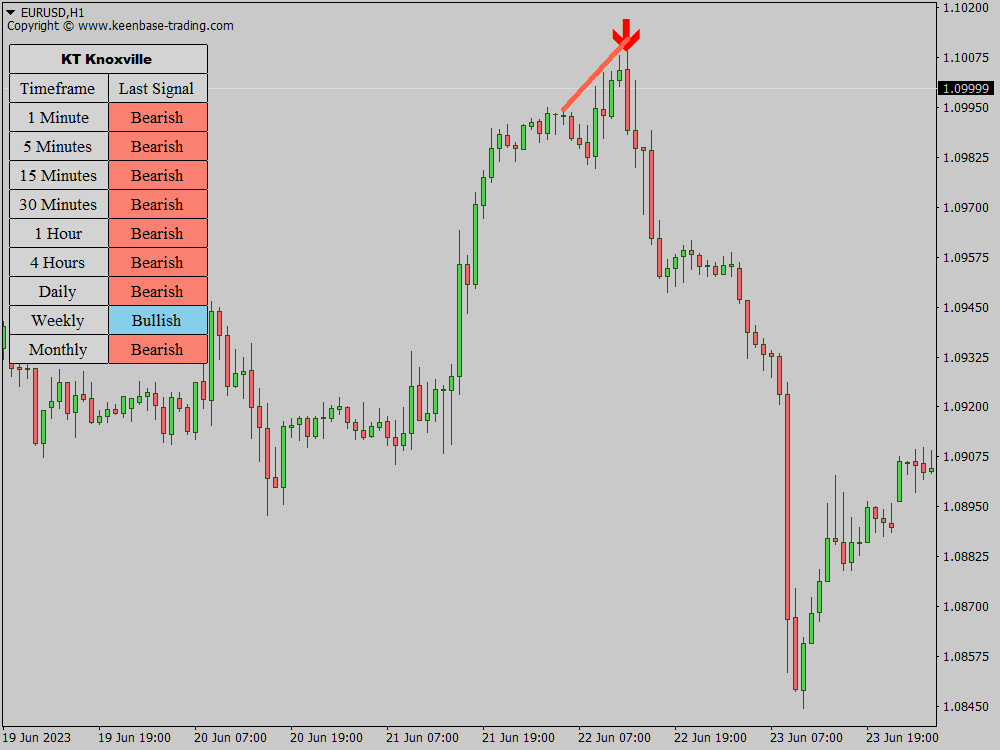
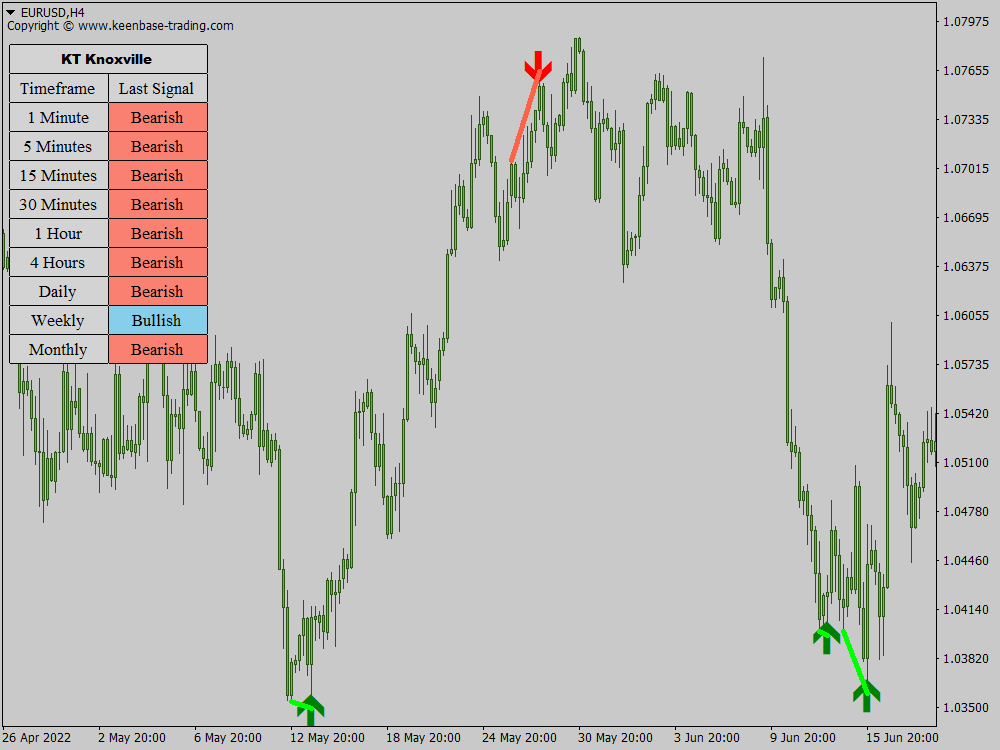
Рассмотрим пример валютной пары на рынке Форекс, например EUR/USD. Допустим, пара находилась в восходящем тренде на 4-часовом графике, и цена стабильно росла несколько дней. Внезапно вы замечаете появление линии дивергенции Knoxville над ценой на графике — первый сигнал возможного разворота.
Для подтверждения сигнала необходимо дополнительно проанализировать свечные модели и проверить два индикатора. Вы видите, что, несмотря на рост цены, индикатор импульса начал снижаться — это первое подтверждение дивергенции.
Одновременно вы проверяете RSI и обнаруживаете, что он вошел в зону перекупленности, что также указывает на вероятный разворот цены. Наличие этих двух признаков (падающий импульс при растущей цене и перекупленный RSI) подтверждает дивергенцию Knoxville, сигнализируя о возможном скором развороте тренда.
На этом основании можно открыть сделку на продажу по EUR/USD, ожидая снижения цены. Контртрендовые трейдеры предпочитают использовать такие сигналы. Обычно устанавливается стоп-лосс выше недавнего максимума (на случай продолжения роста) и тейк-профит на более низком уровне, где ожидается разворот.
Стоит отметить, что данный индикатор успешно работает не только на валютном рынке, но также на акциях, облигациях, фьючерсах, фондах и даже криптовалютах.