MACD Alerts MT5
- Индикаторы
-
KEENBASE SOFTWARE SOLUTIONS
 Keenbase Trading разрабатывает профессиональные индикаторы и советники (Expert Advisors) для MetaTrader 4 и MetaTrader 5, помогая трейдерам принимать более взвешенные торговые решения.
 - Версия: 2.0
- Обновлено: 18 апреля 2022
- Активации: 10
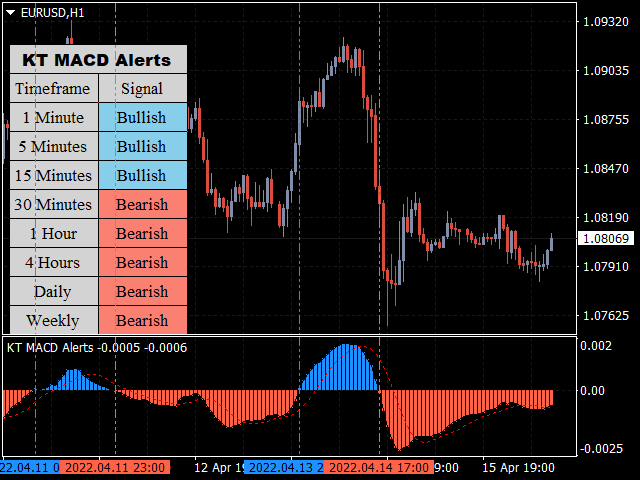
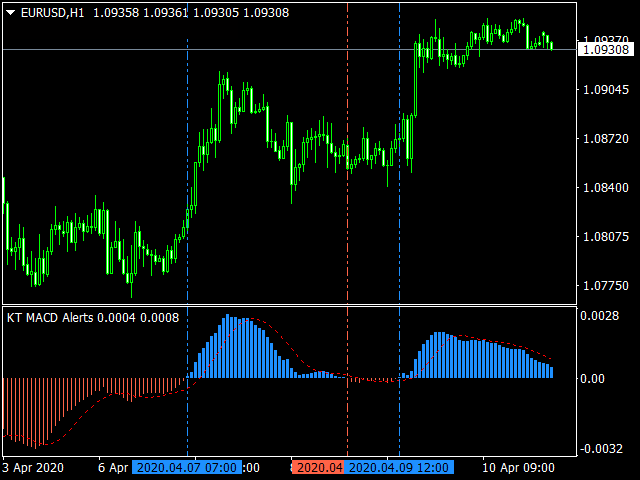
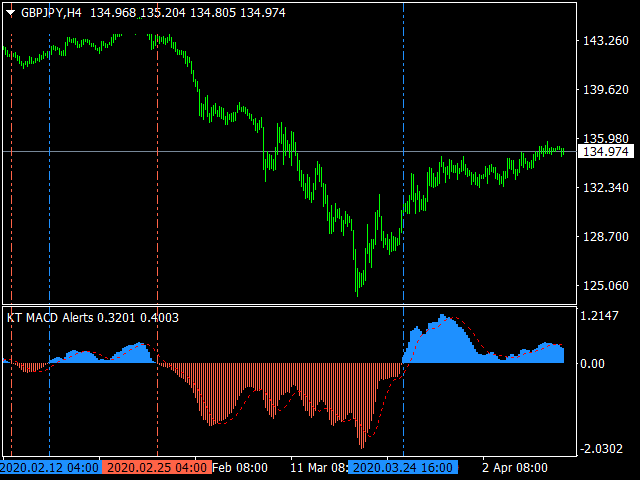
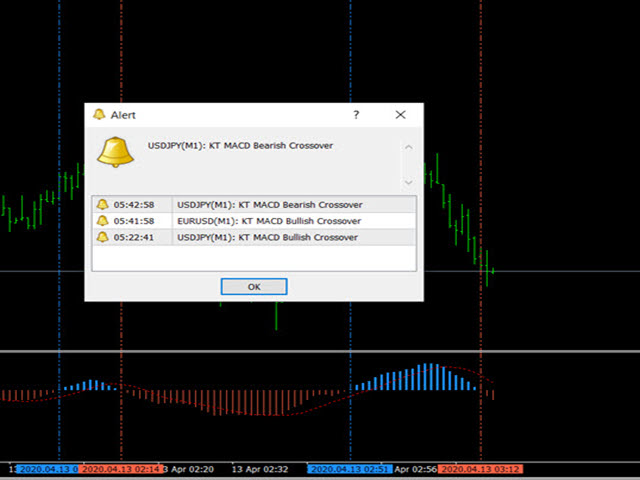
KT MACD Alerts — это персонализированная реализация стандартного индикатора MACD, доступного в MetaTrader. Он отправляет оповещения и также рисует вертикальные линии при следующих событиях:
- Когда MACD пересекает нулевую линию снизу вверх.
- Когда MACD пересекает нулевую линию сверху вниз.
Особенности
- Встроенный мультитаймфреймовый сканер, отображающий направление MACD на каждом таймфрейме.
- Идеален для трейдеров, которые торгуют на пересечениях MACD выше/ниже нулевой линии.
- Помимо оповещений, индикатор также рисует вертикальные линии для более наглядного отображения точек пересечения.
- Легкий по коду индикатор, не требующий больших вычислительных ресурсов.
- Реализует все виды оповещений MetaTrader.
История MACD
Индикатор скользящих средних MACD (Moving Average Convergence Divergence) широко используется в техническом анализе акций. Он был разработан Джеральдом Аппелем в 1970 году. MACD показывает изменения силы, импульса и продолжительности тренда на графике цены актива.

It's Eh, but still deserving of 5 stars. Not like it was BS like many others I have purchased in the past. Regards, DTRH