• Обзор
  • Отзывы (1)
  • Обсуждение (18)
  • Что нового

Fractal Pattern Scanner MT5

5

Introduction to Fractal Pattern Scanner

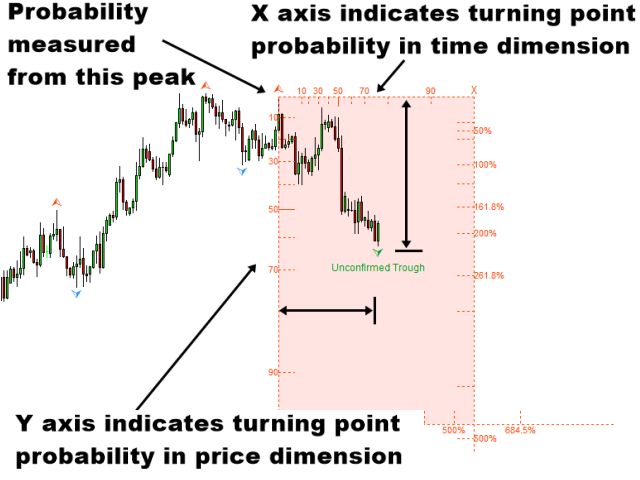
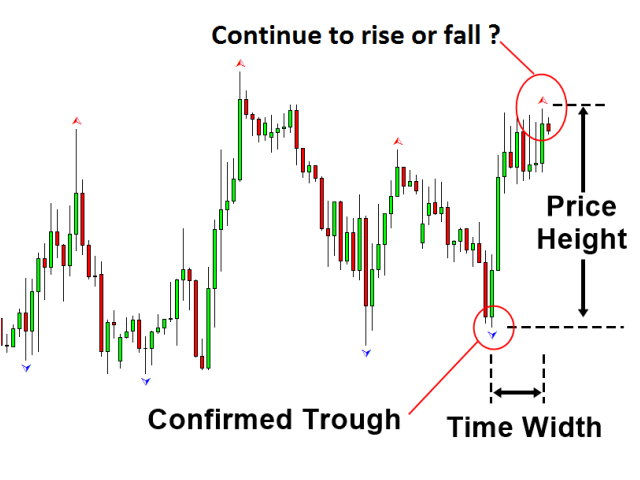
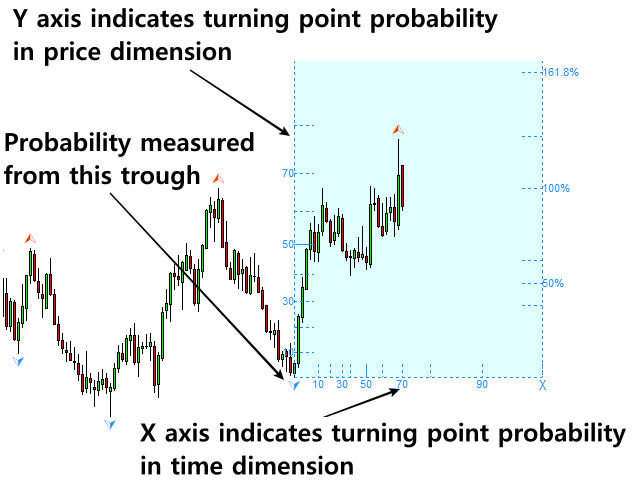
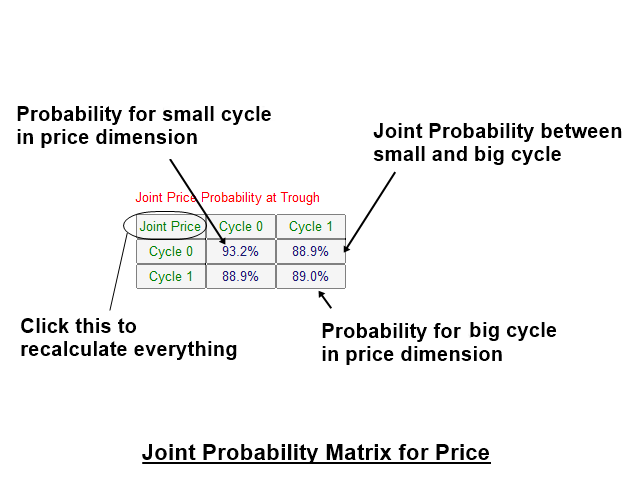
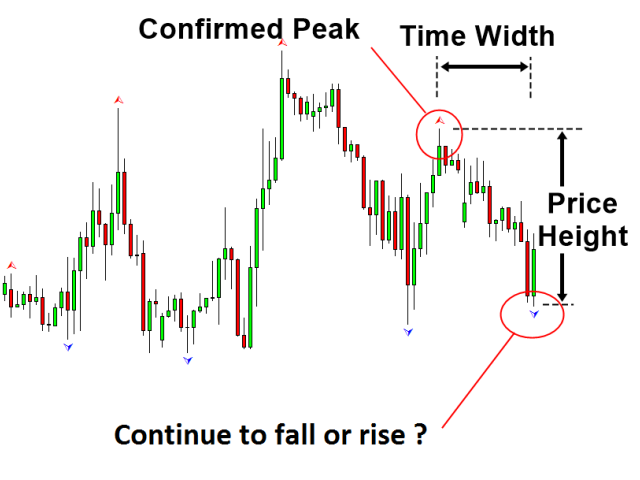
Fractal Indicator refers to the technical indicator that makes use of the fractal geometry found in the financial market. Fractal Pattern Scanner is the advanced Fractal Indicator that brings the latest trading technology after the extensive research and development work in the fractal geometry in the financial market. The most important feature in Fractal Pattern Scanner is the ability to measure the turning point probability as well as the trend probabilty. Your ability to measure the turning point probabilty and trend probabilty for each price action can boost your trading accuracy marginally.


Breakout Trading and Reversal Trading

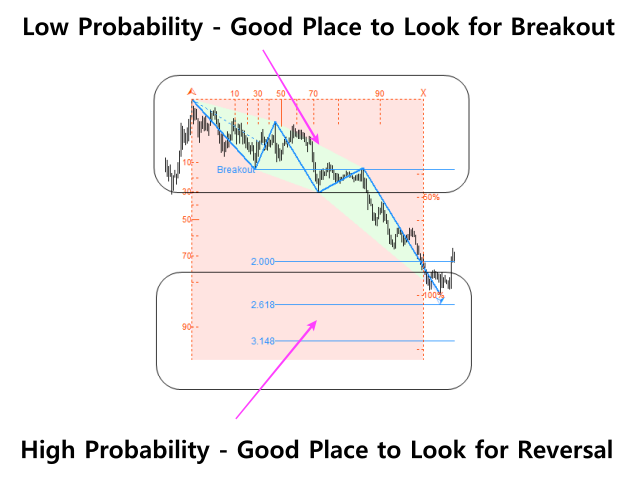
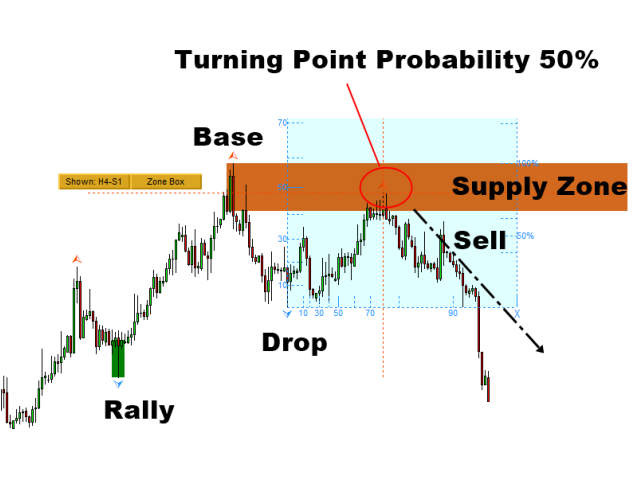
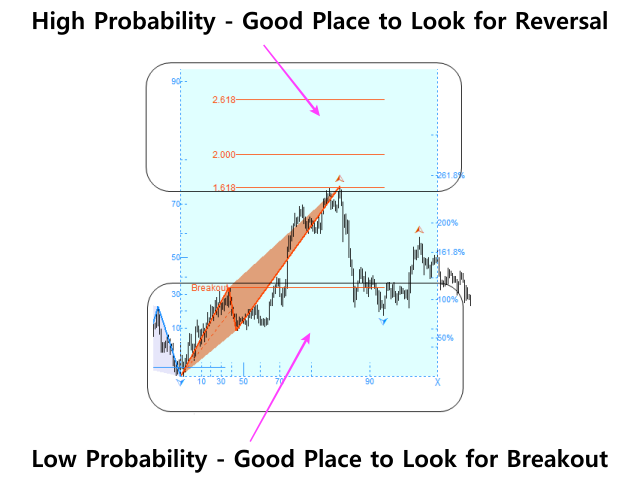
Fractal Pattern Scanner can provide both breakout and reversal trading opportunity. Firstly, you can use the Fractal Pattern Scanner as the pure probability machine to measure the turning point probability. This turning point probability quantifies the price action at every wave in your chart. While you are using the Fractal Pattern Scanner as the pure probability machine, you can access both reversal and breakout trading. You can look for the breakout trading opportunity when the turning point probability is relative low whereas you can look for reversal trading opportunity when the turning point probability is relative high. Secondly, you can ask the Fractal Pattern Scanner to detect the mother wave pattern. Mother wave pattern detection can be considered as the statistical representation of the Elliott Wave Theory. For example, Mother wave pattern detect the pattern inside pattern structure, where small patterns are jagged inside big pattern like the Elliott Wave pattern. With mother wave pattern, you can also perform both breakout and reversal trading.


Main Features

1. Provide the automatic turning point probability measurement in multiple cycles.

2. Provide breakout trading and reversal Trading with wave pattern detection. 

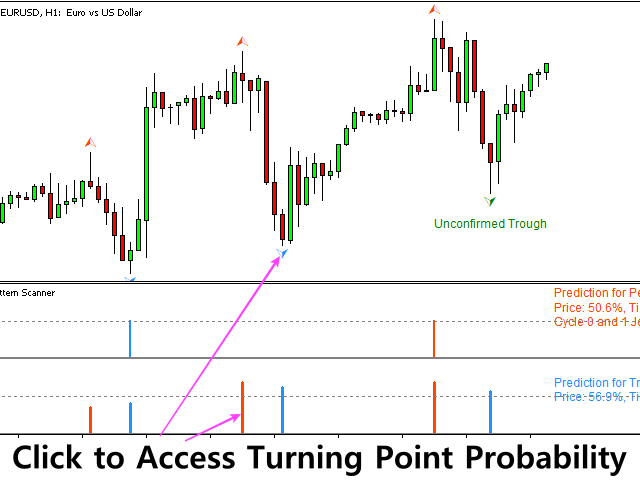
3. Provide the Multiple Timeframe Panel for Turning Point Probability

4. Fibonacci Probability Graph helps to detect the accurate trading opportunity with support and resistance.

5. Automated Gann's Angles (Gann's Fan), the advanced Gann Angles tuned with probability (Bonus and optional feature only).

6. Automated Andrew's Pitchfork (Bonus and optional feature only).


Trading Strategy Guide

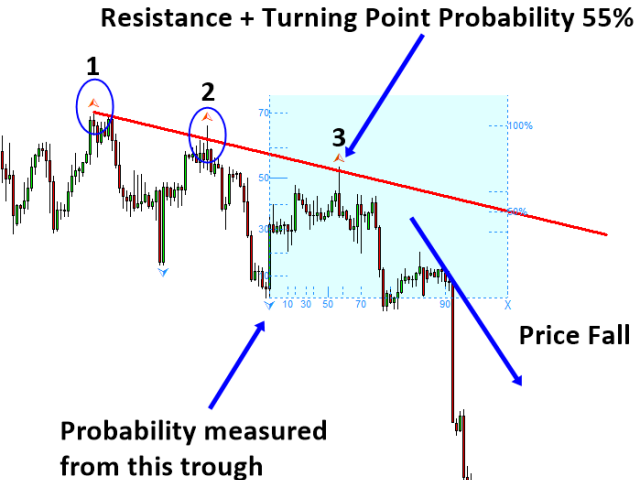
As long as you understand where to search breakout trading and reversal trading opportunity, you can combine the Fractal Pattern Scanner with any other technical analysis for reversal and breakout trading. Especially, you can use any horizontal support and resistance with the turning point probability and trend probability. Altough it is possible to use Fractal Pattern Scanner with diagonal support resistance as well as triangle pattern, rising wedge pattern and falling wedge patterns, we recommend to start with the horizontal support resistance. Simply, it is easy to start with horizontal support resistance. For example, you can use any horizontal support resistance with Fractal Pattern Scanner. 

  • horizontal support resistance
  • supply demand analysis 
  • fibonacci analysis
  • pivot point analysis 
  • round number 
  • and so on

With some hands on experience, you will soon learn how to control your success rate and to do risk management with the turning point probability. In another words, you are transforming your trading into the quantiative trading like the expert does.

Trading Strategy Guide: https://www.mql5.com/en/blogs/post/750345


Buit-in Breakout Trading System

From above trading strategy guide, we have provided the ways to improve the accuracy of the support and resistance analysis with the Fractal Pattern Scanner. However, Fractal Pattern Scanner provides its own breakout trading signal too. It does it by detecting the mother wave and child waves. Especially, we provide this signal across multiple timeframe. Hence, you need to have one Fractal Pattern Scanner for each symbol. Therefor there are multple ways to use the Fractal Pattern Scanner for your trading. 


Important Note

This is the off the shelf product. Therefore, we do not accept any modification or customization request on this product. In addition, we do not provide any code library or any support for your coding for this product.

Отзывы 1
Andrade Machava
68
Andrade Machava 2020.08.18 22:49 
 

This scanner has changed my Trading carrier to Higher highs. With the continuous updates. The winning rate is excellent. I would recommend anyone to test this one. Thanks to the developer.

Рекомендуем также
ИНДИКАТОР, основанный на ИСКУССТВЕННОМ ИНТЕЛЛЕКТЕ, который генерирует возможные записи колл- и пут-опционов для бинарных опционов. Индикатор работает по 3 разным стратегиям: 1) считывая объемы, он посылает сигнал, когда цена должна развернуться 2) через расхождение между ценой и объемом он посылает сигнал, когда тренд должен продолжиться или развернуться. 3) благодаря сближению цены и объема он посылает сигнал о том, что тренд должен продолжиться. Индикатор работает на всех таймфр
Этот индикатор представляет собой идеальный индикатор волнового автоматического анализа для практической торговли! Стандартизированное определение диапазона больше не является волной для разных людей, и рисунок антропогенных помех устранен, что играет ключевую роль в строгом анализе подхода. =》Increase the choice of international style mode, (red fall green rise style)           На данный момент при покупке со скидкой!   Содержание индекса: 1.       Базовая волна:   Сначала мы нашли точ
Swing Volume Profile
Agustinus Biotamalo Lumbantoruan
Are you tired of sifting through endless charts and data to make informed trading decisions? Look no further! The Swing Volume Profile is here to revolutionize your trading experience. With its cutting-edge features, this tool provides you with the insights you need to navigate the dynamic world of financial markets with confidence. Feature 1: Volume Profile Measured from Major Swing High to Major Swing Low   Accurate volume analysis is key to making informed trading decisions. The Swing Volume
It's a multi-symbol and multi-timeframe scanner for our indicator - ACB Breakout Arrows . With default settings, it scans for the buy/sell signals on 28 currency pairs and 9 time-frames concurrently.   Features It can scan 252* combinations of symbols and time-frames from a single chart. Open the signal's chart loaded with a predefined template with a single click.  Easy drag n drop anywhere on the chart. Real-time alerts with popup, sound, push-notifications and email alerts.  Input Para
Disclaimer : Keep in mind that seasonal patterns are not always reliable. Therefore, thoughtful risk management is crucial to minimize losses.  Seasonal patterns in the financial world are like a well-guarded secret that successful investors use to their advantage. These patterns are recurring price movements that occur during specific periods or around special events. Additionally, there are also intraday patterns that repeat. For example, Uncle Ted from Forex Family suggests examining previou
Harmo EA
Matteo Schizzerotto
Вы когда-нибудь хотели иметь торгового помощника, который мог бы автоматически определять прибыльные гармонические модели? Мы с гордостью представляем наш инновационный советник, основанный на гармоничных закономерностях мира Форекс. НАЙДИТЕ ЖИВЫЕ СИГНАЛЫ ЗДЕСЬ: MARTINGALE  https://www.mql5.com/en/signals/ 2175074 FIX LOT  https://www.mql5.com/en/signals /2177470 <ул> <дел> <дел> Наш экспертный советник — это сложное программное обеспечение, основанное на передовых алгоритмах, специально раз
Five Candles Pattern MT5
Miguel Antonio Rojas Martinez
Индикатор Five Candle Pattern - это новый взгляд на рынок, так как с его помощью мы можем сравнить и/или увидеть развитие паттерна на последних 4 или 5 свечах, а также увидеть их на одном графике и оценить свое поведение в прошлом. Индикатор создает паттерн из этих 4 или 5 свечей и ищет, определяет и отмечает подобные формирования или паттерны в прошлом. Располагая такой информацией, вы сможете улучшить свою рабочую стратегию или создать новую, так как теперь можно сравнить развитие текущего пат
Elite SR - индикатор продвинутого уровня для автоматического определения уровней поддержки и сопротивления с разной степенью достоверности должен стать частью вашего торгового арсенала. Этот индикатор доступен через функцию iCustom и предоставляет значения уровней, а также степень их достоверности. Elite SR полностью настраивается и может работать на любом таймфрейме с любым торговым инструментом! Важная информация Подробную информацию об этом индикаторе вы можете найти на сайте 747Developmen
This is a simple arrow system based on Engulfing Candlestick Pattern. It gives you alerts on your smartphone when there is an engulfing candlestick pattern happens. Which type of alerts available? 1. It paints on chart Up/Down Arrows. 2. Popup message and sound alert in trading terminal window. 3. Push notification or Alert on your Android and IOS mobile phones (requires MT4 or MT5 app installed!) *Note: Use it on higher timeframes like H4 (4 hours), D1 (1 Day) then find trade opportunities on s
This indicator accurately identifies and informs market reversals and continuation patterns by analyzing and signaling the Three White Soldiers / Three Black Crows pattern. It also offers a  "real-time backtesting"  panel in the indicator itself in a way that every change made on the indicator parameters will immediately show the user how many signals are occurred, how many take profits and stop losses were hit and, by having these informations, the Win Rate and the Profit Factor of the setup b
The indicator determines a special pattern of Joe Dinapoli. It gives very high probability buy and sell signals. Indicator does not repaint. Indicator Usage Buy Signal ''B'' Entry : Market buy order at signal bar close Stop : Low of signal bar Take Profit : First swing high Sell Signal ''S'' Entry : Market sell order at signal bar close Stop : High of signal bar Take Profit : First swing low Indicator Parameters Fast EMA : External Parameter (should be kept as default) Slow EMA: External Param
KT Candlestick Patterns Scanner is a Multi-Symbol and Multi-Timeframe scanner that fetches and shows various candlestick patterns on 28 currency pairs and 9 time-frames concurrently . The scanner finds the candlestick patterns by loading the KT Candlestick Patterns indicator as a resource in the background. Features The scanner can find the candlestick patterns on 252* combinations of symbols and time-frames from a single chart. Open the signal's chart loaded with a predefined template with
Go Binary
Fabio Oliveira Magalhaes
The main idea of this product is to generate statistics based on signals from 5 different strategies for the Binary Options traders, showing how the results would be and the final balance based on broker's payout. Strategy 1: The calculation is secret. Strategy 2: The signal is based on a sequence of same side candles (same color). Strategy 3: The signal is based on a sequence of interspersed candles (opposite colors). Strategy 4: The signal consists of the indicators bollinger (we have 3 typ
TREND HARMONY MT5 – Multi Timeframe Trend and Phase and Pullback Level Visualizer indicator for Metatrader5 The TREND HARMONY indicator automates deep trend analysis and generates visualizations for you. Take control of your trades by eliminating uncertainty! Revolutionize your trading experience with precision and insight through the TREND HARMONY Multi Timeframe indicator – your ultimate MT5 trend visualization indicator. [  Features and Manual   | MT4 version |   All Products   ] Are you t
The new update makes this indicator a complete tool for studying, analyzing and operating probabilistic patterns. It includes: On-chart Multi-asset percentage monitor. Configurable martingales. Twenty-one pre-configured patterns, including Mhi patterns and C3. An advanced pattern editor to store up to 5 custom patterns. Backtest mode to test results with loss reports. Trend filter. Hit operational filter. Martingale Cycles option. Various types of strategies and alerts. Confluence between patter
Устройство подачи отката проверяет возможности отката после того, как произошло первое движение.  Лучше всего работает с 15-метрового графика и выше. В основном он сканирует вторую волну тренда, что делает его более прибыльным. Работает с любым финансовым инструментом,  Он не перекрашивает/не меняет цвет или не отменяет стрелки, прост в настройке и использовании. Вступительная цена: СКИДКА 50%   MT4 version:  https://www.mql5.com/en/market/product/67443 Как это работает Индикатор основан на
Xtrade Trend Detector is an indicator capable of finding the best opportunities to take a position in any stock market. Indeed, it is a great tool for scalpers but also for Daytraders. You could therefore use it to identify areas to trade, it fits easily on a chart. I use it to detect trends on Big timeframes and take positions on Small timeframes. Don't hesitate to give me a feedback if you test it.
ГАРМОНИЧЕСКИЕ ПАТТЕРНЫ OSW MT5 Этот индикатор отвечает за обнаружение гармонических паттернов, чтобы вы могли работать с ними, давая вам сигнал, чтобы вы могли добавить ручной анализ, принимаете ли вы ордер или нет. Среди гармонических паттернов, которые обнаруживает индикатор: >гартли >летучая мышь >Бабочка >краб >Акула Среди функций, которые вы можете найти: > Генерировать оповещения на почту, мобильный телефон и ПК > Меняйте цвета гармоник, как при покупке, так и при прод
Индикатор ABCDE Этот индикатор основан на первичных abc-шаблонах ценового движения (то есть прорыв, откат, движение). Эти шаблоны напоминают шаблон ралли-основание-ралли, и для выдачи точного сигнала проверяются такие анализы, как анализ тренда и анализ расхождения. Он обеспечивает достаточно точные торговые сигналы и сообщает вам, когда лучше открывать и закрывать сделки. Он может быть применен к любому финансовому активу: форекс, криптовалюты, металлы, акции, индексы. Основные возможности
This indicator will draw patterns based on   Rob Smith's   The Strat   as they emerge in real time on your chart. As price evolves,   TheStrat   offers 18 distinct price action patterns that can help you get good entries in the market. Each pattern involves two or three candles, and this indicator will draw a bounding box around the candles and name the pattern. The indicator also shows when a potential setup is forming, known by stratters as an Actionable signal. Candles Each candle is de
Smart Binary Volume
Thalles Nascimento De Carvalho
Индикатор Smart Binary Volume представляет собой универсальный инструмент, объединяющий анализ торгового объема с машинным обучением. Он может быть применен на различных рынках и стратегиях, включая скальпинг и другие виды краткосрочных сделок. С помощью передовых алгоритмов машинного обучения, данный индикатор выявляет сложные паттерны, обеспечивая более точные сигналы на покупку и продажу. Buffer to Create EA. Buffer Line Gold = 0. Buffer Line Red = 2 Buffer   AI  =  3 AI Buffer  >=  0  ("
My PVSR
Ashok Kumar Singha
My PVSR   is based on All Type of Pivot Points. Use this Indicator to get proper Support / Resistance Zone and Trade accordingly.. Recommendation: Use this Indicator along with my another Indicator --->>> Dr. Trend   <<<--- Click Here ; To get the best output result feel free to contact me ; Best of Luck It can be used for: All Pairs: Forex, Cryptocurrencies, Metals, Stocks, Indices etc. All Timeframe All Brokers All type of Trading Style like Scalping, Swing, Intraday, Short-Term, Lon
Configure scaffolding charts and signals based on the scissor pattern, which works great at low times. Buy and sell signs based on 2 previous candle patterns It works on the active time form, and when detecting the pattern in 4 time frames, 5 minutes, 15 minutes, 30 minutes and one hour, the alert can be set to notify us of the formation of this pattern. MetaTrader version 4 click here How to use: When there is an opportunity to buy or sell, the marker places a scissors mark on
Skiey
Vitalii Zakharuk
Skiey - Индикатор простых решений! Использовать этот индикатор очень просто, поскольку самый простой - это посмотреть на график и действовать согласно показаниям цветных стрелок. Подобный вариант рассчета учитывает внутри дневные колебания цены и делает упор на измерение "свечной" доли в тренде.  Алгоритм учитывает измерение цен, также данном методе  делается упор на измерение каждого из перепадов цены (H/C, H/O,LC,LO) - что дает более детализированную информацию но так же и более усредненную
KT Pin Bar MT5
KEENBASE SOFTWARE SOLUTIONS
KT Pin Bar identifies the pin bar formation which is a type of price action pattern which depicts a sign of reversal or rejection of the trend. When combined with support and resistance, BRN and other significant levels, Pin Bar pattern proved to be a very strong sign of reversal. Basically, a pin bar is characterized by a small body relative to the bar length which is closed either in upper or lower 50% part of its length. They have very large wicks and small candle body. A pin bar candlest
Surf Board
Mohammadal Alizadehmadani
Benefits of the Surfboard indicator : Entry signals without repainting If a signal appears and is confirmed, it does NOT disappear anymore, unlike indicators with repainting, which lead to major financial losses because they can show a signal and then remove it. perfect opening of trades The indicator algorithms allow you to find the Peak and floor position to enter a deal (buy or sell an asset), which increases the success rate for each and every trader using it. Surfboard works with any asse
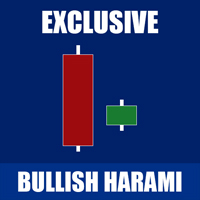
The   Bullish Harami candlestick pattern   is formed by two candles. Here’s how to identify the Bullish Harami candlestick pattern: The first candle must be bearish and have a big body The second candle must be small and bullish The second candle is inside the body of the first candle This 2-candle bullish candlestick pattern is a reversal pattern, meaning that it’s used to find bottoms. For this reason, we want to see this pattern after a move to the downside, showing that bulls are starting t
This is the famous Sunflower indicator for Metatrader5. This indicator marks possible tops and bottoms on price charts. The indicator identifies tops and bottoms in the asset's price history, keep in mind that the current sunflower of the last candle repaints, as it is not possible to identify a top until the market reverses and it is also not possible to identify a bottom without the market stop falling and start rising. If you are looking for a professional programmer for Metatrader5, please
Представляем индикатор энтузиазма тренда (TEI), идеальный инструмент для максимизации прибыли на торговой площадке. Этот инновационный индикатор сочетает в себе силу анализа тренда с волнением рыночных настроений, предоставляя трейдерам уникальное преимущество на постоянно меняющихся финансовых рынках. TEI использует передовые алгоритмы для анализа основного тренда финансового инструмента и энтузиазма трейдеров для выявления возможностей получения высокой прибыли. Это позволяет трейдерам из
The Candlestick Patterns indicator for MT5 includes 12 types of candlestick signales in only one indicator. - DoubleTopsAndBottoms - SmallerGettingBars - BiggerGettingBars - ThreeBarsPlay - TwoBarsStrike - Hammers - InsideBars - OutsideBars - LongCandles - TwoGreenTwoRed Candles - ThreeGreenThreeRed Candles The indicator creats a arrow above or under the signal candle and a little character inside the candle to display the type of the signal. For long candles the indicator can display the exac
С этим продуктом покупают
Прежде всего стоит подчеркнуть, что этот торговый индикатор не перерисовывается, не перерисовывает и не отставает, что делает его идеальным как для ручной, так и для роботизированной торговли. Атомный аналитик - это индикатор ценового действия PA, который использует силу и импульс цены, чтобы найти лучший край на рынке. Оборудованный расширенными фильтрами, которые помогают убирать шумы и ложные сигналы, и повышают торговый потенциал. Используя несколько слоев сложных индикаторов, Атомный анали
FX Volume MT5
Daniel Stein
4.94 (17)
Получайте ежедневную информацию о рынке с подробностями и скриншотами в нашем утреннем брифинге здесь, на mql5 , и в Telegram ! FX Volume - это ПЕРВЫЙ и ЕДИНСТВЕННЫЙ индикатор объема, который дает РЕАЛЬНОЕ представление о настроении рынка с точки зрения брокера. Он дает потрясающее представление о том, как институциональные участники рынка, такие как брокеры, позиционируют себя на рынке Forex, гораздо быстрее, чем отчеты COT. Видеть эту информацию прямо на своем графике - это настоящий геймчей
Этот индикатор является уникальным, качественным и доступным инструментом для торговли, включающим в себя наши собственные разработки и новую формулу. В обновленной версии появилась возможность отображать зоны двух таймфреймов. Это означает, что вам будут доступны зоны не только на старшем ТФ, а сразу с двух таймфреймов - таймфрейма графика и старшего: отображение вложенных зон. Обновление обязательно понравится всем трейдерам, торгующим по зонам спроса и предложения. Важная информация Для мак
Step into the realm of Forex trading with confidence and precision using XQ, a cutting-edge Forex indicator designed to elevate your trading game to unprecedented heights. Whether you're a seasoned trader or just stepping into the world of currency exchange, XQ Forex Indicator empowers you with the insights and signals needed to make informed trading decisions. The signal conditions are a combination of three indicators, and XQ Forex Indicator only display  medium and long-term trends . The ind
Индикатор Gann Squares представляет собой мощный инструмент для анализа рынка, основанный на математических концепциях, представленных W.D. Gann в его статье "Математическая формула для прогнозирования рынка." Этот индикатор включает в себя техники Ганна, связанные с квадратными числами, такими как 144, 90 и 52, а также Квадрат 9. Кроме того, он включает метод по использованию Квадрата 9 в сочетании с каналами и паттерном звезды. Руководство пользователя и использование: Перед использованием это
40% СКИДКА НА РОЖДЕСТВО! ПОВЫШЕНИЕ ЦЕНЫ ДО $250 С 1 ЯНВАРЯ! Представляем GoldenGate Entries: Революционное Торговое Решение! Откройте для себя революционный подход к торговле с GoldenGate Entries (GGE), передовым индикатором, разработанным для повышения вашего опыта торговли. GGE предоставляет обширный набор функций, чтобы предоставить пользователям точность и уверенность в их торговых решениях. Пары: Любые (валюты - товары - акции - акции - криптовалюты) Таймфреймы: 15 минут до H1 Ос
Bill Williams Advanced предназначен для автоматического анализа графика по системе " Profitunity " Билла Уильямса. Индикатор анализирует сразу четыре таймфрейма. Инструкция/Мануал ( Обязательно читайте перед приобретением ) Преимущества 1. Автоматически анализирует график по системе "Profitunity" Билла Уильямса. Найденные сигналы помещает в таблицу в углу экрана. 2. Оснащён трендовым фильтром по индикатору Аллигатор. Большинство сигналов системы рекомендуется использовать только по тренду.
note: this indicator is for METATRADER4, if you want the version for METATRADER5 this is the link:  https://www.mql5.com/it/market/product/108106 TRENDMAESTRO recognizes a new TREND in the bud, he never makes mistakes. The certainty of identifying a new TREND is priceless. DESCRIPTION TRENDMAESTRO identifies a new TREND in the bud, this indicator examines the volatility, volumes and momentum to identify the moment in which there is an explosion of one or more of these data and therefore the mome
Профессиональный Инструмент для Скальпинга на Deriv Внимание! Индикатор будет продан в ограниченном количестве!!! Описание: Этот торговый индикатор предназначен для профессиональных трейдеров, ориентированных на скальпинг. Разработанный с учетом особенностей рынка, он предоставляет высокоточные сигналы для торговли в сторону спайков. Работает на таймфрейме М1 и поддерживает следующие символы: Boom 300 Index, Boom 500 Index, Boom 1000 Index, Crash 300 Index, Crash 500 Index, Crash 1000 Index
IVISTscalp5
Vadym Zhukovskyi
5 (3)
Представляем вам индикатор iVISTscalp 5 , который не только уникален, но и эффективен в использовании при анализе торговых операциях. Этот индикатор основывается на временных данных и является результатом многолетнего опыта и глубокого анализа финансовых рынков. Индикатор iVISTscalp 5 отличный помощник для ручной торговли. Удобство, простота и визуализация. Все самое сложное спрятано внутри. Мы максимум упростили настройки и использование индикатора iVISTscalp 5 . Индикатор подходит для всех
VTrende Pro
Andrii Diachenko
5 (1)
VTrende Pro - МТФ индикатор для трендовой торговли с панелью индикации для МТ5 !!! - Подробное описание на русском языке под видео (на Youtube) - !!! Хотя сигналы индикатора VTrende Pro можно использовать, как сигналы полноценной торговой системы, рекомендуется применять их в связке с ТС Билла Вильямса. VTrende Pro - это расширенная версия индикатора VTrende . Отличие Pro версии от VTrende: - Временные зоны - Сигнал V - сигнал 1-2 волн Основная задача индикатора - определить точки изм
Свинг-трейдинг - это первый индикатор, предназначенный для обнаружения колебаний в направлении тренда и возможных разворотов. Он использует базовый подход свинговой торговли, широко описанный в торговой литературе. Индикатор изучает несколько векторов цен и времени для отслеживания направления совокупного тренда и выявляет ситуации, когда рынок перепродан или перекуплен и готов к исправлению. [ Руководство по установке | Руководство по обновлению | Устранение неполадок | FAQ | Все продукты ]
SMCpro MT5  Original Price  $440   ---  Currently Price  40% OFF  ( for unlimited use ) Hello World! Introducing.. SMCpro tool and Indicator for  MetaTrader 5 , a cutting-edge feature designed to revolutionize your trading experience. With innovative ICT Smart Money Concept, you gain unparalleled insight into market dynamics, empowering you to make informed trading decisions like never before. Built on the foundation of advanced algorithms and real-time data analysis, SMCpro tool and Indicat
[ MT4 Version ] Backtesting Simulator Are you tired of spending months on demo or live accounts to test your trading strategies? The Backtesting Simulator is the ultimate tool designed to elevate your backtesting experience to new heights. Utilizing Metatrader historical symbol information, it offers an unparalleled simulation of real market conditions. Take control of your testing speed, test ideas quickly or at a slower pace, and witness remarkable improvements in your testing performance.
Weis Wave with Alert MT5
Trade The Volume Waves Single Member P.C.
4.93 (15)
Rental/Lifetime Package Options and Privileges  * For optimum results the yearly or lifetime package is suggested due to live training ! Rent Monthly Six Months   Yearly/Lifetime Weis Wave with Speed with Alert+Speed Index x x x Manual  x x x Quick Set up Video x x x Blog x x x Lifetime Updates x x x Setup and Training Material x x Free Rectangle Break Alert Tool      x Discord Access Channel "The SI traders" x 2-hour live methodology training x How to trade with it:    http://
Это, пожалуй, самый полный индикатор автоматического распознавания гармонического ценообразования, который вы можете найти для платформы MetaTrader. Он обнаруживает 19 различных паттернов, воспринимает проекции Фибоначчи так же серьезно, как и вы, отображает зону потенциального разворота (PRZ) и находит подходящие уровни стоп-лосс и тейк-профит. [ Руководство по установке | Руководство по обновлению | Устранение неполадок | FAQ | Все продукты ] Он обнаруживает 19 различных гармонических цен
RAD CRITICAL LEVES RAD indicator tracks “Relevant Volume” in real time, identifying accumulation and distribution processes, projecting them in the chart as SUPPORT or RESISTANCE zones. Natural   support   and resistance levels are generated by Volume Accumulation and Distribution processes. As these processes evolve, levels at which the relevant volume in the market place is positioned, become difficult areas to cross upwards or downwards. By using this information, traders can identify very s
Сложно найти и дефицит по частоте, дивергенции являются одним из самых надежных торговых сценариев. Этот индикатор автоматически находит и сканирует регулярные и скрытые расхождения, используя ваш любимый осциллятор. [ Руководство по установке | Руководство по обновлению | Устранение неполадок | FAQ | Все продукты ] Легко торговать Находит регулярные и скрытые расхождения Поддерживает много известных генераторов Реализует торговые сигналы на основе прорывов Отображает подходящие уровни ст
«Пиранья» - автономная торговая система, определяющая уровни перекупленности и перепроданности на графике. Красная и синяя зоны отображают уровни перекупленности и перепроданности соответственно. Вход в сделку обозначен стрелками: стрелка вниз в красной зоне для "sell" и стрелка вверх в синей зоне для "buy". Уровень Тейк профита обозначен зеленой средней скользящей. Важные особенности: Регулировка уровня Тейк профита при изменении положения зеленой средней скользящей. Возможность усреднения пр
Big Player Range
Thalles Nascimento De Carvalho
5 (2)
Добро пожаловать в индикатор "BigPlayerRange" - инструмент технического анализа, разработанный для выявления значительных областей интереса финансовых учреждений на рынках. Этот индикатор обеспечивает точный анализ ценовых диапазонов, в которых крупные участники рынка проявляют значительную активность и интерес. Основные характеристики: 1. Картирование Областей Институционального Интереса: "BigPlayerRange" точно выделяет области графика, где финансовые учреждения проявляют сильную активнос
Introduction to X3 Chart Pattern Scanner X3 Cherart Pattern Scanner is the non-repainting and non-lagging indicator detecting X3 chart patterns including Harmonic pattern, Elliott Wave pattern, X3 patterns, and Japanese Candlestick patterns. Historical patterns match with signal patterns. Hence, you can readily develop the solid trading strategy in your chart. More importantly, this superb pattern scanner can detect the optimal pattern of its kind. In addition, you can switch on and off individu
Мультивалютный, мультитаймфреймный, индикатор гармонического паттерна AB=CD. Поддерживает отправку push-уведомлений о сигналах на мобильное устройство, сообщений на и-меил, а также, сообщений с помощью алертов, на всех доступных валютных парах и таймфреймах. Данный индикатор был создан на основе индикатора Harmonic ABCD Universal . Версия для MetaTrader 5:  https://www.mql5.com/ru/market/product/44972 . Смотре также: Harmonic ABCD Universal для MetaTrader 4 . Использование современных методов ра
Индикатор предназначен для того, чтобы вовремя закрывать позиции по рынку. Например: досрочно фиксировать прибыль, если цена не достигла TakeProfit, а рынок разворачивается. Индикатор анализирует импульс, а не тренд. О тренде никакой информации он не дает. Индикатор хорошо подходит для поиска дивергенции. Индикатор Ershov 38 Parrots динамически подстраивается под рынок и выявляет импульсы движения цены средней и высокой амплитуды. На мелкие скачки цены почти не реагирует.  Принципиальное о
MetaForecast M5
Vahidreza Heidar Gholami
5 (2)
MetaForecast предсказывает и визуализирует будущее любого рынка на основе гармонии в данных о ценах. Хотя рынок не всегда предсказуем, если существует узнаваемый паттерн в ценах, то MetaForecast способен предсказать будущее с наибольшей точностью. По сравнению с другими аналогичными продуктами, MetaForecast способен генерировать более точные результаты, анализируя тренды на рынке. Входные параметры Past size (Размер прошлых данных) Указывает количество баров, которые MetaForecast использует дл
Этот индикатор представляет собой метод анализа рынка, основанный на статье «Математическая формула для прогнозов рынка», написанной У.Д. Ганном, в зависимости от метода квадрата девяти и квадрата 144. Руководство пользователя: Add Your review And contact us to get it Вы можете купить полную версию MT4 у: https://www.mql5.com/en/market/product/15316 Вы можете бесплатно протестировать на МТ4: https://www.mql5.com/en/market/product/15320?source=Site +Profile+Seller#!tab=reviews
Trend Trading - это индикатор, предназначенный для получения максимальной прибыли от трендов, происходящих на рынке, путем определения времени отката и прорыва. Он находит торговые возможности, анализируя, что делает цена во время установленных тенденций. [ Руководство по установке | Руководство по обновлению | Устранение неполадок | FAQ | Все продукты ] Торгуйте на финансовых рынках с уверенностью и эффективностью Прибыль от устоявшихся тенденций без проволочек Признать прибыльные откаты,
Elliot Waves Analyzer Pro calculates Elliot Waves to Help Identify Trend direction and Entry Levels. Mainly for Swing Trading Strategies. Usually one would open a Position in trend direction for Wave 3 or a Correction for Wave C . This Indicator draws Target Levels for the current and next wave. Most important Rules for Elliot Wave Analysis are verified by the Indicator.  The Pro version analyzes Multiple Timeframes and shows the Subwaves and Target-Levels.   For an Overview  " Elliot Waves Anal
Индикатор Elliott Wave Trend был разработан для научного подсчета волн на основе шаблонов и паттернов, впервые разработанных Чжон Хо Сео. Индикатор нацелен на максимальное устранение нечеткости классического подсчета волн Эллиотта с использованием шаблонов и паттернов. Таким образом индикатор Elliott Wave Trend в первую очередь предоставляет шаблон для подсчета волн. Во-вторых, он предлагает структурный подсчет волн Wave Structural Score, которые помогает определить точное формирование волны. Он
Welcome to the world of SMC (Smart Money Concepts) Trading, where we empower traders with the tools and knowledge to make smarter trading decisions. Our latest addition to our suite of trading tools is the SMC Trading Pro indicator, version 1.0. Key Features: Major Market Structure Identification with BODY break. Order Block must be in Major Swing ( not Small Swing ). Order Block with Fair Value Gap Detection. Order Block in Discount | Premium zone. Filter for only Bullish, Bearish or All Order
Этот индикатор обнаруживает разворот цены зигзагообразно, используя только анализ ценового действия и канал Дончиана. Он был специально разработан для краткосрочной торговли, без перекраски или перекраски вообще. Это фантастический инструмент для проницательных трейдеров, стремящихся увеличить сроки своих операций. [ Руководство по установке | Руководство по обновлению | Устранение неполадок | FAQ | Все продукты ] Удивительно легко торговать Это обеспечивает ценность на каждом таймфрейме Ре
Другие продукты этого автора
Способ применения Pair Trading Station Рекомендуется использовать Pair Trading Station на таймфрейме H1 с любой валютной парой. Чтобы получить сигналы на покупку и продажу, следуйте указанным ниже инструкциям по применению Pair Trading Station в терминале MetaTrader. При загрузке Pair Trading Station на график индикатор оценит доступные исторические данные на вашей платформе MetaTrader для каждой валютной пары. В самой начале на графике отобразятся исторические данные, доступные для каждой валют
Introduction This indicator detects volume spread patterns for buy and sell opportunity. The patterns include demand and supply patterns. You might use each pattern for trading. However, these patterns are best used to detect the demand zone (=accumulation area) and supply zone (=distribution area). Demand pattern indicates generally potential buying opportunity. Supply pattern indicates generally potential selling opportunity. These are the underlying patterns rather than direct price action. T
Введение в Harmonic Pattern Plus Индикатор Harmonic Pattern Plus, предназначенный для работы в MetaTrader 4, ищет гармонические модели на графике. Программа Harmonic Pattern Plus предназначена для определения точек разворота текущего тренда - она находит гармонические модели с высокой силой прогнозирования. Гармонические модели состоят из нескольких линий, объединенных важными соотношениями Фибоначчи, такими как 0,618 и 0,382, которые часто используются профессиональными трейдерами для измерения
Introduction to Fractal Pattern Scanner Fractal Indicator refers to the technical indicator that makes use of the fractal geometry found in the financial market. Fractal Pattern Scanner is the advanced Fractal Indicator that brings the latest trading technology after the extensive research and development work in the fractal geometry in the financial market. The most important feature in Fractal Pattern Scanner is the ability to measure the turning point probability as well as the trend probabi
Introduction to X3 Chart Pattern Scanner X3 Cherart Pattern Scanner is the non-repainting and non-lagging indicator detecting X3 chart patterns including Harmonic pattern, Elliott Wave pattern, X3 patterns, and Japanese Candlestick patterns. Historical patterns match with signal patterns. Hence, you can readily develop the solid trading strategy in your chart. More importantly, this superb pattern scanner can detect the optimal pattern of its kind. In addition, you can switch on and off individu
Peak Trough Analysis - отличный инструмент для обнаружения пиков и впадин на графике. Peak Trough Analysis может использовать три разных алгоритма обнаружения пиков и впадин. Эти три алгоритма включают в себя оригинальный индикатор Fractals Билла Вильямса, модифицированный индикатор Fractals и индикатор ZigZag. Вы можете использовать этот инструмент анализа пиков и впадин для обнаружения паттернов, составленных Равновесным Фрактально-Волновым процессом. Для дальнейшего использования имеется хоро
FREE
Introduction This indicator detects volume spread patterns for buy and sell opportunity. The patterns include demand and supply patterns. You might use each pattern for trading. However, these patterns are best used to detect the demand zone (=accumulation area) and supply zone (=distribution area). Demand pattern indicates generally potential buying opportunity. Supply pattern indicates generally potential selling opportunity. These are the underlying patterns rather than direct price action. T
FREE
Price Breakout pattern Scanner - это полностью автоматический и мощный анализ для трейдеров и инвесторов. Он определяет следующие паттерны на графике. Голова и Плечи - Распространенный паттерн для торговли. Обратная Голова и Плечи - эта модель обратна паттерну Голова и плечи. Двойная вершина - когда цена дважды достигает уровня сопротивления и снизится к уровню поддержки, трейдер может ожидать внезапный медвежий прорыв уровня поддержки. Двойное дно - двойное дно является противоположностью формы
Peak Trough Analysis - отличный инструмент для обнаружения пиков и впадин на графике. Peak Trough Analysis может использовать три разных алгоритма обнаружения пиков и впадин. Эти три алгоритма включают в себя оригинальный индикатор Fractals Билла Вильямса, модифицированный индикатор Fractals и индикатор ZigZag. Вы можете использовать этот инструмент анализа пиков и впадин для обнаружения паттернов, составленных Равновесным Фрактально-Волновым процессом. Для дальнейшего использования имеется хоро
FREE
Индикатор Elliott Wave Trend был разработан для научного подсчета волн на основе шаблонов и паттернов, впервые разработанных Чжон Хо Сео. Индикатор нацелен на максимальное устранение нечеткости классического подсчета волн Эллиотта с использованием шаблонов и паттернов. Таким образом индикатор Elliott Wave Trend в первую очередь предоставляет шаблон для подсчета волн. Во-вторых, он предлагает структурный подсчет волн Wave Structural Score, которые помогает определить точное формирование волны. Он
Excessive Momentum Indicator – один из немногих индикаторов, измеряющий чрезмерный импульс на финансовом рынке с использованием ценового поведения. Индикатор полностью разработан Янгом Хо Сео (Young Ho Seo). Этот показатель демонстрирует концепцию и практическое применение Равновесной фрактальной волны (Equilibrium Fractal Wave). Чрезмерный импульс на рынке может рассказать о психологии толпы и помочь спрогнозировать направление цены. Таким образом, вы можете основывать свои торговые решения на
Introduction This indicator detects volume spread patterns for buy and sell opportunity. The patterns include demand and supply patterns. You might use each pattern for trading. However, these patterns are best used to detect the demand zone (=accumulation area) and supply zone (=distribution area). Demand pattern indicates generally potential buying opportunity. Supply pattern indicates generally potential selling opportunity. These are the underlying patterns rather than direct price action. T
FREE
Introduction To Time Box Indicator Time Box Indicator is a must have indicator for any trader. It will display daily, weekly and Monthly box according to your preferences. Yet, you can extend any important price levels in your chart automatically. You can use them as the significant support and resistance levels. It is very simple but effective tool for your trading. Graphic Setting Use White Chart Line Style for Current Open price Daily Setting Update Timeframe for daily box Number of days
FREE
Период низкой волатильности и нетрендового движения на финансовом рынке считается периодом бокового рынка (Sideways Market). Рано или поздно волатильность начинает расти и рынок переходит в трендовую фазу. Период бокового рынка (флет) может служить хорошим временем входа в рынок. Кроме того, боковой рынок часто означает накопление на рынке объемных ордеров крупных инвесторов. Информация о господстве на рынке флета может помочь вам определить хорошие моменты для входа в рынок и выхода из него. Тр
Введение в Equilibrium Fractal Wave Analytics (аналитику равновесных фрактальных волн) EFW Analytics исходит из принципа "Мы торгуем, потому что на финансовом рынке есть закономерности". EFW Analytics - набор инструментов для повышения эффективности торговли путем обнаружения повторяющихся фрактальных геометрических паттернов на финансовом рынке (пятая закономерность). EFW Analytics - один из нескольких инструментов, поддерживающих торговую логику без необходимости тестирования на истории. Инстр
Introduction to Fractal Moving Average Fractal Moving Average indicator was designed as part of Fractal Pattern Scanner. Inside Fractal Pattern Scanner, Fractal Moving Average Indicator was implemented as multiple of chart objects. With over thousands of chart object, we find that it was not the best and efficient ways to operate the indicator. It was computationally too heavy for the indicator. Hence, we decide to implement the indicator version of Fractal Moving Average indicator to benefit ou
FREE
Introduction Auto Chart Alert is a convenient tool to set alert for your trading in your chart. With Auto Chart Alert, you can set the alert line in one click in your desired location in your chart. You can even set alert over the sloped lines in your chart. Auto Chart Alert is a great tool when you have to watch out importnat support and resistance levels for your trading. You can receive the sound alert, email and push notification when the price hit the alert line at you desired location. A
FREE
Introduction To Time Box Indicator Time Box Indicator is a must have indicator for any trader. It will display daily, weekly and Monthly box according to your preferences. Yet, you can extend any important price levels in your chart automatically. You can use them as the significant support and resistance levels. It is very simple but effective tool for your trading. Graphic Setting Use White Chart Line Style for Current Open price Daily Setting Update Timeframe for daily box Number of days
FREE
Рынок Форекс может пройти множество различных ценовых путей к достижению некоей точки в будущем. Будущее динамично. Поэтому, планирование торговли с возможным будущим сценарием является важным шагом для вашего успеха. Для этих целей представляем вашему вниманию Harmonic Pattern Scenario Planner, первый предиктивный инструмент для определения гармонических моделей в своем роде. Основные характеристики Прогнозирование будущих моделей для анализа сценариев 11 Определение гармонических моделей Авт
Introduction to Fractal Moving Average Fractal Moving Average indicator was designed as part of Fractal Pattern Scanner. Inside Fractal Pattern Scanner, Fractal Moving Average Indicator was implemented as multiple of chart objects. With over thousands of chart object, we find that it was not the best and efficient ways to operate the indicator. It was computationally too heavy for the indicator. Hence, we decide to implement the indicator version of Fractal Moving Average indicator to benefit
FREE
Introduction Auto Chart Alert is a convenient tool to set alert for your trading in your chart. With Auto Chart Alert, you can set the alert line in one click in your desired location in your chart. You can even set alert over the sloped lines in your chart. Auto Chart Alert is a great tool when you have to watch out importnat support and resistance levels for your trading. You can receive the sound alert, email and push notification when the price hit the alert line at you desired location. A
FREE
Концепция спроса и предложения с возвратом к среднему значению Концепция торговли по спросу и предложению полагается на несовпадение объемов покупок и продаж на финансовых рынках. Для обычных трейдеров зоны спроса и предложения служат точками разворота. При рассмотрении первоначальной концепции было обнаружено, что первоначальная торговля по спросу и предложению может выполняться лучше на периоде возврата к среднему значению, а не на периоде тренда. Для демонстрации этой концепции, чтобы какая-л
Introduction This indicator detects volume spread patterns for buy and sell opportunity. The patterns include demand and supply patterns. You might use each pattern for trading. However, these patterns are best used to detect the demand zone (=accumulation area) and supply zone (=distribution area). Demand pattern indicates generally potential buying opportunity. Supply pattern indicates generally potential selling opportunity. These are the underlying patterns rather than direct price action. T
Способ применения Pair Trading Station Рекомендуется использовать Pair Trading Station на таймфрейме H1 с любой валютной парой. Чтобы получить сигналы на покупку и продажу, следуйте указанным ниже инструкциям по применению Pair Trading Station в терминале MetaTrader. При загрузке Pair Trading Station на график индикатор оценит доступные исторические данные на вашей платформе MetaTrader для каждой валютной пары. В самой начале на графике отобразятся исторические данные, доступные для каждой валют
Введение в алгоритм GARCH Improved Nelder Mead GARCH - это сокращение от Generalized Autoregressive Conditional Heteroskedasticity (Обобщенная авторегрессионная условная гетероскедастичность). Представляет собой модель прогнозирования волатильности, обычно применяемую в финансовой сфере. Модель GARCH впервые появилась в работе датского экономиста Тима Петера Боллерслева (Tim Peter Bollerslev) в 1986 году. Лауреат Нобелевской премии 2003 года Роберт Ф. Энгл внес огромный вклад в усовершенствовани
FREE
Этот инновационный технический индикатор был создан для того, чтобы обнаруживать период затишья на рынке перед началом высокой волатильности рынка. Как и многие другие хорошие технические индикаторы, Market Activity Index является очень стабильным, и он широко применим ко многим финансовым и нефинансовым инструментам без особых ограничений. Market Activity Index лучше всего использовать для визуализации чередующейся формы низко и высоковолатильного рынка. Это очень полезный инструмент для взятия
Введение в алгоритм GARCH Improved Nelder Mead GARCH - это сокращение от Generalized Autoregressive Conditional Heteroskedasticity (Обобщенная авторегрессионная условная гетероскедастичность). Представляет собой модель прогнозирования волатильности, обычно применяемую в финансовой сфере. Модель GARCH впервые появилась в работе датского экономиста Тима Петера Боллерслева (Tim Peter Bollerslev) в 1986 году. Лауреат Нобелевской премии 2003 года Роберт Ф. Энгл внес огромный вклад в усовершенствовани
FREE
Об эксперте Order Risk Management Эксперт ORM разработан специально для быстрого и точного исполнения ордеров. Он предназначен для использования с нашими перечисленными ниже стратегиями Ценового действия и Эконометрической торговли. Эксперт ORM полностью автоматизирован и прост в применении. Эксперт ORM абсолютно бесплатный. Такой способ исполнения ордеров экспертом ORM подходит для любой иной торговой стратегии. Harmonic Pattern Plus MT5 Harmonic Pattern Scenario Planner MT5 Price breakout Patt
FREE
Об эксперте Order Risk Management Эксперт ORM разработан специально для быстрого и точного исполнения ордеров. Он предназначен для использования с нашими перечисленными ниже стратегиями Ценового действия и Эконометрической торговли. Эксперт ORM полностью автоматизирован и прост в применении. Эксперт ORM абсолютно бесплатный. Такой способ исполнения ордеров экспертом ORM подходит для любой иной торговой стратегии. Harmonic Pattern Plus MT4 Harmonic Pattern Scenario Planner MT4 Price breakout Patt
FREE
Индикатор Elliott Wave Trend был разработан для научного подсчета волн на основе шаблонов и паттернов, впервые разработанных Чжон Хо Сео. Индикатор нацелен на максимальное устранение нечеткости классического подсчета волн Эллиотта с использованием шаблонов и паттернов. Таким образом индикатор Elliott Wave Trend в первую очередь предоставляет шаблон для подсчета волн. Во-вторых, он предлагает структурный подсчет волн Wave Structural Score, которые помогает определить точное формирование волны. Он
Фильтр:
Andrade Machava
68
Andrade Machava 2020.08.18 22:49 
 

This scanner has changed my Trading carrier to Higher highs. With the continuous updates. The winning rate is excellent. I would recommend anyone to test this one. Thanks to the developer.

Young Ho Seo
84654
Ответ разработчика Young Ho Seo 2021.12.24 12:19
Now I wrote the book Technical Analysis in Forex and Stock Market: Supply Demand Analysis and Support Resistance. In the book, I wrote how to combine the turning point probability with the supply demand analysis or other horizontal support and resistance. The recommened method is easy to use + you have the full control over your success rate and risk management.
Ответ на отзыв
Версия 21.8 2022.03.05
In version 21.8, we have made some minor improvement on Fractal Pattern Scanner.

Fractal Indicator refers to the technical indicator that makes use of the fractal geometry found in the financial market. Fractal Pattern Scanner is the advanced Fractal Indicator that brings the latest trading technology after the extensive research and development work in the fractal geometry in the financial market. The most important feature in Fractal Pattern Scanner is the ability to measure the turning point probability as well as the trend probabilty. Your ability to measure the turning point probabilty and trend probabilty for each price action can boost your trading accuracy marginally.
Версия 21.7 2021.10.04
In Version 21.7, if mother wave pattern detection = false, then the columns related to mother wave pattern detection will be not shown in the multiple timeframe pattern detection panel.
Версия 21.5 2021.10.01
In Version 21.5, you can enable or disable the specific timeframe in the turning point prediction + breakout signal panel.

Use M5 Timeframe = true or false
Use M15 Timeframe = true or false
Use M30 Timeframe = true or false
Use H1 Timeframe = true or false
Use H4 Timeframe = true or false
Use D1 Timeframe = true or false

When you set it to false, then you will not see the turning point probability + the breakout signals for the timeframe.
Версия 21.2 2020.12.23
In Fractal Pattern Scanner Version 21.2, the probability information panel provide the swing size and swing age variables together. With two size and age variables, you should be able to figure it out what is going on in each timeframe, once you get used with all these probability information.
Версия 21.0 2020.08.29
In version 21.0, we have made some minor improvement in our Fractal pattern scanner. For example, now when you choose the reversal pattern detection (in mother wave) for your signal, you will get Buy Breakout (R) and Sell Breakout (R) to indicate you are working on the reversal trading opportunity with the pattern.
Версия 20.9 2020.08.29
In version 20.9, Fractal Pattern Scanner provides the Fibonacci Expansion with the corresponding the Price level. At the same time, we have improved the accuracy of the Fibonacci Probability Graph.
Версия 20.5 2020.08.19
In version 20.5, Fractal Pattern Scanner provides up to four Fractal Cycle analysis using Fractal Decomposition Analysis. However, when you set Fractal Decomposition Dimension = 4, multiple timeframe pattern detection panel is not available because Mutltiple timeframe pattern detection panel is only available with two Fractal Cycle analysis. Enjoy this first and powerful pattern scanner built in with Fractal Decomposition Analysis.
Версия 19.6 2020.08.14
In version 19.6, Fractal Pattern Scanner will display the Mother Wave Start Price and Time. Trader can use this information to gauage the breakout in the opposite direction. In addition, Trader can switch on and off the Trading Signal Panel in the indicator window by pressing D key in the keyboard. Enjoy this powerful patterns.
Версия 19.5 2020.08.04
In version 19.5, Fractal Pattern Scanner will display "Unconfirmed Peak" and "Unconfirmed Trough" text for the latest Fractal Wave identification for the user.
Версия 19.2 2020.07.13
In version 19.2, Fractal Pattern Scanner will provide the following three information for the breakout signals.

Buy or sell breakout signal + status of breakout signal if the current price crossed or not crossed the breakout price level + origin of breakout price.

Then enjoy this powerful trading system for your trading.
Версия 19.1 2020.06.20
In version 19.1, Fractal Pattern Scanner provides lable for Buy Breakout and Sell Breakout. Hence, you will get the sense of direction of trading easier. All the major functionality are the same as before.
Версия 19.0 2020.06.09
In version 19.0, the detected breakout signal (mother wave) will be described in terms of A – B = C.

Respectively, A, B and C are described as below:

A: How many bar ago the origin (peak or trough) of the breakout was detected

B: How many bar ago the current position of breakout (peak or trough) was detected

C: Distance between origin of breakout and current position of breakout ( A-B =C)

Therefore, with C, you can find out how fresh or mature the breakout signal is immediately. Smaller distance (C) means the fresh breakout to enter. Depending on the market condition, you can also enter the breakout while it is running too.
Версия 18.9 2020.05.24
In version 18.9, you can use both Breakout Trading Mode and Turning Point Trading mode. In Breakout Trading Mode, Fractal Pattern Scanner detect small and young child wave with the potential breakout. In Turning Point Trading Mode, Fractal Pattern Scanner will detect the mother wave with mature probability.
Версия 18.8 2020.05.23
In version 18.8, you can use both Breakout Mode and Reversal (Turning Point) trading model. In Breakout Mode, Fractal Pattern Scanner detect small and young child wave with the potential breakout.
Версия 18.6 2020.05.21
In version 18.6, now you can lock Fibonacci Expansion Lines from Mother Wave detection. With the extended Fibonacci Expanstion lines, it is easier to combine them with Andrew's Pitchfork. See the provided the screenshot for that.
Версия 18.2 2020.05.03
In version 18.2, now you can lock the nine Gann Angles by just one button click. This helps you to combine multiple of Gann Angles in your chart.