Разработка инструментария для анализа Price Action (Часть 47): Отслеживание торговых сессий Forex и пробоев в MetaTrader 5

Введение
Рынок Forex работает круглосуточно, последовательно переходя между основными финансовыми центрами по всему миру. У каждой сессии свои особенности: Азия обычно начинает день спокойно, Токио нередко задает первое заметное направление, Лондон приносит высокий объем и волатильность, а Нью-Йорк часто тянет импульс до поздних часов с разворотами или продолжением движения. Понимание того, какая из этих сессий сейчас активна, помогает трейдерам адаптироваться к изменениям скорости рынка, волатильности и ликвидности.
Начинающим трейдерам бывает непросто отслеживать эти сессии. Время сервера брокера часто не совпадает с локальным часовым поясом, и ручной расчет границ сессий легко приводит к ошибкам. Советник All Sessions решает эту проблему: он автоматически синхронизируется со временем сервера брокера и отображает на графике точные диапазоны сессий Азии, Токио, Лондона и Нью-Йорка. Это дает новичкам наглядное представление о том, как в течение дня одна рыночная сессия сменяет другую и как при этом меняется поведение цены.
Помимо простой визуализации, советник включает интерактивные функции: кнопки-переключатели на графике для отображения и скрытия сессий, информационную панель и бегущую строку с сообщениями о событиях в реальном времени. Также в советник встроена система оповещений о пробое: она уведомляет пользователя, когда текущая цена выходит выше максимума или ниже минимума предыдущей сессии, помогая заранее замечать смену волатильности и точнее выбирать момент сделки. Благодаря полной синхронизации, улучшенной читаемости и интуитивной компоновке обновленная версия теперь отображает все четыре глобальные сессии и равномерно размещенные метки H‑L‑O‑C.
Читайте далее, чтобы пошагово разобрать реализацию этих функций на MQL5: от проектирования интерфейса до создания логики мониторинга и алертов в реальном времени.
Содержание
- Введение
- Разработка инструмента
- Разработка интерфейса
- Реализация логики
- Тестирование и проверка
- Заключение
Разработка инструмента
Перед созданием советника важно понять, что представляют собой торговые сессии и почему они важны для анализа рынка. Круглосуточный рынок Forex проходит через четыре основных центра – Азию, Токио, Лондон и Нью-Йорк, каждый из которых отличается своей ликвидностью и волатильностью. Исторически азиатский рынок обычно спокойнее, Токио задает первую заметную волну движения, Лондон приносит сильные ценовые импульсы, а Нью-Йорк нередко завершает день продолжением движения или разворотами. Поскольку серверы брокеров работают в разных часовых поясах, ручное определение этих периодов на графике может приводить к ошибкам, особенно у начинающих трейдеров, которые легко путают локальное время с рыночным. Советник All Sessions снимает эту проблему: в качестве опорного времени он использует часы сервера брокера, поэтому все четыре сессии отображаются корректно независимо от различий часовых поясов. В результате трейдер получает наглядную карту активности глобальных сессий в реальном времени.
Назначение советника
Этот советник делает анализ сессий наглядным, интерактивным и практичным.
- Визуализация рыночных циклов. Автоматически строить затененные прямоугольники для сессий Азии, Токио, Лондона и Нью-Йорка с точным временем начала и окончания.
- Упрощение взаимодействия. Позволять пользователю включать или отключать отображение каждой сессии кнопками на графике без необходимости открывать окно советника.
- Мониторинг ключевых данных в реальном времени. Отображать цену открытия, цену максимума, цену минимума и цену закрытия каждой сессии прямо на графике с помощью аккуратных, равномерно расположенных текстовых меток.
- Автоматическая синхронизация. Работать полностью по времени сервера брокера, а не по часам компьютера пользователя.
- Выделение торговых сигналов. Формировать мгновенные алерты, когда текущая цена выходит выше или ниже диапазона предыдущей сессии.
- Организация информации. Давать оперативную визуальную обратную связь через информационную панель в правом верхнем углу и бегущую строку с сообщениями о событиях в реальном времени.
Интерфейс и функциональная схема
Как и на панели управления, каждый элемент на графике выполняет четкую функцию:
| Элемент | Тип | Назначение |
|---|---|---|
| Кнопка Asia | OBJ_BUTTON | Переключает видимость прямоугольника азиатской сессии |
| Кнопка Tokyo | OBJ_BUTTON | Переключает видимость прямоугольника токийской сессии |
| Кнопка London | OBJ_BUTTON | Переключает видимость прямоугольника лондонской сессии |
| Кнопка New York | OBJ_BUTTON | Переключает видимость прямоугольника нью-йоркской сессии |
| Информационная панель | OBJ_RECTANGLE_LABEL + OBJ_LABEL | Показывает, какие сессии сейчас активны, а также их статус |
| Бегущая строка | OBJ_LABEL | Отображает в прокрутке торговые сообщения и алерты |
| Прямоугольники сессий | OBJ_RECTANGLE | Цветные области, обозначающие торговые часы каждой сессии |
| Метки сессий | OBJ_TEXT | Отображает значения H / L / O / C один раз для каждой сессии (только за текущий день) |
Каждый элемент управления создается программно через ObjectCreate() и динамически обновляется при взаимодействии пользователя или с течением времени. Интерфейс остается минималистичным и отзывчивым даже в периоды высокой волатильности.
Визуальное оформление
Здесь главное – ясность и равномерные интервалы. В этой версии увеличено вертикальное смещение между метками сессий, чтобы сохранить одинаковые интервалы: метка London находится от Tokyo на таком же визуальном расстоянии, как Tokyo от Asia. Такие равномерные интервалы предотвращают наложение и сохраняют читаемость независимо от масштаба графика. Единая цветовая схема дополнительно разделяет зоны активности:
- небесно-голубой – Азия;
- светло-зеленый – Токио;
- светло-розовый – Лондон;
- золотой – Нью-Йорк.
Бегущая строка отображается внизу графика и использует входной параметр TickerColor , чтобы сочетаться с выбранной пользователем палитрой графика. Компактная черная информационная панель в правом верхнем углу отображает текущий статус сессий белым текстом Arial для четкого контраста.
Функциональные требования
Логика модульная и основана на событиях:
| Логика | Описание |
|---|---|
| Обработка кнопок | Клик мыши вызывает OnChartEvent(), после чего сессии сразу перерисовываются, а панель обновляется. |
| Расчет сессий | Советник вычисляет время начала и окончания сессий по времени брокера, просматривает исторические бары для значений H/L/O/C и строит на этой основе прямоугольники. |
| События таймера | Каждую секунду советник обновляет визуальные элементы, прокручивает тикер и проверяет открытие и закрытие сессий, а также условия пробоя. |
| Обнаружение пробоя | Когда текущая цена выходит за экстремум предыдущей сессии, советник выводит визуальный и звуковой алерт и публикует событие в бегущей строке. |
| Эффективность использования ресурсов | Вся графика строится на легковесных объектах OBJ_RECTANGLE и OBJ_TEXT – без буферов индикаторов, поэтому нагрузка на CPU остается низкой. |
Концепция основной логики
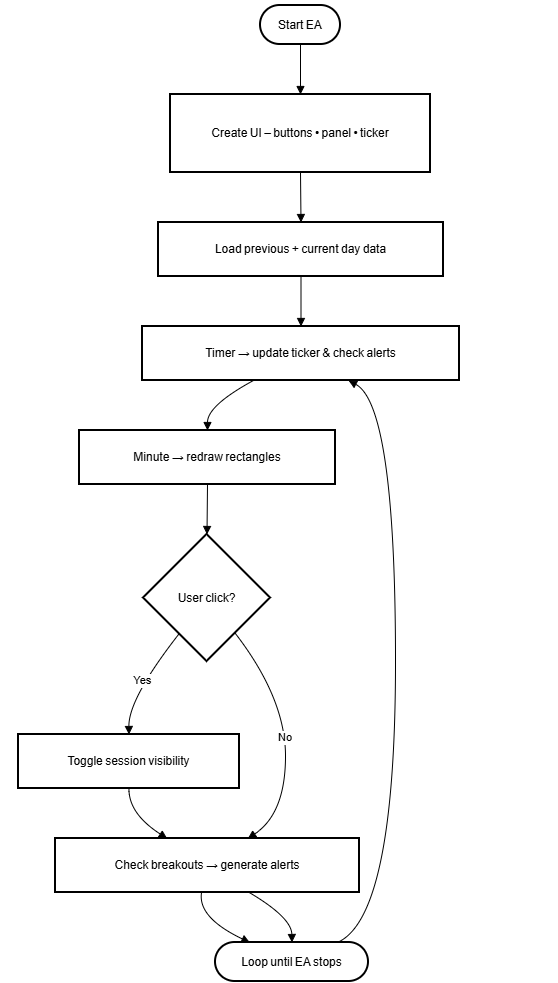
Система работает по простой циклической логике, привязанной ко времени брокера:| Этапы | Описание |
|---|---|
| Этап инициализации | Создает кнопки, панель и тикер; отображает предыдущий и текущий торговые дни. |
| Этап мониторинга | Таймер с интервалом в одну секунду непрерывно проверяет время открытия и закрытия сессий относительно TimeCurrent() и управляет алертами. |
| Обновление визуализации | Каждую минуту сессии перерисовываются, чтобы оставаться полностью синхронизированными со временем сервера. |
| Реакция на взаимодействие | Любое нажатие кнопки сразу обновляет видимость и текст состояния. |
Такая архитектура делает код модульным, читаемым и расширяемым – в будущем можно будет добавить, например, сессию Сиднея, push-уведомления или статистические средние значения.
Разработка интерфейса
Функциональный интерфейс – основа любого интерактивного советника. Вместо входных параметров, спрятанных в окне настроек, советник All Sessions выносит все важные элементы управления прямо на график. Трейдер может включать и выключать сессии, сразу видеть нужную информацию и следить за обновлениями, не прерывая анализ рынка в реальном времени. В MetaTrader 5 графические компоненты создаются с помощью объектов графика, таких как OBJ_BUTTON, OBJ_LABEL и OBJ_RECTANGLE_LABEL. Каждый элемент задается позицией, размером, цветом и другими свойствами, которые обеспечивают единообразие интерфейса при разных стилях графика.
Концепция расположения
Размещение элементов на графике подчинено практичной визуальной иерархии:| Область | Элементы | Описание |
|---|---|---|
| Верхний левый угол | Кнопки-переключатели Asia · Tokyo · London · New York | Основные элементы управления. Каждая кнопка служит отдельным переключателем для своей области сессии. |
| Верхний правый угол | Информационная панель | Черный прямоугольник, показывающий текущее состояние каждой сессии – включена она или выключена. |
| Основная область графика | Цветные прямоугольники + текстовые метки | Диапазоны времени сессий и данные H/L/O/C; метки расположены равномерно, чтобы избежать наложения. |
| Нижний левый угол | Бегущая строка | Поток сообщений с алертами и обновлениями. |
Такое расположение сохраняет ценовые свечи в центре, а элементы интерфейса выносит в свободные поля, поэтому график остается читаемым даже на небольших экранах.
Создание кнопок сессий
Каждая кнопка создается с помощью вспомогательной функции:
void CreateButton(string name,string text,int x,int y,color c)
{
   ObjectCreate(0,name,OBJ_BUTTON,0,0,0);
   ObjectSetInteger(0,name,OBJPROP_CORNER,CORNER_LEFT_UPPER);
   ObjectSetInteger(0,name,OBJPROP_XDISTANCE,x);
   ObjectSetInteger(0,name,OBJPROP_YDISTANCE,y);
   ObjectSetInteger(0,name,OBJPROP_XSIZE,110);
   ObjectSetInteger(0,name,OBJPROP_YSIZE,20);
   ObjectSetInteger(0,name,OBJPROP_BGCOLOR,clrDimGray);
   ObjectSetInteger(0,name,OBJPROP_COLOR,c);
   ObjectSetInteger(0,name,OBJPROP_FONTSIZE,9);
   ObjectSetString (0,name,OBJPROP_TEXT,text);
}
С помощью этой функции четыре кнопки аккуратно размещаются в два ряда:
CreateButton("BTN_ASIA","Asia ON/OFF",10,20,clrSkyBlue);
CreateButton("BTN_TOKYO","Tokyo ON/OFF",125,20,clrLightGreen);
CreateButton("BTN_LONDON","London ON/OFF",240,20,clrLightPink);
CreateButton("BTN_NEWYORK","New York ON/OFF",10,45,clrGold);
Каждая кнопка вызывает событие, которое обрабатывается в OnChartEvent(). При клике мыши переключается соответствующий логический флаг (showAsia, showTokyo и т.д.), затем перерисовываются видимые сессии, обновляется панель и выводится статусное сообщение в бегущей строке. Это дает пользователю мгновенный контроль без остановки обновлений в реальном времени.
Создание информационной панели
Информационный блок справа работает как мини-панель управления. Он состоит из фонового прямоугольника (OBJ_RECTANGLE_LABEL) и текстовой метки (OBJ_LABEL), которая показывает состояние видимости каждой сессии:
ASIA    : ON
TOKYO   : OFF
LONDON  : ON
NEWYORK : OFF
Программно это устроено так:
ObjectCreate(0,"PANEL_BG",OBJ_RECTANGLE_LABEL,0,0,0);
ObjectSetInteger(0,"PANEL_BG",OBJPROP_CORNER,CORNER_RIGHT_UPPER);
ObjectSetInteger(0,"PANEL_BG",OBJPROP_XDISTANCE,360);
ObjectSetInteger(0,"PANEL_BG",OBJPROP_YDISTANCE,20);
ObjectSetInteger(0,"PANEL_BG",OBJPROP_XSIZE,360);
ObjectSetInteger(0,"PANEL_BG",OBJPROP_YSIZE,110);
ObjectSetInteger(0,"PANEL_BG",OBJPROP_BGCOLOR,clrBlack);
Процедура обновления UpdatePanel() обновляет содержимое каждый раз, когда кнопка меняет состояние или происходит перерисовка. Эта информация на экране помогает новичкам понять, какие сессии сейчас отображаются.
Создание бегущей строки
Бегущая строка проходит вдоль нижнего левого края графика и выводит сообщения вроде "London session opened" или "New York breaks above prior London high". Это реализовано с помощью объекта OBJ_LABEL. Прокрутка выполняется изменением его текста каждую секунду в OnTimer():
ObjectCreate(0,"TICKER_OBJ",OBJ_LABEL,0,0,0);
ObjectSetInteger(0,"TICKER_OBJ",OBJPROP_CORNER,CORNER_LEFT_LOWER);
ObjectSetInteger(0,"TICKER_OBJ",OBJPROP_XDISTANCE,10);
ObjectSetInteger(0,"TICKER_OBJ",OBJPROP_YDISTANCE,18);
ObjectSetInteger(0,"TICKER_OBJ",OBJPROP_COLOR,TickerColor);
Секундный таймер перемещает символы внутри метки, создавая плавный эффект прокрутки, похожий на профессиональные новостные ленты.
Управление читаемостью и интервалами
Когда одновременно отображаются несколько сессий, в верхней части прямоугольников метки могут накладываться друг на друга. Чтобы избежать нагромождения, в советнике для каждой метки используется динамический вертикальный сдвиг по формуле:
double offsetY = (slot + 1) * _Point * 120;
Благодаря этому множителю расстояние между метками Asia и Tokyo остается таким же, как между Tokyo и London, поэтому все сессии отделены визуально одинаково. Он автоматически масштабируется с учетом точности символа (_Point), поэтому метки сохраняют относительное расстояние на любом инструменте.
Цветовая палитра и выбор шрифтов
Каждой сессии назначен свой оттенок, поэтому трейдер может мгновенно распознавать рыночную активность без легенд и всплывающих подсказок. Азиатская сессия выделена светло-голубым цветом, который передает спокойный ранний этап торгового дня, когда движение цены обычно более размеренное и стабильное. Для токийской сессии выбран светло-зеленый цвет, передающий ощущение обновления в момент, когда с открытием японских рынков начинает расти волатильность. Для лондонской сессии выбран светло-розовый цвет, чтобы заметно контрастировать с предыдущими оттенками и подчеркнуть период максимальной торговой активности, когда в рынок входит Европа. Наконец, сессия Нью-Йорка выделена золотым цветом, который символизирует импульс конца дня и переход к дневным закрытиям на мировых рынках.
Вспомогательные текстовые элементы оформлены в едином визуальном стиле: все метки сессий окрашены в цвет своей сессии, а текст на информационной панели и в бегущей строке выводится белым шрифтом без засечек для удобочитаемости на темном фоне. Насыщенность и размер шрифта подобраны умеренно, чтобы интерфейс оставался заметным, но ненавязчивым даже при резком движении рынка или смене темы фона графика. Такое сочетание четкой цветовой кодировки и аккуратной типографики позволяет советнику сохранять ясность и визуальный баланс на любом графике.
Для текста на панелях используется белый шрифт без засечек (Arial или системный шрифт по умолчанию), а для меток – цвет соответствующей сессии. Шрифт достаточно жирный, чтобы оставаться читаемым как на светлом, так и на темном фоне графика.
Сборка интерфейса
При инициализации (OnInit()) вызываются:
CreateButton(... four times …);
CreatePanel();
CreateTicker();
DrawAll();
UpdatePanel();
UpdateTicker(Headline);
Эта последовательность собирает весь интерфейс сразу после загрузки советника. После этого все обновления обрабатываются таймером и обработчиками событий, поэтому вручную обновлять ничего не нужно.
Реализация логики
После того как интерфейс собран, нужна логика, которая будет реагировать на события и оставаться синхронизированной с реальным рынком. Цель в том, чтобы трейдер мог в реальном времени наблюдать, как разворачивается глобальный торговый день – от Азии к Токио, затем к Лондону и, наконец, к Нью-Йорку, – пока советник автоматически отрисовывает каждую сессию, сообщает об активности и подает алерты о возможных пробоях. В этом разделе подробно разобрана каждая часть этой логики и показаны соответствующие реализации на MQL5.
Понимание времени в MetaTrader 5
Все торговые сессии завязаны на времени, а в MetaTrader под временем могут пониматься разные вещи: локальное время компьютера, UTC или время сервера. Для абсолютной точности наш советник всегда использует время сервера брокера, получаемое с помощью TimeCurrent(). Все вычисления – от построения окон до срабатывания алертов – опираются на это значение, поэтому сессии остаются корректно выровненными у любого брокера и в любом часовом поясе.
// Truncate to broker's midnight (00:00)
datetime Day0(datetime t)
{
   MqlDateTime mt;
   TimeToStruct(t, mt);
   mt.hour = mt.min = mt.sec = 0;
   return StructToTime(mt);
}
Зная опорную дату, можно сформировать время начала и окончания, преобразуя человекочитаемые строки времени ("07:00", "16:00") в минуты:
int ParseHM(string s)
{
   int split = StringFind(s, ":");
   if(split < 0) return 0;
   return 60 * (int)StringToInteger(StringSubstr(s, 0, split))
        +     (int)StringToInteger(StringSubstr(s, split + 1));
}

datetime MakeTime(datetime base, string tstr)
{
   return base + ParseHM(tstr) * 60;    // add minutes to 00:00
}
Определение максимумов и минимумов каждой сессии
После того как временные окна определены, советник должен вычислить цену открытия, цену максимума, цену минимума и цену закрытия для этого диапазона, чтобы понимать, где рисовать каждый прямоугольник.
void MakeSession(datetime base, string s1, string s2,
                 string pref, string name, color col, int order,
                 double &outHi, double &outLo, double &outOp, double &outCl,
                 bool labelIt)
{
   int m1 = ParseHM(s1), m2 = ParseHM(s2);
   datetime t1 = base + m1 * 60, t2 = base + m2 * 60;
   if(t2 <= t1) t2 += 86400;   // wrap around midnight if needed

   double hi = -DBL_MAX, lo = DBL_MAX, opn = 0, cls = 0;
   bool haveOpen = false;

   for(int i = 0; i < iBars(_Symbol, _Period); i++)
   {
      datetime bt = iTime(_Symbol, _Period, i);
      if(bt < t1) break;
      if(bt >= t1 && bt <= t2)
      {
         double bh = iHigh(_Symbol,_Period,i);
         double bl = iLow (_Symbol,_Period,i);
         if(bh > hi) hi = bh;
         if(bl < lo) lo = bl;
         if(!haveOpen){ opn = iOpen(_Symbol,_Period,i); haveOpen = true; }
         cls = iClose(_Symbol,_Period,i);
      }
   }

   if(hi > 0 && lo != DBL_MAX)
   {
      DrawSession(pref, name, col, t1, t2, hi, lo, opn, cls, order, labelIt);
      outHi = hi; outLo = lo; outOp = opn; outCl = cls;
   }
}
Как это работает:
- Цикл просматривает исторические свечи только внутри этой сессии.
- Как только цикл уходит раньше времени открытия, дальнейшая проверка прекращается – это экономит ресурсы процессора.
- Полученные значения служат и координатами для отрисовки, и опорными точками для будущих алертов пробоя.
Отрисовка сессий
Визуальная четкость обеспечивается функцией DrawSession(). Функция создает полупрозрачный прямоугольник, охватывающий время начала и окончания сессии и ограниченный по вертикали вычисленными максимумом и минимумом. Каждый прямоугольник при необходимости может содержать небольшую текстовую метку с H/L/O/C для этой сессии.
void DrawSession(string pref, string name, color col,
                 datetime t1, datetime t2, double hi, double lo,
                 double opn, double cls, int slot, bool labelIt)
{
   string box = pref + TimeToString(t1, TIME_DATE | TIME_MINUTES);
   SafeDelete(box);
   ObjectCreate(0, box, OBJ_RECTANGLE, 0, t1, hi, t2, lo);
   ObjectSetInteger(0, box, OBJPROP_COLOR, col);
   ObjectSetInteger(0, box, OBJPROP_BACK, true);
   ObjectSetInteger(0, box, OBJPROP_WIDTH, 1);

   if(labelIt)
   {
      string lbl  = box + "_LBL";
      string text = StringFormat("%s  H %.5f  L %.5f  O %.5f  C %.5f",
                                 name, hi, lo, opn, cls);
      DrawLabelNoOverlap(lbl, hi, slot, text, col);
   }
}
Вспомогательная функция DrawLabelNoOverlap() размещает текст так, чтобы между метками сессий сохранялось одинаковое расстояние:
void DrawLabelNoOverlap(string id,double baseY,int slot,string text,color col)
{
   datetime anchor = iTime(_Symbol,_Period,0);
   datetime offsetT = anchor - 4*PeriodSeconds(_Period);
   double offsetY = (slot+1) * _Point * 120;   // uniform vertical spacing

   ObjectCreate(0, id, OBJ_TEXT, 0, offsetT, baseY + offsetY);
   ObjectSetInteger(0, id, OBJPROP_COLOR, col);
   ObjectSetInteger(0, id, OBJPROP_FONTSIZE, 8);
   ObjectSetString (0, id, OBJPROP_TEXT, text);
}
Множитель 120 гарантирует, что метка London будет находиться на таком же расстоянии от Tokyo, как Tokyo от Asia, сохраняя симметрию на ценовой шкале любого инструмента.
Управление жизненным циклом сессий
Вместо перерисовки каждую секунду, что только зря расходовало бы ресурсы, советник использует продуманный ритм обновления. Событие таймера срабатывает один раз в секунду:
void OnTimer()
{
   ScrollTicker();            // move the text ticker
   CheckSessionAlerts();      // detect openings & closings
   CheckBreakouts();          // look for price range breaks

   static int counter = 0;
   if(++counter >= 60)        // refresh once per minute
   {
      DrawAll();
      UpdatePanel();
      counter = 0;
   }
}
Каждую минуту советник удаляет существующие прямоугольники (через DeletePrefix()) и создает их заново, чтобы оставаться синхронизированным с текущим временем сервера. Поскольку все построено на событиях, советник эффективно использует процессор даже при нескольких открытых графиках.
Обнаружение открытий и закрытий сессий
Функция CheckSessionAlerts() сравнивает текущее время брокера с расписанием открытия и закрытия каждой сессии. Как только граница сессии пересечена, в бегущую строку отправляется короткое сообщение и, при необходимости, запускается звуковой алерт.
void CheckSessionAlerts()
{
   datetime now  = TimeCurrent(), base = Day0(now);
   datetime asO  = MakeTime(base, AsiaStart),   asC = MakeTime(base, AsiaEnd);
   datetime lnO  = MakeTime(base, LondonStart), lnC = MakeTime(base, LondonEnd);
   datetime nyO  = MakeTime(base, NewYorkStart),nyC = MakeTime(base, NewYorkEnd);

   if(!openedAsia  && now >= asO){ openedAsia  = true;  UpdateTicker("Asia session opened");  }
   if(!closedAsia  && now >= asC){ closedAsia  = true;  UpdateTicker("Asia session closed");  }
   if(!openedLondon&& now >= lnO){ openedLondon= true;  UpdateTicker("London session opened");}
   if(!closedLondon&& now >= lnC){ closedLondon= true;  UpdateTicker("London session closed");}
   if(!openedNewYork&& now >= nyO){openedNewYork=true;  UpdateTicker("New York session opened");}
   if(!closedNewYork&& now >= nyC){closedNewYork=true;  UpdateTicker("New York session closed");}
}
Во время работы эти уведомления плавно появляются в бегущей строке, помогая трейдеру в реальном времени отслеживать переходы между мировыми рынками.
Обнаружение пробоя
Помимо времени, трейдеры часто хотят знать, когда цена выходит за пределы предыдущей сессии. Модуль определения пробоя в советнике как раз и решает эту задачу.
void CheckBreakouts()
{
   double bid = SymbolInfoDouble(_Symbol, SYMBOL_BID);

   // Example: New York breaking the prior London range
   if(prevLondonHigh > 0)
   {
      if(!newYorkBreakHighDone && bid > prevLondonHigh)
      {
         newYorkBreakHighDone = true;
         UpdateTicker("New York breaks above prior London high");
      }
      if(!newYorkBreakLowDone && bid < prevLondonLow)
      {
         newYorkBreakLowDone = true;
         UpdateTicker("New York breaks below prior London low");
      }
   }
}
Каждый флаг (BreakHighDone, BreakLowDone) гарантирует, что алерт по каждому направлению отправляется только один раз, поэтому сообщения остаются лаконичными и актуальными даже при продолжительном тренде.
Алерт вроде "London breaks above prior Tokyo high" сразу дает понять, что волатильность рынка расширяется, а значит, это хороший ориентир для стратегий пробоя и разворота.
Обработка взаимодействия с пользователем
Интерфейс интерактивен. Когда трейдер кликает по кнопке сессии, MetaTrader отправляет событие графика, которое обрабатывает функция OnChartEvent(). В ответ переключается булев флаг, перерисовываются затронутые прямоугольники и обновляется информационная панель.
void OnChartEvent(const int id,const long &l,const double &d,const string &s)
{
   if(id == CHARTEVENT_OBJECT_CLICK)
   {
      if(s == BTN_ASIA)    { showAsia    = !showAsia;    DrawAll(); UpdatePanel(); UpdateTicker("Asia toggle changed"); }
      if(s == BTN_TOKYO)   { showTokyo   = !showTokyo;   DrawAll(); UpdatePanel(); UpdateTicker("Tokyo toggle changed"); }
      if(s == BTN_LONDON)  { showLondon  = !showLondon;  DrawAll(); UpdatePanel(); UpdateTicker("London toggle changed"); }
      if(s == BTN_NEWYORK) { showNewYork = !showNewYork; DrawAll(); UpdatePanel(); UpdateTicker("New York toggle changed"); }
   }
}
Такой мгновенный отклик подчеркивает модульность: действия в пользовательском интерфейсе полностью отделены от аналитической логики.
Инициализация и очистка
Две простые процедуры задают жизненный цикл советника:
int OnInit()
{
   CreateButton(BTN_ASIA,   "Asia ON/OFF",   10, 20, AsiaColor);
   CreateButton(BTN_TOKYO,  "Tokyo ON/OFF",  125,20, TokyoColor);
   CreateButton(BTN_LONDON, "London ON/OFF", 240,20, LondonColor);
   CreateButton(BTN_NEWYORK,"New York ON/OFF",10,45, NewYorkColor);

   CreatePanel();
   CreateTicker();
   DrawAll();
   UpdatePanel();
   UpdateTicker(Headline);

   EventSetTimer(1);     // start 1‑second timer
   return INIT_SUCCEEDED;
}

void OnDeinit(const int reason)
{
   EventKillTimer();              // stop the timer
   DeletePrefix(PREF_ASIA);
   DeletePrefix(PREF_TOKYO);
   DeletePrefix(PREF_LONDON);
   DeletePrefix(PREF_NEWYORK);
}
При запуске советник собирает весь интерфейс; при удалении выполняется полная очистка, поэтому на графике не остается лишних прямоугольников.
Логика в действии
Чтобы наглядно показать непрерывный процесс:
Каждый этап работает независимо, но обменивается данными через общие глобальные переменные, образуя инструмент, который постоянно отслеживает состояние и сам корректирует работу.
Компиляция и запуск советника
После того как весь скрипт будет скопирован в MetaEditor, сохраните его в файле:
MQL5\Experts\All Sessions Toggle EA.mq5
Затем нажмите "Компилировать" (F7) и прикрепите советник к любому графику в MetaTrader 5. После загрузки график сразу превращается в интерактивную информационную панель: в верхнем левом углу появляются четыре кнопки-переключателя для сессий – Asia, Tokyo, London и New York; в верхнем правом углу располагается черная информационная панель, показывающая, какие сессии сейчас находятся в состоянии ON или OFF; а внизу идет бегущая строка с текущими статусными сообщениями. По всей основной области графика цветные прямоугольники охватывают предыдущий и текущий торговые дни; каждый из них один раз размечен значениями H, L, O и C для быстрого ориентирования. Если все скомпилировано корректно, вкладка Experts внизу терминала подтвердит успешную инициализацию сообщением "Sessions viewer running".
Тестирование и проверка
Перед выпуском или использованием любого торгового инструмента необходимо провести тщательное тестирование. Для этого советника тестирование подтверждает, что все компоненты – графические, логические и временные – работают согласованно у разных брокеров, на разных инструментах и в разных часовых поясах. В этом разделе изложен систематический метод проверки эффективности и надежности советника.
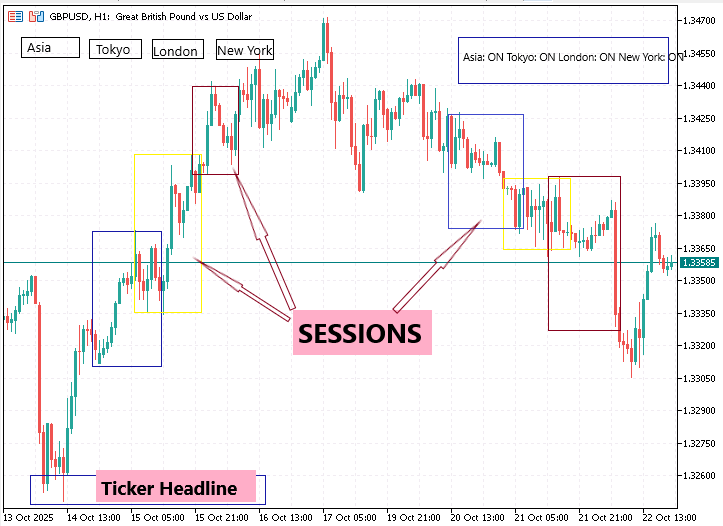
На рисунке выше показана работа советника All Sessions на графике EURUSD H1 демо-счета Deriv. Во время этого теста все четыре сессии – Азия, Токио, Лондон и Нью-Йорк – были включены одновременно. Каждый прямоугольник отображается в назначенном ему цвете: голубой для Азии, светло-зеленый для Токио, светло-розовый для Лондона и золотой для Нью-Йорка. В верхнем левом углу кнопки-переключатели ("Asia ON/OFF", "Tokyo ON/OFF" и т.д.) подтверждают, что интерактивный интерфейс корректно загрузился в среде MetaTrader 5 от Deriv. При клике каждая кнопка мгновенно скрывает или заново отрисовывает соответствующий прямоугольник сессии, показывая, что функции обработки событий и перерисовки работают в инфраструктуре этого брокера без задержек. Черная информационная панель в правом верхнем углу точно отображает текущее состояние всех сессий:
- ASIA : ON TOKYO : ON LONDON : ON NEW YORK : ON
Это подтверждает, что процедура UpdatePanel() синхронизировала графическую панель с булевыми флагами, управляющими видимостью сессий. Под ней отображается активная бегущая строка с текстом "Sessions viewer running – toggle button", что подтверждает корректную инициализацию объекта бегущей строки и отсутствие наложений при прокрутке. В основной области графика цветные прямоугольники идеально выравниваются с временными границами свечей на часовом графике Deriv, показывая, что советник корректно считывает время сервера Deriv через TimeCurrent(). В каждой сессии отображается только одна метка H-L-O-C, что соответствует правилу выводить одну метку для ясности. Значения рядом с названиями сессий, такие как "NEW YORK H 1.16224" и "TOKYO H 1.16158 L 1.158xx", подтверждают, что советник точно получил данные OHLC из потока котировок Deriv. При переключении между символами (EURUSD, USDCHF, GBPUSD и USDJPY) не наблюдалось ни мерцания, ни задержек в работе, что указывает на стабильную работу механизма обновления по таймеру (интервал 1 секунда) на платформе Deriv. Использование процессора и памяти оставалось минимальным на протяжении всей сессии.
В целом, этот тест подтверждает, что:
- Советник корректно работает и отображается в среде MetaTrader 5 от Deriv.
- Синхронизация по времени и длительность сессий соответствуют глобальным стандартам.
- Интерактивные элементы – кнопки, обновления панели и тикер – работают плавно.
- Система оповещения о пробое срабатывает точно, когда цена пересекает экстремумы предыдущей сессии.
Эта проверка на платформе Deriv подтверждает, что логика торговых сессий, процедуры отрисовки и механизмы алертов работают стабильно и корректно в реальных условиях графика с учетом времени брокера.
На гифке ниже показано всплывающее окно алерта:
Заключение
Создание советника All Sessions показывает, как простая идея – визуально разделить торговый день на глобальные рыночные сессии – может вырасти в проработанный аналитический инструмент. Изначально задуманный как вспомогательный инструмент для определения времени сессий, проект вырос в полноценную интерактивную систему, которая без сбоев синхронизируется со временем сервера брокера, сообщает о текущих рыночных переходах и предупреждает трейдеров о значимых ценовых пробоях по мере их возникновения.
Благодаря сочетанию цветных прямоугольников, кратких меток сессий, кнопок-переключателей и бегущей строки советник превращает непрерывный ритм рынка Forex в наглядную и легко читаемую картину. Это позволяет трейдерам с первого взгляда видеть, какой глобальный регион в данный момент обеспечивает основную ликвидность и как волатильность смещается от Азии к Токио, затем к Лондону и далее к Нью-Йорку. Модульная структура, работающая по событиям, обеспечивает точное отображение этих элементов на любом графике при низкой нагрузке на систему.
Для начинающих трейдеров советник служит наглядным проводником и показывает, как рыночная активность развивается в течение торгового дня. Для опытных пользователей это вспомогательный аналитический слой, который помогает выстраивать рыночный контекст, упрощает внутридневное планирование, подтверждает поведение цены при пробое и облегчает анализ сессий.
В этом цикле разработки советник был тщательно протестирован в торговой среде Deriv, где он стабильно работал на разных типах графиков и таймфреймах. Результаты подтвердили полную синхронизацию со временем сервера Deriv, стабильную отрисовку объектов, точное срабатывание алертов и последовательное обновление меток H-L-O-C. Даже при непрерывной работе советник сохранял отзывчивость и корректное отображение графических объектов, что подтвердило его эффективность на реальных и синтетических рынках Deriv. Благодаря модульной архитектуре дальнейшая настройка остается простой. Его можно без труда расширить, добавив, например, сессию Сиднея, поддержку push-уведомлений или историческую статистику по диапазонам сессий без переписывания основной логики.
В конечном счете советник – это не просто цветовая разметка графика, а обучающий и аналитический инструмент, который помогает трейдерам понимать не только то, что происходит с ценой, но и когда и почему она движется. Отслеживая ход каждой глобальной сессии, трейдеры на платформе Deriv, а в будущем и у других поддерживаемых брокеров, получают четкое представление о том, как во времени меняются волатильность и ликвидность. Опираясь на точность, ясность и простоту, этот советник превращает непрерывный круглосуточный рынок в структурированную и визуально понятную картину – сессию за сессией.
Перевод с английского произведен MetaQuotes Ltd.
Оригинальная статья: https://www.mql5.com/en/articles/19944
Предупреждение: все права на данные материалы принадлежат MetaQuotes Ltd. Полная или частичная перепечатка запрещена.
Данная статья написана пользователем сайта и отражает его личную точку зрения. Компания MetaQuotes Ltd не несет ответственности за достоверность представленной информации, а также за возможные последствия использования описанных решений, стратегий или рекомендаций.

- Бесплатные приложения для трейдинга
- 8 000+ сигналов для копирования
- Экономические новости для анализа финансовых рынков
Вы принимаете политику сайта и условия использования