
Треугольный арбитраж с прогнозами
Введение
В статье рассматривается стратегия треугольного арбитража. Приведен пример двух треугольных арбитражей, основанных на моделях глубокого обучения. Модели и советник приложены к статье. Треугольный арбитраж использует разницу в обменных курсах для получения безрисковой прибыли.
Что такое треугольный арбитраж?
Арбитраж – довольно любопытная стратегия, запрещенная в букмекерских конторах. Представьте, что коэффициент выигрыша на победу "Реала" в Чемпионате 2024 года составляет 1,25, а у "Боруссии" — 3,60. Это значит, что вероятность победы "Реала" составляет 100/1,25 = 80%, а вероятность победы "Боруссии" — 27,7%. Если сложить эти два показателя, то получится 107,7%, потому что букмекеры хотят выиграть деньги, а сумма, превышающая 100%, — это их комиссия. Но представьте, что вы нашли букмекера, который предлагает коэффициент на победу "Боруссии" в размере 19%, коэффициент - 5,26. Тогда вы можете сделать ставку в первой букмекерской конторе на "Реал", а во второй — на "Боруссию", и если вы поставите соответствующую сумму на каждую команду, вы выиграете деньги в игре, потому что оба коэффициента в сумме составляют менее 100%.
Допустим, вы не хотите, чтобы ваш счет был закрыт из-за арбитража. Вы знаете, что даже если вы делаете ставку на "Реал", вы можете сделать "законный" арбитраж, если дождетесь 70-й минуты игры в случае ничьей, или дождетесь, когда "Реал" забьет, чтобы взять коэффициенты на "Боруссию" и выиграть... Вариант немного рискованный, но здесь вы можете воспользоваться преимуществами глубокого обучения. Вы знаете, что "Реал" забьет, поэтому вы получите коэффициент с вероятностью 98% (мы знаем это с помощью коинтеграции между прогнозами и реальными значениями).
Мы дали определение арбитражу и показали, как можно выигрывать с помощью глубокого обучения. Что же такое треугольный арбитраж? Это тот же арбитраж, но с использованием трех пар. Он применяется на форексе и криптовалютах, где эта формула используется для символа A / B. Для решения понадобятся три уравнения: (A / B) * (B / C) * (C / A). При значении > 1, умножаем правым способом, при значении < 1 — левым.
Можно ли проводить треугольный арбитраж со всеми счетами?
Если у вас счет с нулевым спредом, треугольный арбитраж будет выполнен за одну секунду или меньше. Если у вас есть спред, то превзойти его в такой момент невозможно. Но, как я уже говорил, советник остается прибыльным в обоих случаях. Спред на моем счете не нулевой, поэтому в этой статье будет пример со спредами.
Что нам нужно для советника?
Советник использует прогнозы, сделанные в Python для моделей ONNX, чтобы использовать их в советниках для MetaTrader 5. Я собираюсь пройтись по всему процессу, чтобы убедиться, что каждый может использовать этот советник. Если вы знаете, как создать модель ONNX, вы можете сразу перейти к советнику.
Вам нужно будет установить:
- Python 3.10
Вы можете найти его в Microsoft Store.

- Visual Studio Code
Вы также найдете его в Microsoft Store.

После этого вам необходимо установить Visual Studio 2019 или C++ отсюда (будет предложено установить с одной библиотекой Python):
https://learn.microsoft.com/en-US/cpp/windows/latest-supported-vc-redist?view=msvc-170#visual-studio-2015-2017-2019-and-2022 Теперь добавим папку скриптов Python. Также добавим ".py" в PATHEXT.
После того как всё сделано, установим библиотеки.
Open VSC -> Terminal -> New Terminal.
VSC может попросить вас установить расширения Python (просто нажмите "ОК"). А затем скопируйте и вставьте это (и нажмите Enter):
pip install MetaTrader5==5.0.4200
pip install pandas==2.2.1
pip install scipy==1.12.0
pip install statsmodels==0.14.1
pip install numpy==1.26.4
pip install tensorflow==2.15.0
pip install tf2onnx==1.16.1
pip install scikit-learn==1.4.1.post1
pip install keras==2.15.0
pip install matplotlib==3.8.3
Ошибок быть не должно. Если они есть, задайте мне вопрос здесь.
После того, как все необходимые элементы установлены и нет ошибок, переходим к тестовой модели .py. Я скопирую и вставлю следующий пример:
# python libraries
import MetaTrader5 as mt5
import tensorflow as tf
import numpy as np
import pandas as pd
import tf2onnx
from datetime import timedelta, datetime
# input parameters

symbol1 = "EURGBP"
symbol2 = "GBPUSD"
symbol3 = "EURUSD"
sample_size1 = 200000
optional = "_M1_test"
timeframe = mt5.TIMEFRAME_M1

#end_date = datetime.now()
end_date = datetime(2024, 3, 4, 0)

inp_history_size = 120

sample_size = sample_size1
symbol = symbol1
optional = optional
inp_model_name = str(symbol)+"_"+str(optional)+".onnx"

if not mt5.initialize():
    print("initialize() failed, error code =",mt5.last_error())
    quit()

# we will save generated onnx-file near our script to use as resource
from sys import argv
data_path=argv[0]
last_index=data_path.rfind("\\")+1
data_path=data_path[0:last_index]
print("data path to save onnx model",data_path)

# and save to MQL5\Files folder to use as file
terminal_info=mt5.terminal_info()
file_path=terminal_info.data_path+"\\MQL5\\Files\\"
print("file path to save onnx model",file_path)

# set start and end dates for history data

#end_date = datetime.now()
#end_date = datetime(2024, 5, 1, 0)
start_date = end_date - timedelta(days=inp_history_size*20)

# print start and end dates
print("data start date =",start_date)
print("data end date =",end_date)

# get rates
eurusd_rates = mt5.copy_rates_from(symbol, timeframe , end_date, sample_size )

# create dataframe
df=pd.DataFrame()
df = pd.DataFrame(eurusd_rates)
print(df)
# Extraer los precios de cierre directamente
datas = df['close'].values

"""# Calcular la inversa de cada valor
inverted_data = 1 / datas

# Convertir los datos invertidos a un array de numpy si es necesario
data = inverted_data.values"""

data = datas.reshape(-1,1)
# Imprimir los resultados
"""data = datas"""
# scale data
from sklearn.preprocessing import MinMaxScaler
scaler=MinMaxScaler(feature_range=(0,1))
scaled_data = scaler.fit_transform(data)

# training size is 80% of the data
training_size = int(len(scaled_data)*0.80)
print("Training_size:",training_size)
train_data_initial = scaled_data[0:training_size,:]
test_data_initial = scaled_data[training_size:,:1]

# split a univariate sequence into samples
def split_sequence(sequence, n_steps):
    X, y = list(), list()
    for i in range(len(sequence)):
       # find the end of this pattern
       end_ix = i + n_steps
       # check if we are beyond the sequence
       if end_ix > len(sequence)-1:
          break
       # gather input and output parts of the pattern
       seq_x, seq_y = sequence[i:end_ix], sequence[end_ix]
       X.append(seq_x)
       y.append(seq_y)
    return np.array(X), np.array(y)

# split into samples
time_step = inp_history_size
x_train, y_train = split_sequence(train_data_initial, time_step)
x_test, y_test = split_sequence(test_data_initial, time_step)

# reshape input to be [samples, time steps, features] which is required for LSTM
x_train =x_train.reshape(x_train.shape[0],x_train.shape[1],1)
x_test = x_test.reshape(x_test.shape[0],x_test.shape[1],1)


# define model
from keras.models import Sequential
from keras.layers import Dense, Activation, Conv1D, MaxPooling1D, Dropout, Flatten, LSTM
from keras.metrics import RootMeanSquaredError as rmse
from tensorflow.keras import callbacks
model = Sequential()
model.add(Conv1D(filters=256, kernel_size=2, activation='relu',padding = 'same',input_shape=(inp_history_size,1)))
model.add(MaxPooling1D(pool_size=2))
model.add(LSTM(100, return_sequences = True))
model.add(Dropout(0.3))
model.add(LSTM(100, return_sequences = False))
model.add(Dropout(0.3))
model.add(Dense(units=1, activation = 'sigmoid'))
model.compile(optimizer='adam', loss= 'mse' , metrics = [rmse()])

# Set up early stopping
early_stopping = callbacks.EarlyStopping(
    monitor='val_loss',
    patience=5,
    restore_best_weights=True,
)

# model training for 300 epochs
history = model.fit(x_train, y_train, epochs = 300 , validation_data = (x_test,y_test), batch_size=32, callbacks=[early_stopping], verbose=2)

# evaluate training data
train_loss, train_rmse = model.evaluate(x_train,y_train, batch_size = 32)
print(f"train_loss={train_loss:.3f}")
print(f"train_rmse={train_rmse:.3f}")

# evaluate testing data
test_loss, test_rmse = model.evaluate(x_test,y_test, batch_size = 32)
print(f"test_loss={test_loss:.3f}")
print(f"test_rmse={test_rmse:.3f}")

# save model to ONNX
output_path = data_path+inp_model_name
onnx_model = tf2onnx.convert.from_keras(model, output_path=output_path)
print(f"saved model to {output_path}")

output_path = file_path+inp_model_name
onnx_model = tf2onnx.convert.from_keras(model, output_path=output_path)
print(f"saved model to {output_path}")

# finish
mt5.shutdown()
#prediction using testing data

#prediction using testing data
test_predict = model.predict(x_test)
print(test_predict)
print("longitud total de la prediccion: ", len(test_predict))
print("longitud total del sample: ", sample_size)

plot_y_test = np.array(y_test).reshape(-1, 1)  # Selecciona solo el último elemento de cada muestra de prueba
plot_y_train = y_train.reshape(-1,1)
train_predict = model.predict(x_train)
#print(plot_y_test)

#calculate metrics
from sklearn import metrics
from sklearn.metrics import r2_score
#transform data to real values
value1=scaler.inverse_transform(plot_y_test)
#print(value1)
# Escala las predicciones inversas al transformarlas a la escala original
value2 = scaler.inverse_transform(test_predict.reshape(-1, 1))
#print(value2)
#calc score
score = np.sqrt(metrics.mean_squared_error(value1,value2))

print("RMSE         : {}".format(score))
print("MSE          :", metrics.mean_squared_error(value1,value2))
print("R2 score     :",metrics.r2_score(value1,value2))


#sumarize model
model.summary()

#Print error
value11=pd.DataFrame(value1)
value22=pd.DataFrame(value2)
#print(value11)
#print(value22)


value111=value11.iloc[:,:]
value222=value22.iloc[:,:]

print("longitud salida (tandas de 1 minuto): ",len(value111) )
#print("en horas son " + str((len(value111))*60*24)+ " minutos")
print("en horas son " + str(((len(value111)))/60)+ " horas")
print("en horas son " + str(((len(value111)))/60/24)+ " dias")


# Calculate error
error = value111 - value222

import matplotlib.pyplot as plt
# Plot error
plt.figure(figsize=(10, 6))
plt.scatter(range(len(error)), error, color='blue', label='Error')
plt.axhline(y=0, color='red', linestyle='--', linewidth=1)  # Línea horizontal en y=0
plt.title('Error de Predicción ' + str(symbol))
plt.xlabel('Índice de la muestra')
plt.ylabel('Error')
plt.legend()
plt.grid(True)
plt.savefig(str(symbol)+str(optional)+'.png')

rmse_ = format(score)
mse_ = metrics.mean_squared_error(value1,value2)
r2_ = metrics.r2_score(value1,value2)

resultados= [rmse_,mse_,r2_]

# Abre un archivo en modo escritura
with open(str(symbol)+str(optional)+"results.txt", "w") as archivo:
    # Escribe cada resultado en una línea separada
    for resultado in resultados:
        archivo.write(str(resultado) + "\n")

# finish
mt5.shutdown()

#show iteration-rmse graph for training and validation
plt.figure(figsize = (18,10))
plt.plot(history.history['root_mean_squared_error'],label='Training RMSE',color='b')
plt.plot(history.history['val_root_mean_squared_error'],label='Validation-RMSE',color='g')
plt.xlabel("Iteration")
plt.ylabel("RMSE")
plt.title("RMSE" + str(symbol))
plt.legend()
plt.savefig(str(symbol)+str(optional)+'1.png')

#show iteration-loss graph for training and validation
plt.figure(figsize = (18,10))
plt.plot(history.history['loss'],label='Training Loss',color='b')
plt.plot(history.history['val_loss'],label='Validation-loss',color='g')
plt.xlabel("Iteration")
plt.ylabel("Loss")
plt.title("LOSS" + str(symbol))
plt.legend()
plt.savefig(str(symbol)+str(optional)+'2.png')

#show actual vs predicted (training) graph
plt.figure(figsize=(18,10))
plt.plot(scaler.inverse_transform(plot_y_train),color = 'b', label = 'Original')
plt.plot(scaler.inverse_transform(train_predict),color='red', label = 'Predicted')
plt.title("Prediction Graph Using Training Data" + str(symbol))
plt.xlabel("Hours")
plt.ylabel("Price")
plt.legend()
plt.savefig(str(symbol)+str(optional)+'3.png')

#show actual vs predicted (testing) graph
plt.figure(figsize=(18,10))
plt.plot(scaler.inverse_transform(plot_y_test),color = 'b',  label = 'Original')
plt.plot(scaler.inverse_transform(test_predict),color='g', label = 'Predicted')
plt.title("Prediction Graph Using Testing Data" + str(symbol))
plt.xlabel("Hours")
plt.ylabel("Price")
plt.legend()
plt.savefig(str(symbol)+str(optional)+'4.png')


################################################################################################ EURJPY 1


# python libraries
import MetaTrader5 as mt5
import tensorflow as tf
import numpy as np
import pandas as pd
import tf2onnx

# input parameters

inp_history_size = 120

sample_size = sample_size1
symbol = symbol2
optional = optional
inp_model_name = str(symbol)+"_"+str(optional)+".onnx"

if not mt5.initialize():
    print("initialize() failed, error code =",mt5.last_error())
    quit()

# we will save generated onnx-file near our script to use as resource
from sys import argv
data_path=argv[0]
last_index=data_path.rfind("\\")+1
data_path=data_path[0:last_index]
print("data path to save onnx model",data_path)

# and save to MQL5\Files folder to use as file
terminal_info=mt5.terminal_info()
file_path=terminal_info.data_path+"\\MQL5\\Files\\"
print("file path to save onnx model",file_path)

# set start and end dates for history data
from datetime import timedelta, datetime
#end_date = datetime.now()
#end_date = datetime(2024, 5, 1, 0)
start_date = end_date - timedelta(days=inp_history_size*20)

# print start and end dates
print("data start date =",start_date)
print("data end date =",end_date)

# get rates
eurusd_rates2 = mt5.copy_rates_from(symbol, timeframe ,  end_date, sample_size)
# create dataframe
df=pd.DataFrame()
df2 = pd.DataFrame(eurusd_rates2)
print(df2)
# Extraer los precios de cierre directamente
datas2 = df2['close'].values

"""inverted_data = 1 / datas

# Convertir los datos invertidos a un array de numpy si es necesario
data = inverted_data.values"""
data2 = datas2.reshape(-1,1)


# Convertir los datos invertidos a un array de numpy si es necesario
#data = datas.values

# Imprimir los resultados

# scale data
from sklearn.preprocessing import MinMaxScaler
scaler2=MinMaxScaler(feature_range=(0,1))
scaled_data2 = scaler2.fit_transform(data2)

# training size is 80% of the data
training_size2 = int(len(scaled_data2)*0.80)
print("Training_size:",training_size2)
train_data_initial2 = scaled_data2[0:training_size2,:]
test_data_initial2 = scaled_data2[training_size2:,:1]

# split a univariate sequence into samples
def split_sequence(sequence, n_steps):
    X, y = list(), list()
    for i in range(len(sequence)):
       # find the end of this pattern
       end_ix = i + n_steps
       # check if we are beyond the sequence
       if end_ix > len(sequence)-1:
          break
       # gather input and output parts of the pattern
       seq_x, seq_y = sequence[i:end_ix], sequence[end_ix]
       X.append(seq_x)
       y.append(seq_y)
    return np.array(X), np.array(y)

# split into samples
time_step = inp_history_size
x_train2, y_train2 = split_sequence(train_data_initial2, time_step)
x_test2, y_test2 = split_sequence(test_data_initial2, time_step)

# reshape input to be [samples, time steps, features] which is required for LSTM
x_train2 =x_train2.reshape(x_train2.shape[0],x_train2.shape[1],1)
x_test2 = x_test2.reshape(x_test2.shape[0],x_test2.shape[1],1)


# define model
from keras.models import Sequential
from keras.layers import Dense, Activation, Conv1D, MaxPooling1D, Dropout, Flatten, LSTM
from keras.metrics import RootMeanSquaredError as rmse
from tensorflow.keras import callbacks
model = Sequential()
model.add(Conv1D(filters=256, kernel_size=2, activation='relu',padding = 'same',input_shape=(inp_history_size,1)))
model.add(MaxPooling1D(pool_size=2))
model.add(LSTM(100, return_sequences = True))
model.add(Dropout(0.3))
model.add(LSTM(100, return_sequences = False))
model.add(Dropout(0.3))
model.add(Dense(units=1, activation = 'sigmoid'))
model.compile(optimizer='adam', loss= 'mse' , metrics = [rmse()])

# Set up early stopping
early_stopping = callbacks.EarlyStopping(
    monitor='val_loss',
    patience=5,
    restore_best_weights=True,
)

# model training for 300 epochs
history2 = model.fit(x_train2, y_train2, epochs = 300 , validation_data = (x_test2,y_test2), batch_size=32, callbacks=[early_stopping], verbose=2)

# evaluate training data
train_loss2, train_rmse2 = model.evaluate(x_train2,y_train2, batch_size = 32)
print(f"train_loss={train_loss2:.3f}")
print(f"train_rmse={train_rmse2:.3f}")

# evaluate testing data
test_loss2, test_rmse2 = model.evaluate(x_test2,y_test2, batch_size = 32)
print(f"test_loss={test_loss2:.3f}")
print(f"test_rmse={test_rmse2:.3f}")

# save model to ONNX
output_path = data_path+inp_model_name
onnx_model = tf2onnx.convert.from_keras(model, output_path=output_path)
print(f"saved model to {output_path}")

output_path = file_path+inp_model_name
onnx_model = tf2onnx.convert.from_keras(model, output_path=output_path)
print(f"saved model to {output_path}")

# finish
mt5.shutdown()
#prediction using testing data

#prediction using testing data
test_predict2 = model.predict(x_test2)
print(test_predict2)
print("longitud total de la prediccion: ", len(test_predict2))
print("longitud total del sample: ", sample_size)

plot_y_test2 = np.array(y_test2).reshape(-1, 1)  # Selecciona solo el último elemento de cada muestra de prueba
plot_y_train2 = y_train2.reshape(-1,1)
train_predict2 = model.predict(x_train2)
#print(plot_y_test)

#calculate metrics
from sklearn import metrics
from sklearn.metrics import r2_score
#transform data to real values
value12=scaler2.inverse_transform(plot_y_test2)
#print(value1)
# Escala las predicciones inversas al transformarlas a la escala original
value22 = scaler2.inverse_transform(test_predict2.reshape(-1, 1))
#print(value2)
#calc score
score2 = np.sqrt(metrics.mean_squared_error(value12,value22))

print("RMSE         : {}".format(score2))
print("MSE          :", metrics.mean_squared_error(value12,value22))
print("R2 score     :",metrics.r2_score(value12,value22))


#sumarize model
model.summary()

#Print error
value112=pd.DataFrame(value12)
value222=pd.DataFrame(value22)
#print(value11)
#print(value22)


value1112=value112.iloc[:,:]
value2222=value222.iloc[:,:]

print("longitud salida (tandas de 1 min): ",len(value1112) )
#print("en horas son " + str((len(value1112))*60*24)+ " minutos")
print("en horas son " + str(((len(value1112)))/60)+ " horas")
print("en horas son " + str(((len(value1112)))/60/24)+ " dias")


# Calculate error
error2 = value1112 - value2222

import matplotlib.pyplot as plt
# Plot error
plt.figure(figsize=(10, 6))
plt.scatter(range(len(error2)), error2, color='blue', label='Error')
plt.axhline(y=0, color='red', linestyle='--', linewidth=1)  # Línea horizontal en y=0
plt.title('Error de Predicción ' + str(symbol))
plt.xlabel('Índice de la muestra')
plt.ylabel('Error')
plt.legend()
plt.grid(True)
plt.savefig(str(symbol)+str(optional)+'.png')

rmse_2 = format(score2)
mse_2 = metrics.mean_squared_error(value12,value22)
r2_2 = metrics.r2_score(value12,value22)

resultados2= [rmse_2,mse_2,r2_2]

# Abre un archivo en modo escritura
with open(str(symbol)+str(optional)+"results.txt", "w") as archivo:
    # Escribe cada resultado en una línea separada
    for resultado in resultados2:
        archivo.write(str(resultado) + "\n")

# finish
mt5.shutdown()

#show iteration-rmse graph for training and validation
plt.figure(figsize = (18,10))
plt.plot(history2.history['root_mean_squared_error'],label='Training RMSE',color='b')
plt.plot(history2.history['val_root_mean_squared_error'],label='Validation-RMSE',color='g')
plt.xlabel("Iteration")
plt.ylabel("RMSE")
plt.title("RMSE" + str(symbol))
plt.legend()
plt.savefig(str(symbol)+str(optional)+'1.png')

#show iteration-loss graph for training and validation
plt.figure(figsize = (18,10))
plt.plot(history2.history['loss'],label='Training Loss',color='b')
plt.plot(history2.history['val_loss'],label='Validation-loss',color='g')
plt.xlabel("Iteration")
plt.ylabel("Loss")
plt.title("LOSS" + str(symbol))
plt.legend()
plt.savefig(str(symbol)+str(optional)+'2.png')

#show actual vs predicted (training) graph
plt.figure(figsize=(18,10))
plt.plot(scaler2.inverse_transform(plot_y_train2),color = 'b', label = 'Original')
plt.plot(scaler2.inverse_transform(train_predict2),color='red', label = 'Predicted')
plt.title("Prediction Graph Using Training Data" + str(symbol))
plt.xlabel("Hours")
plt.ylabel("Price")
plt.legend()
plt.savefig(str(symbol)+str(optional)+'3.png')

#show actual vs predicted (testing) graph
plt.figure(figsize=(18,10))
plt.plot(scaler2.inverse_transform(plot_y_test2),color = 'b',  label = 'Original')
plt.plot(scaler2.inverse_transform(test_predict2),color='g', label = 'Predicted')
plt.title("Prediction Graph Using Testing Data" + str(symbol))
plt.xlabel("Hours")
plt.ylabel("Price")
plt.legend()
plt.savefig(str(symbol)+str(optional)+'4.png')


##############################################################################################  JPYUSD


# python libraries
import MetaTrader5 as mt5
import tensorflow as tf
import numpy as np
import pandas as pd
import tf2onnx

# input parameters

inp_history_size = 120

sample_size = sample_size1
symbol = symbol3
optional = optional
inp_model_name = str(symbol)+"_"+str(optional)+".onnx"

if not mt5.initialize():
    print("initialize() failed, error code =",mt5.last_error())
    quit()

# we will save generated onnx-file near our script to use as resource
from sys import argv
data_path=argv[0]
last_index=data_path.rfind("\\")+1
data_path=data_path[0:last_index]
print("data path to save onnx model",data_path)

# and save to MQL5\Files folder to use as file
terminal_info=mt5.terminal_info()
file_path=terminal_info.data_path+"\\MQL5\\Files\\"
print("file path to save onnx model",file_path)

# set start and end dates for history data
from datetime import timedelta, datetime
#end_date = datetime.now()
#end_date = datetime(2024, 5, 1, 0)
start_date = end_date - timedelta(days=inp_history_size*20)

# print start and end dates
print("data start date =",start_date)
print("data end date =",end_date)

# get rates
eurusd_rates3 = mt5.copy_rates_from(symbol, timeframe ,  end_date, sample_size)
# create dataframe
df3=pd.DataFrame()
df3 = pd.DataFrame(eurusd_rates3)
print(df3)
# Extraer los precios de cierre directamente
datas3 = df3['close'].values

"""# Calcular la inversa de cada valor
inverted_data = 1 / datas

# Convertir los datos invertidos a un array de numpy si es necesario
data = inverted_data.values"""
data3 = datas3.reshape(-1,1)
# Imprimir los resultados
"""data = datas"""
# scale data
from sklearn.preprocessing import MinMaxScaler
scaler3=MinMaxScaler(feature_range=(0,1))
scaled_data3 = scaler3.fit_transform(data3)

# training size is 80% of the data
training_size3 = int(len(scaled_data3)*0.80)
print("Training_size:",training_size3)
train_data_initial3 = scaled_data3[0:training_size3,:]
test_data_initial3 = scaled_data3[training_size3:,:1]

# split a univariate sequence into samples
def split_sequence(sequence, n_steps):
    X, y = list(), list()
    for i in range(len(sequence)):
       # find the end of this pattern
       end_ix = i + n_steps
       # check if we are beyond the sequence
       if end_ix > len(sequence)-1:
          break
       # gather input and output parts of the pattern
       seq_x, seq_y = sequence[i:end_ix], sequence[end_ix]
       X.append(seq_x)
       y.append(seq_y)
    return np.array(X), np.array(y)

# split into samples
time_step = inp_history_size
x_train3, y_train3 = split_sequence(train_data_initial3, time_step)
x_test3, y_test3 = split_sequence(test_data_initial3, time_step)

# reshape input to be [samples, time steps, features] which is required for LSTM
x_train3 =x_train3.reshape(x_train3.shape[0],x_train3.shape[1],1)
x_test3 = x_test3.reshape(x_test3.shape[0],x_test3.shape[1],1)


# define model
from keras.models import Sequential
from keras.layers import Dense, Activation, Conv1D, MaxPooling1D, Dropout, Flatten, LSTM
from keras.metrics import RootMeanSquaredError as rmse
from tensorflow.keras import callbacks
model = Sequential()
model.add(Conv1D(filters=256, kernel_size=2, activation='relu',padding = 'same',input_shape=(inp_history_size,1)))
model.add(MaxPooling1D(pool_size=2))
model.add(LSTM(100, return_sequences = True))
model.add(Dropout(0.3))
model.add(LSTM(100, return_sequences = False))
model.add(Dropout(0.3))
model.add(Dense(units=1, activation = 'sigmoid'))
model.compile(optimizer='adam', loss= 'mse' , metrics = [rmse()])

# Set up early stopping
early_stopping = callbacks.EarlyStopping(
    monitor='val_loss',
    patience=5,
    restore_best_weights=True,
)

# model training for 300 epochs
history3 = model.fit(x_train3, y_train3, epochs = 300 , validation_data = (x_test3,y_test3), batch_size=32, callbacks=[early_stopping], verbose=2)

# evaluate training data
train_loss3, train_rmse3 = model.evaluate(x_train3,y_train3, batch_size = 32)
print(f"train_loss={train_loss3:.3f}")
print(f"train_rmse={train_rmse3:.3f}")

# evaluate testing data
test_loss3, test_rmse3 = model.evaluate(x_test3,y_test3, batch_size = 32)
print(f"test_loss={test_loss3:.3f}")
print(f"test_rmse={test_rmse3:.3f}")

# save model to ONNX
output_path = data_path+inp_model_name
onnx_model = tf2onnx.convert.from_keras(model, output_path=output_path)
print(f"saved model to {output_path}")

output_path = file_path+inp_model_name
onnx_model = tf2onnx.convert.from_keras(model, output_path=output_path)
print(f"saved model to {output_path}")

# finish
mt5.shutdown()
#prediction using testing data

#prediction using testing data
test_predict3 = model.predict(x_test3)
print(test_predict3)
print("longitud total de la prediccion: ", len(test_predict3))
print("longitud total del sample: ", sample_size)

plot_y_test3 = np.array(y_test3).reshape(-1, 1)  # Selecciona solo el último elemento de cada muestra de prueba
plot_y_train3 = y_train3.reshape(-1,1)
train_predict3 = model.predict(x_train3)
#print(plot_y_test)

#calculate metrics
from sklearn import metrics
from sklearn.metrics import r2_score
#transform data to real values
value13=scaler3.inverse_transform(plot_y_test3)
#print(value1)
# Escala las predicciones inversas al transformarlas a la escala original
value23 = scaler3.inverse_transform(test_predict3.reshape(-1, 1))
#print(value2)
#calc score
score3 = np.sqrt(metrics.mean_squared_error(value13,value23))

print("RMSE         : {}".format(score3))
print("MSE          :", metrics.mean_squared_error(value13,value23))
print("R2 score     :",metrics.r2_score(value13,value23))


#sumarize model
model.summary()

#Print error
value113=pd.DataFrame(value13)
value223=pd.DataFrame(value23)
#print(value11)
#print(value22)


value1113=value113.iloc[:,:]
value2223=value223.iloc[:,:]

print("longitud salida (tandas de 1 hora): ",len(value1113) )
#print("en horas son " + str((len(value1113))*60*24)+ " minutos")
print("en horas son " + str(((len(value1113)))/60)+ " horas")
print("en horas son " + str(((len(value1113)))/60/24)+ " dias")


# Calculate error
error3 = value1113 - value2223

import matplotlib.pyplot as plt
# Plot error
plt.figure(figsize=(10, 6))
plt.scatter(range(len(error3)), error3, color='blue', label='Error')
plt.axhline(y=0, color='red', linestyle='--', linewidth=1)  # Línea horizontal en y=0
plt.title('Error de Predicción ' + str(symbol))
plt.xlabel('Índice de la muestra')
plt.ylabel('Error')
plt.legend()
plt.grid(True)
plt.savefig(str(symbol)+str(optional)+'.png')

rmse_3 = format(score3)
mse_3 = metrics.mean_squared_error(value13,value23)
r2_3 = metrics.r2_score(value13,value23)

resultados3= [rmse_3,mse_3,r2_3]

# Abre un archivo en modo escritura
with open(str(symbol)+str(optional)+"results.txt", "w") as archivo:
    # Escribe cada resultado en una línea separada
    for resultado in resultados3:
        archivo.write(str(resultado) + "\n")

# finish
mt5.shutdown()

#show iteration-rmse graph for training and validation
plt.figure(figsize = (18,10))
plt.plot(history3.history['root_mean_squared_error'],label='Training RMSE',color='b')
plt.plot(history3.history['val_root_mean_squared_error'],label='Validation-RMSE',color='g')
plt.xlabel("Iteration")
plt.ylabel("RMSE")
plt.title("RMSE" + str(symbol))
plt.legend()
plt.savefig(str(symbol)+str(optional)+'1.png')

#show iteration-loss graph for training and validation
plt.figure(figsize = (18,10))
plt.plot(history3.history['loss'],label='Training Loss',color='b')
plt.plot(history3.history['val_loss'],label='Validation-loss',color='g')
plt.xlabel("Iteration")
plt.ylabel("Loss")
plt.title("LOSS" + str(symbol))
plt.legend()
plt.savefig(str(symbol)+str(optional)+'2.png')

#show actual vs predicted (training) graph
plt.figure(figsize=(18,10))
plt.plot(scaler3.inverse_transform(plot_y_train3),color = 'b', label = 'Original')
plt.plot(scaler3.inverse_transform(train_predict3),color='red', label = 'Predicted')
plt.title("Prediction Graph Using Training Data" + str(symbol))
plt.xlabel("Hours")
plt.ylabel("Price")
plt.legend()
plt.savefig(str(symbol)+str(optional)+'3.png')

#show actual vs predicted (testing) graph
plt.figure(figsize=(18,10))
plt.plot(scaler3.inverse_transform(plot_y_test3),color = 'b',  label = 'Original')
plt.plot(scaler3.inverse_transform(test_predict3),color='g', label = 'Predicted')
plt.title("Prediction Graph Using Testing Data" + str(symbol))
plt.xlabel("Hours")
plt.ylabel("Price")
plt.legend()
plt.savefig(str(symbol)+str(optional)+'4.png')

################################################################################################
##############################################################################################
"""
import onnxruntime as ort
import numpy as np

# Cargar el modelo ONNX
sesion = ort.InferenceSession("EURUSD_M1_inverse_test.onnx")

# Obtener el nombre de la entrada y la salida del modelo
input_name = sesion.get_inputs()[0].name
output_name = sesion.get_outputs()[0].name

# Crear datos de entrada de prueba como un array de numpy
# Asegúrate de que los datos de entrada coincidan con la forma y el tipo esperado por el modelo
input_data = [1,120] #np.random.rand(1, 10).astype(np.float32)  # Ejemplo: entrada de tamaño [1, 10]

# Realizar la inferencia
result = sesion.run([output_name], {input_name: input_data})

# Imprimir el resultado
print(result)
"""
.py создаст три ONNX, а также несколько графиков и данных, чтобы можно было проверить, все ли в порядке.
Данные поступают в текстовом файле, и каждое число обозначает RMSE, MSE и R2 соответственно.
Перед запуском скрипта необходимо указать символы, размер выборки, временные рамки и конечную дату (от которой начинается обратный отсчет периодов).
Переменная optional — это строка, в которую вы можете добавить что-то вроде M1 Ticks или end_date - что угодно, чтобы сохранить файлы ONNX, а также графики и данные.
symbol1 = "EURGBP"
symbol2 = "GBPUSD"
symbol3 = "EURUSD"
sample_size1 = 200000
optional = "_M1_test"
timeframe = mt5.TIMEFRAME_M1

#end_date = datetime.now()
end_date = datetime(2024, 3, 4, 0)
Если вы хотите провести тестирование в тестере стратегий, измените дату по своему усмотрению. Если вы хотите торговать, используйте end_date.
end_date = datetime.now() *** Если вы торгуете на счете с нулевым спредом, вы можете попробовать использовать тики вместо периодов, вам просто нужно заменить ***
eurusd_rates = mt5.copy_rates_from(symbol, timeframe , end_date, sample_size)
на
eurusd_rates = mt5.copy_ticks_from(symbol, end_date, sample_size, mt5.COPY_TICKS_ALL)
Здесь у вас будут тики Bid и Ask. Я думаю, что есть ограничение на количество тиков. Если вам нужно больше тиков, вы можете загрузить все тики из символа с помощью бесплатной утилиты Download all data from a symbol.
Чтобы запустить файл .py, просто откройте его с помощью VSC и нажмите RUN -> Run Without Debugging (при открытом MetaTrader 5). Дождитесь окончания.
В итоге вы получите кучу графиков, текстовых файлов и файлов ONNX. Необходимо сохранить файл ONNX в папке MQL5/Files и указать тот же путь в коде советника.
Он по-прежнему будет работать благодаря следующей строке:
# and save to MQL5\Files folder to use as file
terminal_info=mt5.terminal_info()
file_path=terminal_info.data_path+"\\MQL5\\Files\\"
print("file path to save onnx model",file_path)
Если вы хотите иметь много файлов ONNX, которые находятся в других папках, вам необходимо указать путь.
.py экспортирует изображения, подобные этим:
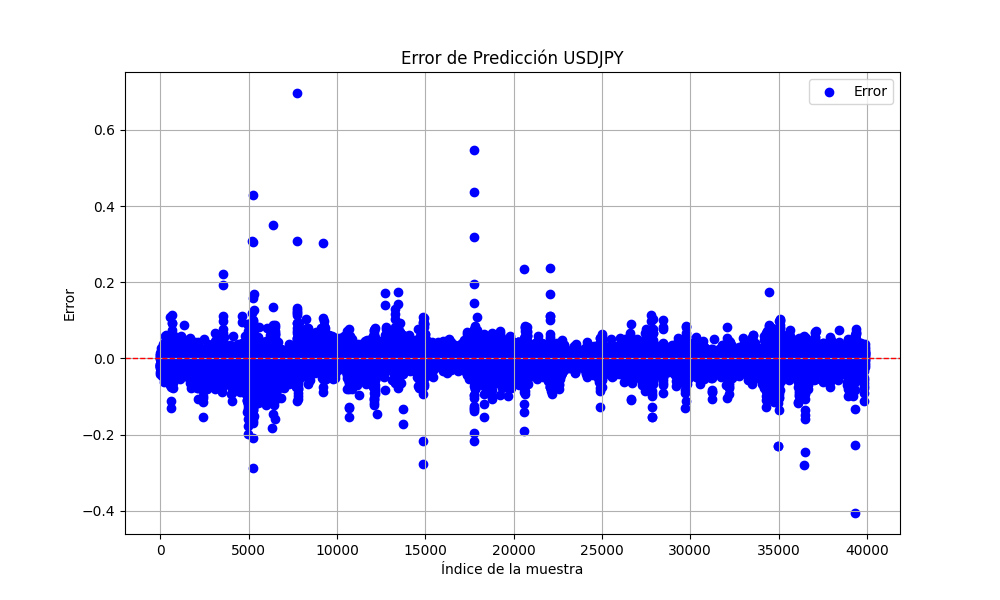
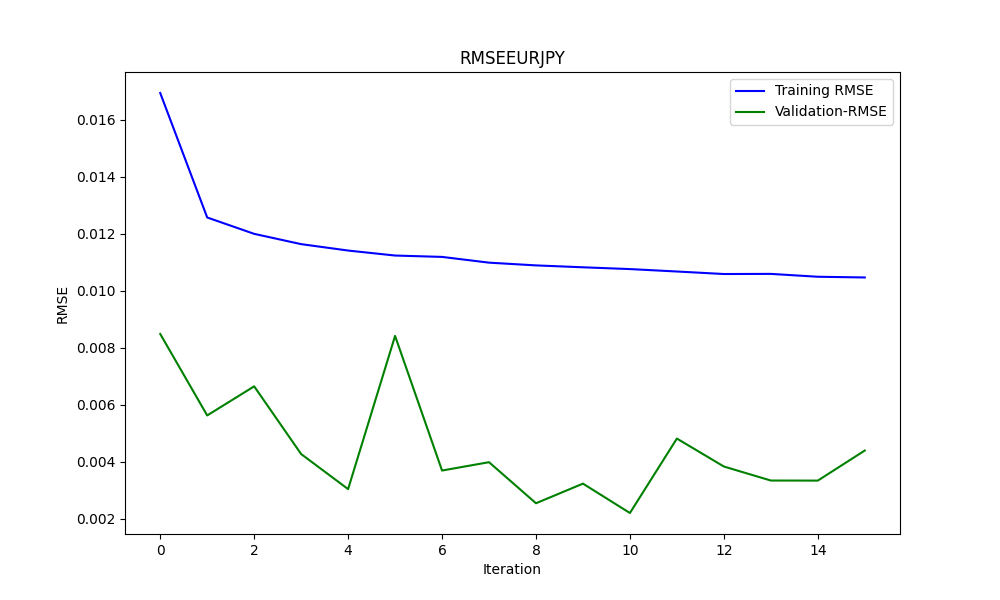
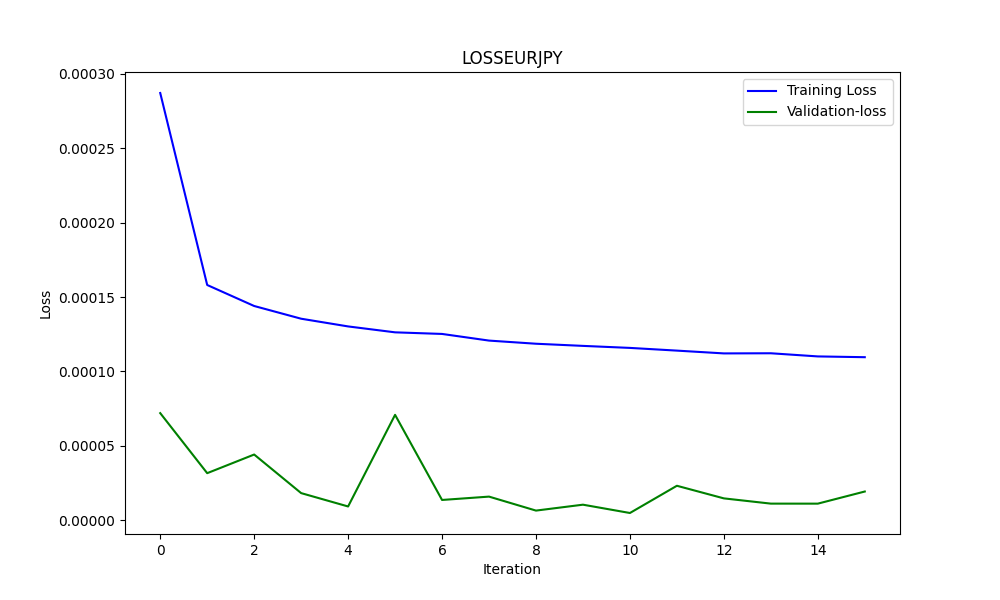
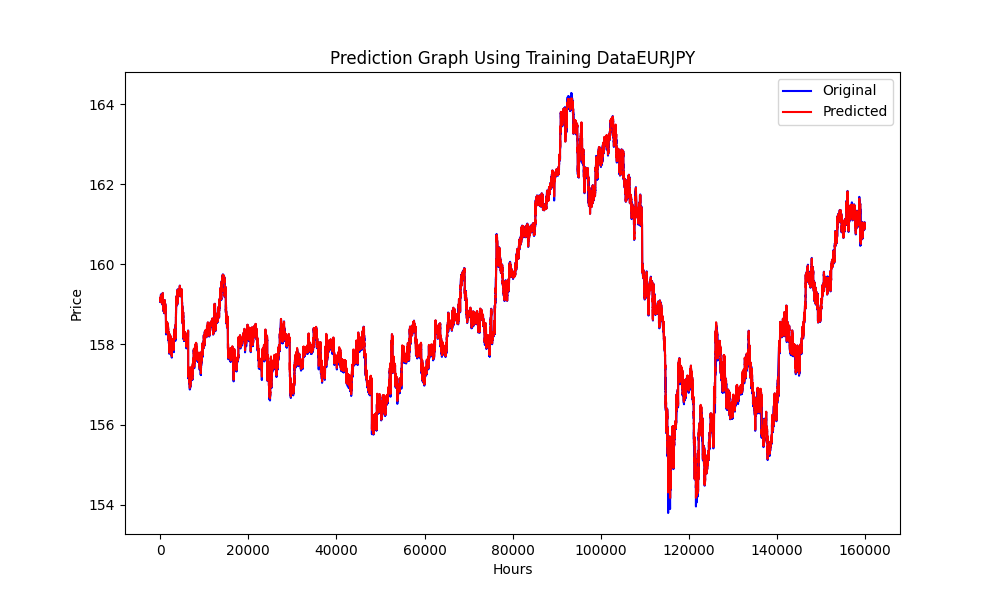
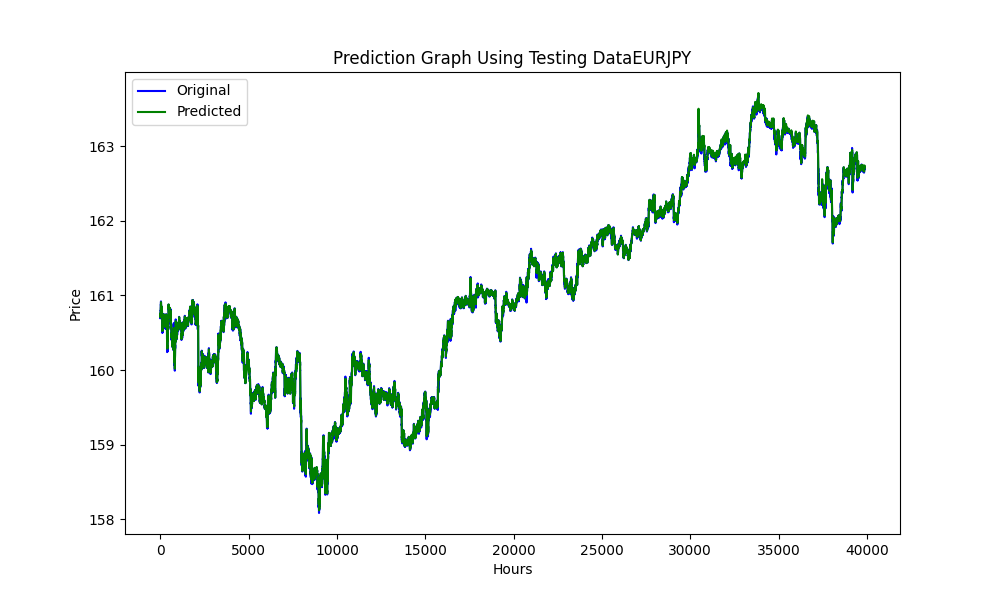
Это графики со значениями RMSE, MSE и R2
0.023019903957086384
0.0005299159781934813
0.999707563612641
Благодаря этому мы можем узнать, являются ли наши модели переобученными или недообученными.
В данном случае:
RMSE измеряет стандартное отклонение остатков (ошибок прогнозирования). Остатки — это мера того, насколько далеко от линии регрессии находятся точки данных; среднеквадратичное отклонение — это мера того, насколько разбросаны эти остатки. Другими словами, он показывает, насколько сконцентрированы данные вокруг линии наилучшего соответствия.
Меньшее значение RMSE указывает на лучшее соответствие. Значение RMSE у нас очень мало, что говорит о том, что модель очень хорошо соответствует набору данных.
MSE похожа на RMSE, но возводит ошибки в квадрат перед их усреднением, что придает больший вес более крупным ошибкам. Это еще один показатель качества оценщика — он всегда неотрицателен, и чем ближе значения к нулю, тем лучше.
Очень малое значение MSE еще раз подтверждает, что прогнозы модели очень близки к фактическим данным.
R2 - это статистическая мера, которая представляет собой долю дисперсии зависимой переменной, объясняемую независимой переменной или переменными в регрессионной модели. Значение 𝑅2, равное 1, указывает на то, что прогнозы регрессии идеально соответствуют данным.
В нашем случае значение R2 очень близко к 1, что указывает на то, что наша модель объясняет почти всю изменчивость вокруг среднего значения. Это превосходный результат.
В целом эти показатели свидетельствуют о том, что наша модель исключительно хорошо прогнозирует или соответствует нашему набору данных.
А чтобы узнать, произошло ли переобучение, мы используем графики, например, в данном случае второй.
Вот анализ, основанный на графике:
-
Потери обучения (синяя линия):
- Эта линия изначально демонстрирует резкий спад, что указывает на то, что модель быстро обучается на тренировочном наборе данных. По мере продолжения итераций потери при обучении продолжают уменьшаться, но более медленными темпами, что типично, поскольку модель начинает стремиться к минимуму.
-
Потеря валидации (зеленая линия):
- Потери при проверке остаются крайне низкими и довольно стабильными на протяжении всего процесса обучения. Это говорит о том, что модель хорошо обобщает, а не просто запоминает обучающие данные. Небольшие колебания указывают на изменчивость производительности проверочного набора на разных итерациях, но остаются в очень узком диапазоне.
В целом график свидетельствует об очень успешном процессе обучения с превосходной сходимостью и обобщением. Низкие потери при проверке особенно многообещающи, поскольку они указывают на то, что модель должна хорошо работать на неизвестных данных, если предположить, что набор для проверки репрезентативен для общего проблемного пространства.
Как только все это будет сделано, передадим модель советнику.
Советник на основе треугольного арбитража с прогнозами
//+------------------------------------------------------------------+
//|                          ONNX_Triangular EURUSD-USDJPY-EURJPY.mq5|
//|             Copyright 2024, Javier S. Gastón de Iriarte Cabrera. |
//|                      https://www.mql5.com/en/users/jsgaston/news |
//+------------------------------------------------------------------+
#property copyright   "Copyright 2024, Javier S. Gastón de Iriarte Cabrera."
#property link        "https://www.mql5.com/en/users/jsgaston/news"
#property version     "1.04"

#property strict
#include <Trade\Trade.mqh>
#define MAGIC (965334)


#resource "/Files/art/arbitrage triangular/eurusdjpy/EURUSD__M1_test.onnx" as uchar ExtModel[]
#resource "/Files/art/arbitrage triangular/eurusdjpy/USDJPY__M1_test.onnx" as uchar ExtModel2[]
#resource "/Files/art/arbitrage triangular/eurusdjpy/EURJPY__M1_test.onnx" as uchar ExtModel3[]
CTrade ExtTrade;

#define SAMPLE_SIZE 120

input double lotSize = 3.0;
//input double slippage = 3;
// Add these inputs to allow dynamic control over SL and TP distances
input double StopLossPips = 50.0; // Stop Loss in pips
input double TakeProfitPips = 100.0; // Take Profit in pips
//input double maxSpreadPoints = 10.0;

input ENUM_TIMEFRAMES Periodo = PERIOD_CURRENT;

//+------------------------------------------------------------------+
//|                                                                  |
//+------------------------------------------------------------------+
string symbol1 = Symbol();
input string symbol2 = "USDJPY";
input string symbol3 = "EURJPY";
int ticket1 = 0;
int ticket2 = 0;
int ticket3 = 0;
int ticket11 = 0;
int ticket22 = 0;
int ticket33 = 0;
input bool isArbitrageActive = true;

double spreads[1000]; // Array para almacenar hasta 1000 spreads
int spreadIndex = 0; // Índice para el próximo spread a almacenar

long     ExtHandle=INVALID_HANDLE;
//int      ExtPredictedClass=-1;
datetime ExtNextBar=0;
datetime ExtNextDay=0;
float    ExtMin=0.0;
float    ExtMax=0.0;


long     ExtHandle2=INVALID_HANDLE;
//int      ExtPredictedClass=-1;
datetime ExtNextBar2=0;
datetime ExtNextDay2=0;
float    ExtMin2=0.0;
float    ExtMax2=0.0;

long     ExtHandle3=INVALID_HANDLE;
//int      ExtPredictedClass=-1;
datetime ExtNextBar3=0;
datetime ExtNextDay3=0;
float    ExtMin3=0.0;
float    ExtMax3=0.0;

float predicted=0.0;
float predicted2=0.0;
float predicted3=0.0;
float predicted2i=0.0;
float predicted3i=0.0;

float   lastPredicted1=0.0;
float   lastPredicted2=0.0;
float   lastPredicted3=0.0;
float   lastPredicted2i=0.0;
float   lastPredicted3i=0.0;

int Order=0;

input double targetProfit = 100.0; // Eur benefit goal
input double maxLoss = -50.0;      // Eur max loss

input double perVar = 0.005; // Percentage of variation to make orders

ulong tickets[6]; // Array para almacenar los tickets de las órdenes

double sl=0.0;
double tp=0.0;

int Abrir = 0;
//+------------------------------------------------------------------+
//| Expert initialization function                                   |
//+------------------------------------------------------------------+
int OnInit()
  {

   ExtTrade.SetExpertMagicNumber(MAGIC);
   Print("EA de arbitraje ONNX iniciado");

//--- create a model from static buffer
   ExtHandle=OnnxCreateFromBuffer(ExtModel,ONNX_DEFAULT);
   if(ExtHandle==INVALID_HANDLE)
     {
      Print("OnnxCreateFromBuffer error ",GetLastError());
      return(INIT_FAILED);
     }

//--- since not all sizes defined in the input tensor we must set them explicitly
//--- first index - batch size, second index - series size, third index - number of series (only Close)
   const long input_shape[] = {1,SAMPLE_SIZE,1};
   if(!OnnxSetInputShape(ExtHandle,ONNX_DEFAULT,input_shape))
     {
      Print("OnnxSetInputShape error ",GetLastError());
      return(INIT_FAILED);
     }

//--- since not all sizes defined in the output tensor we must set them explicitly
//--- first index - batch size, must match the batch size of the input tensor
//--- second index - number of predicted prices (we only predict Close)
   const long output_shape[] = {1,1};
   if(!OnnxSetOutputShape(ExtHandle,0,output_shape))
     {
      Print("OnnxSetOutputShape error ",GetLastError());
      return(INIT_FAILED);
     }

////////////////////////////////////////////////////////////////////////////////////////

//--- create a model from static buffer
   ExtHandle2=OnnxCreateFromBuffer(ExtModel2,ONNX_DEFAULT);
   if(ExtHandle2==INVALID_HANDLE)
     {
      Print("OnnxCreateFromBuffer error ",GetLastError());
      return(INIT_FAILED);
     }

//--- since not all sizes defined in the input tensor we must set them explicitly
//--- first index - batch size, second index - series size, third index - number of series (only Close)
   const long input_shape2[] = {1,SAMPLE_SIZE,1};
   if(!OnnxSetInputShape(ExtHandle2,ONNX_DEFAULT,input_shape2))
     {
      Print("OnnxSetInputShape error ",GetLastError());
      return(INIT_FAILED);
     }

//--- since not all sizes defined in the output tensor we must set them explicitly
//--- first index - batch size, must match the batch size of the input tensor
//--- second index - number of predicted prices (we only predict Close)
   const long output_shape2[] = {1,1};
   if(!OnnxSetOutputShape(ExtHandle2,0,output_shape2))
     {
      Print("OnnxSetOutputShape error ",GetLastError());
      return(INIT_FAILED);
     }

/////////////////////////////////////////////////////////////////////////////////////////////////////////////
//--- create a model from static buffer
   ExtHandle3=OnnxCreateFromBuffer(ExtModel3,ONNX_DEFAULT);
   if(ExtHandle3==INVALID_HANDLE)
     {
      Print("OnnxCreateFromBuffer error ",GetLastError());
      return(INIT_FAILED);
     }

//--- since not all sizes defined in the input tensor we must set them explicitly
//--- first index - batch size, second index - series size, third index - number of series (only Close)
   const long input_shape3[] = {1,SAMPLE_SIZE,1};
   if(!OnnxSetInputShape(ExtHandle3,ONNX_DEFAULT,input_shape3))
     {
      Print("OnnxSetInputShape error ",GetLastError());
      return(INIT_FAILED);
     }

//--- since not all sizes defined in the output tensor we must set them explicitly
//--- first index - batch size, must match the batch size of the input tensor
//--- second index - number of predicted prices (we only predict Close)
   const long output_shape3[] = {1,1};
   if(!OnnxSetOutputShape(ExtHandle3,0,output_shape3))
     {
      Print("OnnxSetOutputShape error ",GetLastError());
      return(INIT_FAILED);
     }

   return(INIT_SUCCEEDED);
  }

//+------------------------------------------------------------------+
//| Expert deinitialization function                                 |
//+------------------------------------------------------------------+
void OnDeinit(const int reason)
  {
   if(ExtHandle!=INVALID_HANDLE)
     {
      OnnxRelease(ExtHandle);
      ExtHandle=INVALID_HANDLE;
     }

   if(ExtHandle2!=INVALID_HANDLE)
     {
      OnnxRelease(ExtHandle2);
      ExtHandle2=INVALID_HANDLE;
     }

   if(ExtHandle3!=INVALID_HANDLE)
     {
      OnnxRelease(ExtHandle3);
      ExtHandle3=INVALID_HANDLE;
     }
  }

//+------------------------------------------------------------------+
//| Expert tick function                                             |
//+------------------------------------------------------------------+
void OnTick()
  {

   SymbolProcessor processor; // Crear instancia de SymbolProcessor

   string A = processor.GetFirstThree(symbol1);
   string B = processor.GetLastThree(symbol1);

   string C = processor.GetFirstThree(symbol2);
   string D = processor.GetLastThree(symbol2);

   string E = processor.GetFirstThree(symbol3);
   string F = processor.GetLastThree(symbol3);

   if((A != E) || (B != C) || (D != F))
     {
      Print("Wrongly selected symbols");
      return;
     }


//--- check new day
   if(TimeCurrent()>=ExtNextDay)
     {
      GetMinMax();
      GetMinMax2();
      GetMinMax3();
      //--- set next day time
      ExtNextDay=TimeCurrent();
      ExtNextDay-=ExtNextDay%PeriodSeconds(Periodo);
      ExtNextDay+=PeriodSeconds(Periodo);

     }

//--- check new bar
   if(TimeCurrent()<ExtNextBar)
     {

      return;
     }
//--- set next bar time
   ExtNextBar=TimeCurrent();
   ExtNextBar-=ExtNextBar%PeriodSeconds();
   ExtNextBar+=PeriodSeconds();
//--- check min and max
   float close=(float)iClose(symbol1,Periodo,0);
   if(ExtMin>close)
      ExtMin=close;
   if(ExtMax<close)
      ExtMax=close;
   float close2=(float)iClose(symbol2,Periodo,0);
   if(ExtMin2>close2)
      ExtMin2=close2;
   if(ExtMax2<close2)
      ExtMax2=close2;
   float close3=(float)iClose(symbol3,Periodo,0);
   if(ExtMin3>close3)
      ExtMin3=close3;
   if(ExtMax3<close3)
      ExtMax3=close3;

   lastPredicted1=predicted;
   lastPredicted2=predicted2;
   lastPredicted3=predicted3;
   lastPredicted2i=predicted2i;
   lastPredicted3i=predicted3i;

//--- predict next price
   PredictPrice();
   PredictPrice2();
   PredictPrice3();


   /*   */
   double price1 = SymbolInfoDouble(symbol1, SYMBOL_BID);/////////////////
   double price2 = SymbolInfoDouble(symbol2, SYMBOL_BID);
   double price2i = 1/price2;
   double price3 = SymbolInfoDouble(symbol3, SYMBOL_ASK);
   double price3i = 1/price3;

   double price11 = SymbolInfoDouble(symbol1, SYMBOL_ASK);/////////////////
   double price22 = SymbolInfoDouble(symbol2, SYMBOL_ASK);
   double price22i = 1/price22;
   double price33 = SymbolInfoDouble(symbol3, SYMBOL_BID);
   double price33i = 1/price33;

   predicted2i = 1/predicted2;
   predicted3i = 1/predicted3;


//double lotSize = 1.0; // Lote base
   double lotSize2 = lotSize * predicted / predicted2;   /// tengo dudas con usar el invertido o no invertido
   double lotSize3 = lotSize * predicted / predicted3;

   double lotSize22 = lotSize * predicted / predicted2;  /// tengo dudas con usar el invertido o no invertido
   double lotSize33 = lotSize * predicted / predicted3;

// Redondear lotes a un múltiplo aceptable por tu bróker
   lotSize2 = NormalizeDouble(lotSize2, 2); // Asume 2 decimales para lotes
   lotSize3 = NormalizeDouble(lotSize3, 2);

   lotSize22 = NormalizeDouble(lotSize22, 2); // Asume 2 decimales para lotes
   lotSize33 = NormalizeDouble(lotSize33, 2);

   int totalPositions = PositionsTotal();

   if(Order==1 || Order==2)
     {
      // Verificar y cerrar órdenes si se cumplen las condiciones
      Print("Verificar y cerrar órdenes si se cumplen las condiciones");
      CheckAndCloseOrders();

     }


   if(!isArbitrageActive || ArePositionsOpen())
     {
      Print("Arbitraje inactivo o ya hay posiciones abiertas.");
      return;
     }
   double varia11 = 100.0 - (close*100/predicted);
   double varia21 = 100.0 - (close2*100/predicted2);
   double varia31 = 100.0 - (predicted3*100/close3);
   double varia12 = 100.0 - (predicted*100/close);
   double varia22 = 100.0 - (predicted2*100/close2);
   double varia32 = 100.0 - (close3*100/predicted3);


   if((varia11 > perVar)   && (varia21 > perVar) && (varia31 > perVar))
     {
      Print("se debería proceder a apertura de ordenes de derechas");
      Abrir = 1;
     }
   if((varia12 > perVar)   && (varia22 > perVar) && (varia32 > perVar))
     {
      Print("se debería proceder a apertura de ordenes de izquierdas");
      Abrir = 2;
     }
   if(Abrir == 1 && (predicted*predicted2*predicted3i>1))
     {
      Print("orden derecha");
      // Inicia el arbitraje si aún no está activo
      if(isArbitrageActive)
        {

         if((ticket1 == 0 && ticket2 == 0 && ticket3 ==0) && (Order==0) &&  totalPositions ==0)
           {
            Print("Preparando para abrir órdenes");
            Order = 1;


            MqlTradeRequest request;
            MqlTradeResult  result;


              {

               MqlRates rates[];
               ArraySetAsSeries(rates,true);
               int copied=CopyRates(symbol1,0,0,1,rates);

               CalculateSL(true,rates[0].close,symbol1);
               CalculateTP(true,rates[0].close,symbol1);

               if(ExtTrade.Buy(lotSize, symbol1, rates[0].close, sl, tp, "Arbitraje"))
                 {
                  tickets[0] = ExtTrade.ResultDeal();  // Getting the ticket of the last trade
                  Print("Order placed with ticket: ", tickets[0]);
                 }
               else
                 {
                  Print("Failed to place order: ", GetLastError());
                 }
              }

              {
               MqlRates rates[];
               ArraySetAsSeries(rates,true);
               int copied=CopyRates(symbol2,0,0,1,rates);

               CalculateSL(true,rates[0].close,symbol2);
               CalculateTP(true,rates[0].close,symbol2);

               if(ExtTrade.Buy(lotSize2, symbol2, rates[0].close, sl, tp, "Arbitraje"))
                 {
                  tickets[1] = ExtTrade.ResultDeal();  // Getting the ticket of the last trade
                  Print("Order placed with ticket: ", tickets[1]);
                 }
               else
                 {
                  Print("Failed to place order: ", GetLastError());
                 }
              }

              {
               MqlRates rates[];
               ArraySetAsSeries(rates,true);
               int copied=CopyRates(symbol3,0,0,1,rates);

               CalculateSL(false,rates[0].close,symbol3);
               CalculateTP(false,rates[0].close,symbol3);


               if(ExtTrade.Sell(lotSize3, symbol3, rates[0].close, sl, tp, "Arbitraje"))
                 {
                  tickets[2] = ExtTrade.ResultDeal();  // Getting the ticket of the last trade
                  Print("Order placed with ticket: ", tickets[2]);
                 }
               else
                 {
                  Print("Failed to place order: ", GetLastError());
                 }
              }


            ticket1=1;
            ticket2=1;
            ticket3=1;
            Abrir=0;

            return;
           }
         else
           {
            Print(" no se puede abrir ordenes");
           }
        }
     }

   if(Abrir == 2 && (predicted*predicted2*predicted3i<1))
     {
      Print("Orden Inversa");
      // Inicia el arbitraje si aún no está activo
      if(isArbitrageActive)
        {

         if((ticket11 == 0 && ticket22 == 0 && ticket33 ==0) && (Order==0) && totalPositions==0)
           {
            Print("Preparando para abrir órdenes");
            Order = 2;

            MqlTradeRequest request;
            MqlTradeResult  result;

              {
               MqlRates rates[];
               ArraySetAsSeries(rates,true);
               int copied=CopyRates(symbol1,0,0,1,rates);

               CalculateSL(false,rates[0].close,symbol1);
               CalculateTP(false,rates[0].close,symbol1);

               if(ExtTrade.Sell(lotSize, symbol1, rates[0].close, sl, tp, "Arbitraje"))
                 {
                  tickets[3] = ExtTrade.ResultDeal();  // Getting the ticket of the last trade
                  Print("Order placed with ticket: ", tickets[3]);
                 }
               else
                 {
                  Print("Failed to place order: ", GetLastError());
                 }
              }

              {
               MqlRates rates[];
               ArraySetAsSeries(rates,true);
               int copied=CopyRates(symbol2,0,0,1,rates);
               CalculateSL(false,rates[0].close,symbol2);
               CalculateTP(false,rates[0].close,symbol2);

               if(ExtTrade.Sell(lotSize2, symbol2, rates[0].close, sl, tp, "Arbitraje"))
                 {
                  tickets[4] = ExtTrade.ResultDeal();  // Getting the ticket of the last trade
                  Print("Order placed with ticket: ", tickets[4]);
                 }
               else
                 {
                  Print("Failed to place order: ", GetLastError());
                 }
              }

              {
               MqlRates rates[];
               ArraySetAsSeries(rates,true);
               int copied=CopyRates(symbol3,0,0,1,rates);

               CalculateSL(true,rates[0].close,symbol3);
               CalculateTP(true,rates[0].close,symbol3);

               if(ExtTrade.Buy(lotSize3, symbol3, rates[0].close, sl, tp, "Arbitraje"))
                 {
                  tickets[5] = ExtTrade.ResultDeal();  // Getting the ticket of the last trade
                  Print("Order placed with ticket: ", tickets[5]);
                 }
               else
                 {
                  Print("Failed to place order: ", GetLastError());
                 }
              }


            ticket11=1;
            ticket22=1;
            ticket33=1;
            Abrir=0;

            return;
           }
         else
           {
            Print(" no se puede abrir ordenes");
           }
        }
     }

  }

//+------------------------------------------------------------------+
//| Postions are open function                                       |
//+------------------------------------------------------------------+
bool ArePositionsOpen()
  {
// Check for positions on symbol1
   if(PositionSelect(symbol1) && PositionGetDouble(POSITION_VOLUME) > 0)
      return true;
// Check for positions on symbol2
   if(PositionSelect(symbol2) && PositionGetDouble(POSITION_VOLUME) > 0)
      return true;
// Check for positions on symbol3
   if(PositionSelect(symbol3) && PositionGetDouble(POSITION_VOLUME) > 0)
      return true;

   return false;
  }
//+------------------------------------------------------------------+
//| Price prediction function                                        |
//+------------------------------------------------------------------+
void PredictPrice(void)
  {
   static vectorf output_data(1);            // vector to get result
   static vectorf x_norm(SAMPLE_SIZE);       // vector for prices normalize

//--- check for normalization possibility
   if(ExtMin>=ExtMax)
     {
      Print("ExtMin>=ExtMax");
      //ExtPredictedClass=-1;
      return;
     }
//--- request last bars
   if(!x_norm.CopyRates(_Symbol,Periodo,COPY_RATES_CLOSE,1,SAMPLE_SIZE))
     {
      Print("CopyRates ",x_norm.Size());
      //ExtPredictedClass=-1;
      return;
     }
   float last_close=x_norm[SAMPLE_SIZE-1];
//--- normalize prices
   x_norm-=ExtMin;
   x_norm/=(ExtMax-ExtMin);
//--- run the inference
   if(!OnnxRun(ExtHandle,ONNX_NO_CONVERSION,x_norm,output_data))
     {
      Print("OnnxRun");
      //ExtPredictedClass=-1;
      return;
     }
//--- denormalize the price from the output value
   predicted=output_data[0]*(ExtMax-ExtMin)+ExtMin;
//return predicted;
  }

//+------------------------------------------------------------------+
//| Price prediction function                                        |
//+------------------------------------------------------------------+
void PredictPrice2(void)
  {
   static vectorf output_data2(1);            // vector to get result
   static vectorf x_norm2(SAMPLE_SIZE);       // vector for prices normalize

//--- check for normalization possibility
   if(ExtMin2>=ExtMax2)
     {
      Print("ExtMin2>=ExtMax2");
      //ExtPredictedClass=-1;
      return;
     }
//--- request last bars
   if(!x_norm2.CopyRates(symbol2,Periodo,COPY_RATES_CLOSE,1,SAMPLE_SIZE))
     {
      Print("CopyRates ",x_norm2.Size());
      //ExtPredictedClass=-1;
      return;
     }
   float last_close2=x_norm2[SAMPLE_SIZE-1];
//--- normalize prices
   x_norm2-=ExtMin2;
   x_norm2/=(ExtMax2-ExtMin2);
//--- run the inference
   if(!OnnxRun(ExtHandle2,ONNX_NO_CONVERSION,x_norm2,output_data2))
     {
      Print("OnnxRun");
      //ExtPredictedClass=-1;
      return;
     }
//--- denormalize the price from the output value
   predicted2=output_data2[0]*(ExtMax2-ExtMin2)+ExtMin2;
//--- classify predicted price movement
//return predicted2;
  }

//+------------------------------------------------------------------+
//| Price prediction function                                        |
//+------------------------------------------------------------------+
void PredictPrice3(void)
  {
   static vectorf output_data3(1);            // vector to get result
   static vectorf x_norm3(SAMPLE_SIZE);       // vector for prices normalize

//--- check for normalization possibility
   if(ExtMin3>=ExtMax3)
     {
      Print("ExtMin3>=ExtMax3");
      //ExtPredictedClass=-1;
      return;
     }
//--- request last bars
   if(!x_norm3.CopyRates(symbol3,Periodo,COPY_RATES_CLOSE,1,SAMPLE_SIZE))
     {
      Print("CopyRates ",x_norm3.Size());
      //ExtPredictedClass=-1;
      return;
     }
   float last_close3=x_norm3[SAMPLE_SIZE-1];
//--- normalize prices
   x_norm3-=ExtMin3;
   x_norm3/=(ExtMax3-ExtMin3);
//--- run the inference
   if(!OnnxRun(ExtHandle3,ONNX_NO_CONVERSION,x_norm3,output_data3))
     {
      Print("OnnxRun");
      //ExtPredictedClass=-1;
      return;
     }
//--- denormalize the price from the output value
   predicted3=output_data3[0]*(ExtMax3-ExtMin3)+ExtMin3;
//--- classify predicted price movement
//return predicted2;
  }

//+------------------------------------------------------------------+
//| Get minimal and maximal Close for last 120 values                |
//+------------------------------------------------------------------+
void GetMinMax(void)
  {
   vectorf closeMN;
   closeMN.CopyRates(symbol1,Periodo,COPY_RATES_CLOSE,0,SAMPLE_SIZE);
   ExtMin=closeMN.Min();
   ExtMax=closeMN.Max();
  }

//+------------------------------------------------------------------+
//| Get minimal and maximal Close for last 120 values                |
//+------------------------------------------------------------------+
void GetMinMax2(void)
  {
   vectorf closeMN2;
   closeMN2.CopyRates(symbol2,Periodo,COPY_RATES_CLOSE,0,SAMPLE_SIZE);
   ExtMin2=closeMN2.Min();
   ExtMax2=closeMN2.Max();
  }

//+------------------------------------------------------------------+
//| Get minimal and maximal Close for last 120 values                |
//+------------------------------------------------------------------+
void GetMinMax3(void)
  {
   vectorf closeMN3;
   closeMN3.CopyRates(symbol3,Periodo,COPY_RATES_CLOSE,0,SAMPLE_SIZE);
   ExtMin3=closeMN3.Min();
   ExtMax3=closeMN3.Max();
  }

//+------------------------------------------------------------------+
//| Symbols class returns both pairs of a symbol                     |
//+------------------------------------------------------------------+
class SymbolProcessor
  {
public:
   // Método para obtener los primeros tres caracteres de un símbolo dado
   string            GetFirstThree(string symbol)
     {
      return StringSubstr(symbol, 0, 3);
     }

   // Método para obtener los últimos tres caracteres de un símbolo dado
   string            GetLastThree(string symbol)
     {
      if(StringLen(symbol) >= 3)
         return StringSubstr(symbol, StringLen(symbol) - 3, 3);
      else
         return ""; // Retorna un string vacío si el símbolo es demasiado corto
     }
  };

//+------------------------------------------------------------------+
//| Calculate total profit from all open positions for the current symbol
//+------------------------------------------------------------------+
double CalculateCurrentArbitrageProfit()
  {
   double totalProfit = 0.0;
   int totalPositions = PositionsTotal(); // Get the total number of open positions

// Loop through all open positions
   for(int i = 0; i < totalPositions; i++)
     {
      // Get the ticket of the position at index i
      ulong ticket = PositionGetTicket(i);
      if(PositionSelectByTicket(ticket))    // Select the position by its ticket
        {
         // Add the profit of the current position to the total profit
         totalProfit += PositionGetDouble(POSITION_PROFIT);
         //Print("totalProfit ", totalProfit);
        }
     }

   return totalProfit; // Return the total profit of all open positions
  }
// Función para cerrar todas las órdenes
void CloseAllOrders()
  {
   string symbols[] = {symbol1, symbol2, symbol3};
   for(int i = 0; i < ArraySize(symbols); i++)
     {
      if(ExtTrade.PositionClose(symbols[i], 3))
         Print("Posición cerrada correctamente para ", symbols[i]);
      else
         Print("Error al cerrar posición para ", symbols[i], ": Error", GetLastError());
     }

// Resetea tickets y ordenes
   ticket1 = 0;
   ticket2 = 0;
   ticket3 = 0;
   ticket11 = 0;
   ticket22 = 0;
   ticket33 = 0;
   Order = 0;

   Print("Todas las órdenes están cerradas");
  }

//+------------------------------------------------------------------+
//| Check and close orders funcion                                   |
//+------------------------------------------------------------------+
// Función para verificar y cerrar órdenes
void CheckAndCloseOrders()
  {
   double currentProfit = CalculateCurrentArbitrageProfit();

// Condiciones para cerrar las órdenes
   if((currentProfit >= targetProfit || currentProfit <= maxLoss))
     {
      CloseAllOrders();  // Cierra todas las órdenes
      Print("Todas las órdenes cerradas. Beneficio/Pérdida actual: ", currentProfit);
     }
  }

//+------------------------------------------------------------------+
//| Get order volume function                                        |
//+------------------------------------------------------------------+
double GetOrderVolume(int ticket)
  {
   if(PositionSelectByTicket(ticket))
     {
      double volume = PositionGetDouble(POSITION_VOLUME);
      return volume;
     }
   else
     {
      Print("No se pudo seleccionar la posición con el ticket: ", ticket);
      return 0; // Retorna 0 si no se encuentra la posición
     }
  }
//+------------------------------------------------------------------+
// Function to get the price and calculate SL dynamically

double CalculateSL(bool isBuyOrder,double entryPrice,string simbolo)
  {

   double pointSize = SymbolInfoDouble(simbolo, SYMBOL_POINT);
   int digits = (int)SymbolInfoInteger(simbolo, SYMBOL_DIGITS);
   double pipSize = pointSize * 10;


   if(isBuyOrder)
     {
      sl = NormalizeDouble(entryPrice - StopLossPips * pipSize, digits);
      tp = NormalizeDouble(entryPrice + TakeProfitPips * pipSize, digits);
     }
   else
     {
      sl = NormalizeDouble(entryPrice + StopLossPips * pipSize, digits);
      tp = NormalizeDouble(entryPrice - TakeProfitPips * pipSize, digits);
     }
   return sl;
  }
//+------------------------------------------------------------------+
// Function to get the price and calculate TP dynamically
double CalculateTP(bool isBuyOrder,double entryPrice, string simbolo)
  {

   double pointSize = SymbolInfoDouble(simbolo, SYMBOL_POINT);
   int digits = (int)SymbolInfoInteger(simbolo, SYMBOL_DIGITS);
   double pipSize = pointSize * 10;


   if(isBuyOrder)
     {
      sl = NormalizeDouble(entryPrice - StopLossPips * pipSize, digits);
      tp = NormalizeDouble(entryPrice + TakeProfitPips * pipSize, digits);
     }
   else
     {
      sl = NormalizeDouble(entryPrice + StopLossPips * pipSize, digits);
      tp = NormalizeDouble(entryPrice - TakeProfitPips * pipSize, digits);
     }
   return tp;
  }
//+------------------------------------------------------------------+
// Function to handle errors and retry
bool TryOrderSend(MqlTradeRequest &request, MqlTradeResult &result)
  {
   for(int attempts = 0; attempts < 5; attempts++)
     {
      if(OrderSend(request, result))
        {
         return true;
        }
      else
        {
         Print("Failed to send order on attempt ", attempts + 1, ": Error ", GetLastError());
         Sleep(1000); // Pause before retrying to avoid 'context busy' errors
        }
     }
   return false;
  }
//+------------------------------------------------------------------+
Описание советника
Стратегия
Мы уже знаем, что такое треугольный арбитраж, но я добавил в код минимальную разницу между прогнозируемым и фактическим значением закрытия. Эта разница представляет собой процентное изменение цены между этими двумя значениями, и вы можете изменить его с помощью следующих входных данных:
input double perVar = 0.005; // Percentage of variation to make orders
*** Логика кода следующая: ***
EUR       USD     | EUR  |^(-1)
----   x  ---  x  | ---- |
USD       JPY     | JPY  |
Все адаптировано под эту логику, поэтому если вы используете другие пары, всё должно быть изменено.
Я прикреплю еще один пример (EURUSD - GBPUSD - EURGBP), чтобы вы могли увидеть изменения. Он использует следующую логику:
EUR      | GBP |^(-1)    | EUR  |^(-1)
----   x | --- |      x  | ---- |
USD      | USD |         | GBP  |
Вся стратегия основана на том, что когда вы умножаете эту логику, если она >1, вы можете умножать в правом направлении, а если она <1, - в левом.
Но стратегия советника заключается в том, что вместо использования фактических цен мы будем использовать прогнозируемые цены.
Эта логика означает, что если вы умножаете справа, вы умножаете цены, в обратном случае - деление. Слева - всё наоборот. Вы можете наблюдать эти изменения в коде.
Размеры лотов необходимо выбирать по самой высокой цене, поэтому в этой валютной паре EUR-USD-JPY минимальный лот составляет около 2-3 лотов.
Логика размеров лотов такова:
   double lotSize2 = lotSize * predicted / predicted2;
   double lotSize3 = lotSize * predicted / predicted3;
где predicted - прогнозируемая цена EURUSD, predicted2 - цена USDJPY, а predicted3 - цена EURJPY.
Последняя часть — нормализация размера лота в соответствии с требованиями брокера.
lotSize2 = NormalizeDouble(lotSize2, 2);
lotSize3 = NormalizeDouble(lotSize3, 2);
Пример
В этом примере мы будем использовать пары EUR-USD-JPY.
Логика следующая:
EUR       USD     | EUR  |^(-1)
----   x  ---  x  | ---- |
USD       JPY     | JPY  |
Мы будем проводить обучение и тестирование в течение 200 000 минут (размер выборки) до 3 апреля. Это даст нам прогнозы примерно на 17 дней.
Итак, тест в тестере стратегий будет проходить с 3 по 21 апреля, в качестве таймфрейма выберем 1 минуту.
Для первого теста мы будем использовать следующие входные данные и настройки (тщательно выбирайте символы по мере их добавления в советник (OONX)):


And these are the results:
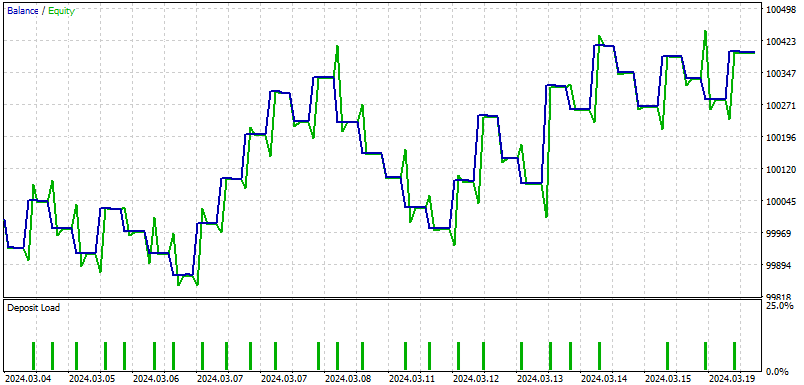
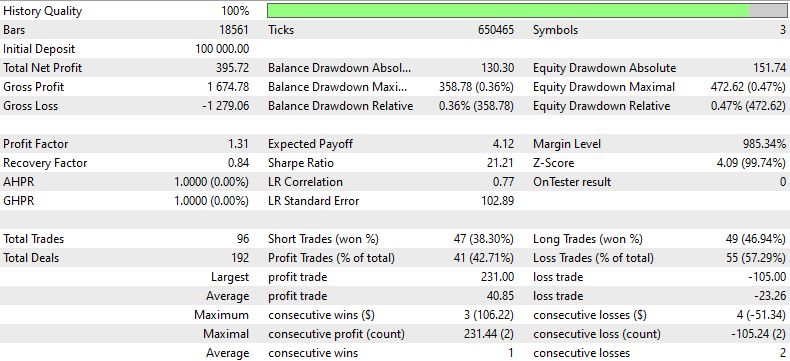
В этом отчете по тестированию на истории представлен подробный анализ эффективности торговой стратегии за определенный период с использованием исторических данных. Стратегия началась с первоначального депозита в размере USD 100 000 и завершилась с общей чистой прибылью в размере USD 395,72, несмотря на значительный валовой убыток в размере USD 1 279,06 по сравнению с валовой прибылью в размере USD 1 674,78. Коэффициент прибыли 1,31 указывает на то, что валовая прибыль превысила валовой убыток на 31%, что демонстрирует способность стратегии генерировать прибыль.
В рамках стратегии было совершено в общей сложности 96 сделок, при этом прибыльные и убыточные сделки распределились примерно поровну, о чем свидетельствует процент выигранных коротких (38,30%) и длинных сделок (46,94%). В целом по стратегии было зафиксировано больше убыточных сделок (55 или 57,29%), что подчеркивает необходимость улучшения стратегий входа или выхода.
Фактор восстановления 0,84 предполагает умеренный риск, при этом стратегия обеспечивает восстановление 84% от максимальной просадки. Кроме того, максимальная просадка была относительно высокой и составила USD 358,78 (0,36% от счета), что свидетельствует о том, что, хотя стратегия была прибыльной, она также столкнулась со значительными спадами, после которых ей пришлось восстанавливаться.
Тестирование на истории также показало существенные просадки по эквити, максимальная просадка по капиталу составила 0,47% от счета. В сочетании с высоким коэффициентом 21,21, это говорит о том, что доходность была значительно выше риска, что является положительным моментом. Однако низкий средний показатель последовательных выигрышей (3 сделки) по сравнению с более высоким средним показателем последовательных проигрышей (2 сделки) позволяет предположить, что стратегия нуждается в улучшении с целью поддержания последовательности выигрышных сделок.
Заключение
В этой статье мы подробно рассмотрели захватывающую концепцию треугольного арбитража с использованием прогнозов, используя платформу MetaTrader 5 и программирование на Python. Представьте себе, что у вас есть секретная формула, которая позволяет вам играть в хитрую игру по обмену валют, превращая доллары в евро, затем в иены и обратно в доллары, стремясь в итоге получить больше, чем вы начали. Это не магия. Всё дело в использовании специальных прогностических моделей, называемых ONNX, и треугольного арбитража, которые обучаются на основе прошлых цен валют, чтобы предсказывать будущие, направляя ваши торговые действия.
Мы рассмотрели, как установить все необходимые инструменты, такие как Python и Visual Studio Code, а также как подготовить компьютер к началу тестирования. Также мы увидели, как корректировать стратегию, независимо от сложности вашего торгового счета.
В целом, статья — хорошее подспорье для тех, кто хочет начать торговать на рынке Форекс, используя самые передовые технологии. Она проводит через все тонкости настройки и эксплуатации торговой системы, чтобы вы получили преимущество в торговле благодаря новейшим достижениям в области искусственного интеллекта и машинного обучения. Независимо от того, являетесь ли вы новичком в программировании или торговле, это руководство поможет вам, шаг за шагом показывая, как совершить цифровой скачок к автоматизированной торговле.
Надеюсь, вам понравилось читать эту статью так же, как мне понравилось ее писать.
Перевод с английского произведен MetaQuotes Ltd.
Оригинальная статья: https://www.mql5.com/en/articles/14873
Предупреждение: все права на данные материалы принадлежат MetaQuotes Ltd. Полная или частичная перепечатка запрещена.
Данная статья написана пользователем сайта и отражает его личную точку зрения. Компания MetaQuotes Ltd не несет ответственности за достоверность представленной информации, а также за возможные последствия использования описанных решений, стратегий или рекомендаций.
 Нейросети в трейдинге: Сегментация данных на основе уточняющих выражений
 DoEasy. Сервисные функции (Часть 3): Паттерн "Внешний бар"
 Возможности Мастера MQL5, которые вам нужно знать (Часть 20): Символьная регрессия
 Возможности Мастера MQL5, которые вам нужно знать (Часть 19): Байесовский вывод
- Бесплатные приложения для трейдинга
- 8 000+ сигналов для копирования
- Экономические новости для анализа финансовых рынков
Вы принимаете политику сайта и условия использования
Minmax что делает - нормализует (значит: вместо значений цены использует значения от a до b) между 0 и 1.
Я не понимаю другие q, пожалуйста, объясните подробнее (прошло много времени с тех пор, как я сделал эту статью).
Здравствуйте,
Если бы вы могли вставить детали q, я бы смог решить их быстрее (делал статью давно).
Насколько я помню, вы не можете использовать одинаковый размер лота. Причина в том, что используемые пары имеют разную цену.
Minmax что делает - нормализует (значит: вместо значений цены использует значения от a до b) между 0 и 1.
Я не понимаю другие q, пожалуйста, объясните подробнее (прошло много времени с тех пор, как я сделал эту статью).
Какая необходимость устанавливать Visual Studio Code?
Что нужно для установки Visual Studio Code?
для первых пользователей... это хорошая идея