Asa VWAP
- Indicadores
-
Panthita Aichoi
 BTC Wallet :
bc1qx685px03km775uapdvje8qz6t839g3fzt0gegv
ETH ERC20
USDT Address:
0x57cF049c965fbE4D25bD2a9aE02B27a04F5574F9 - Versão: 1.0
- Ativações: 5
O ASA VWAP é um indicador de Preço Médio Ponderado por Volume para o MetaTrader 5 que suporta sete períodos de reset: M15, M30, H1, H2, H4, Daily (Diário) e Weekly (Semanal). Ao contrário das ferramentas VWAP de sessão fixa, este indicador permite que os traders escolham o intervalo de reset que melhor se adapta ao seu estilo de negociação — desde scalping intradiário até análise de swing multi-dias.
O cálculo utiliza a fórmula padrão do VWAP:
Preço Típico (TP) = (Máxima + Mínima + Fechamento) / 3
VWAP = Cumulativo(TP x Volume) / Cumulativo(Volume)
O indicador acumula os dados corretamente através das atualizações das barras e reinicia de forma limpa no início de cada novo período.
COMO FUNCIONA
Para períodos intradiários (M15, M30, H1, H2, H4), o reset é baseado na divisão do timestamp Unix, garantindo uma deteção precisa dos intervalos em qualquer timeframe. Para os resets Daily (Diário) e Weekly (Semanal), o indicador utiliza um cálculo de tempo ajustado à sessão para alinhar com o início real do dia de negociação, independentemente do fuso horário da corretora.
PRINCIPAIS RECURSOS
- Sete períodos de reset: M15, M30, H1, H2, H4, Daily, Weekly
- Modos de Volume de Tick (Tick Volume) e Volume Real (Real Volume)
- Suporte ao desvio GMT da corretora (Broker GMT offset) e hora de início do dia personalizada (Day Start Hour) para o alinhamento correto da sessão diária
- Cor, largura e estilo de linha totalmente personalizáveis
- Opção "Conectar Linhas" (Connect Lines) para mostrar ou ocultar lacunas (gaps) nos limites do período
- Funciona em todos os ativos: Forex, Índices, Commodities, Ações, Cripto
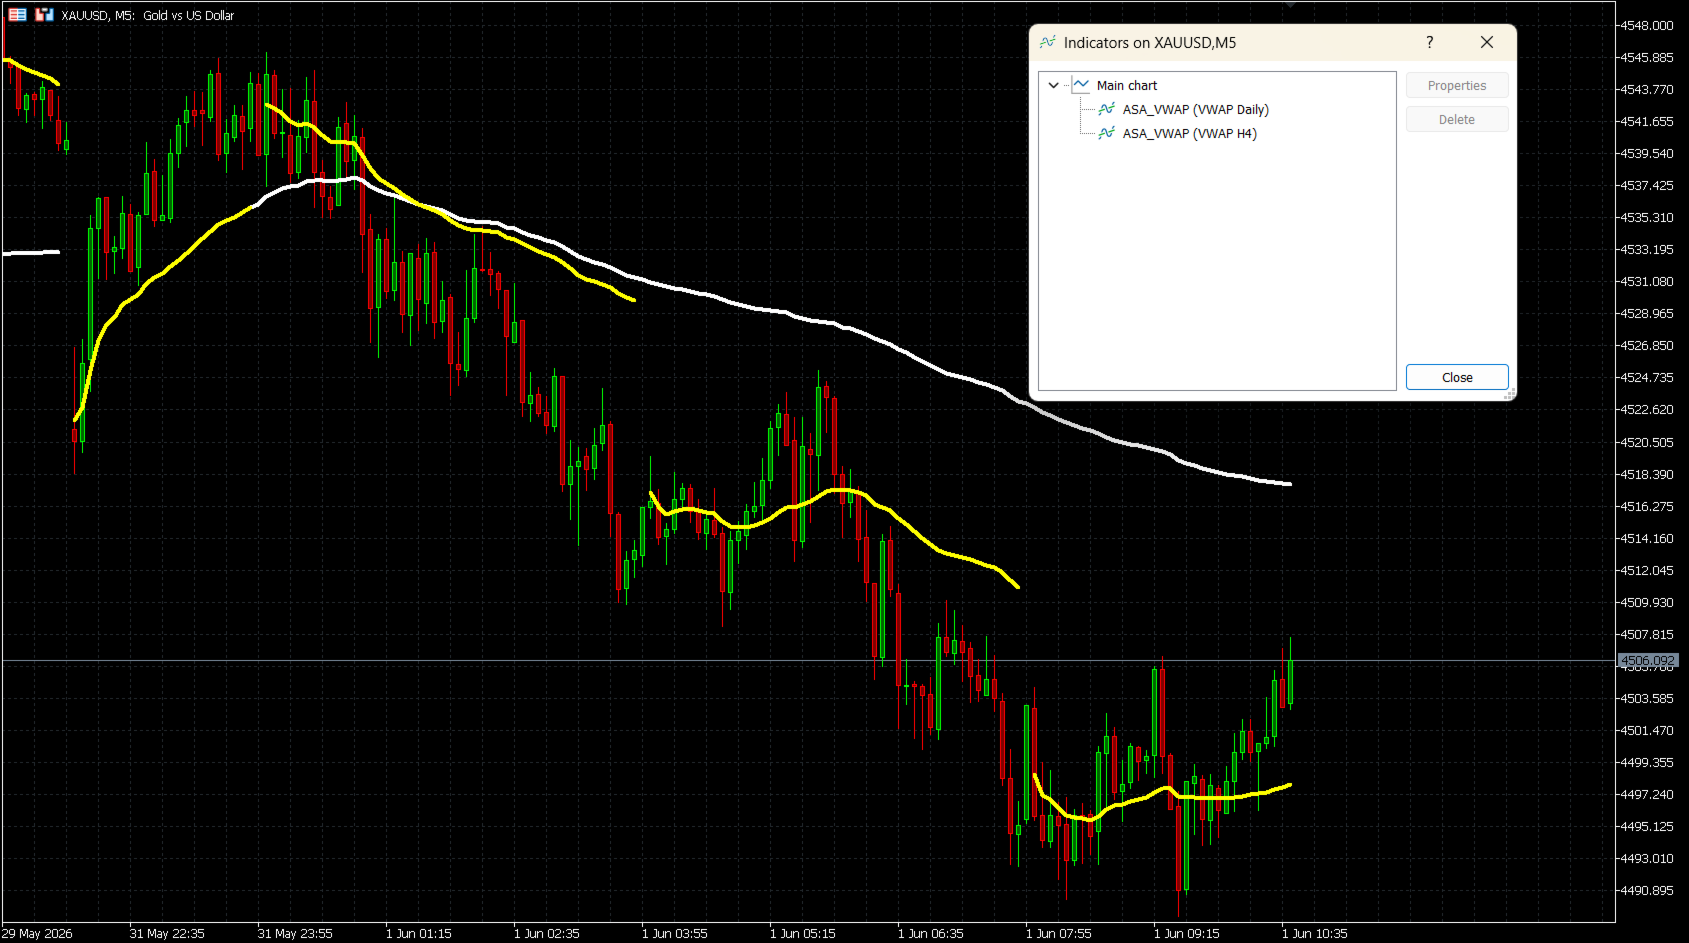
- Suporte a múltiplas instâncias por gráfico (ex: Daily + Weekly juntos)
PARÂMETROS DE ENTRADA
VWAP Reset Period (Período de Reset do VWAP)
Seleciona o intervalo de tempo para o reset do VWAP.
Opções: M15, M30, H1, H2, H4, Daily (padrão), Weekly
Volume Mode (Modo de Volume)
Tick Volume (padrão) — disponível em todas as corretoras.
Real Volume — requer uma corretora que forneça dados de volume da bolsa (exchange).
Broker GMT Offset (Desvio GMT da Corretora)
O desvio GMT do servidor da sua corretora.
GMT+0 = 0, GMT+2 = 2, GMT+3 = 3 (comum para a maioria das corretoras durante o horário de verão)
Day Start Hour (Hora de Início do Dia)
A hora do servidor quando um novo dia de negociação começa.
Corretora GMT+0: use 22 | Corretora GMT+2: use 0 | Corretora GMT+3: use 1
Line Color (Cor da Linha)
Cor da linha do VWAP no gráfico. Padrão: Branco (White).
Line Width (Largura da Linha)
Espessura da linha do VWAP (1 a 5). Padrão: 4.
Line Style (Estilo da Linha)
Solid (Sólida - padrão), Dash (Tracejada), Dot (Pontilhada), DashDot (Traço-ponto) ou DashDotDot.
Connect Lines (Conectar Linhas)
false (padrão): Uma lacuna visível é mostrada em cada ponto de reset.
true: A linha é desenhada continuamente através dos limites do período.
CONFIGURAÇÃO DO DESVIO GMT DA CORRETORA
O indicador calcula o tempo da sessão usando esta fórmula:
Shift = (24 - DayStartHour) % 24
Configurações comuns de corretoras:
Corretora GMT+0, reset do servidor às 22:00 → Offset = 0, DayStartHour = 22
Corretora GMT+2, reset do servidor às 00:00 → Offset = 2, DayStartHour = 0
Corretora GMT+3, reset do servidor às 01:00 → Offset = 3, DayStartHour = 1
Para encontrar o desvio da sua corretora, compare a hora do servidor na barra de status do MetaTrader 5 com a hora UTC atual.
NOTAS DE USO
- Aplique o indicador a qualquer gráfico. A linha do VWAP será desenhada imediatamente, sem esperar pelo próximo tick.
- Para melhores resultados, use o reset Daily em gráficos M15-H1 e o reset Weekly em gráficos H4-D1.
- Múltiplas instâncias podem ser adicionadas ao mesmo gráfico com diferentes períodos de reset para análise de confluência multi-período.
- Se o Real Volume for selecionado mas não estiver disponível na sua corretora, o indicador usará um volume padrão de 1 por barra. Neste caso, mude para Tick Volume.
COMPATIBILIDADE
Plataforma: MetaTrader 5
Instrumentos: Todos os símbolos (Forex, Índices, Commodities, Ações, Cripto)
Volume: Volume de Tick (todas as corretoras) ou Volume Real (feeds ECN/bolsa)
O cálculo utiliza a fórmula padrão do VWAP:
Preço Típico (TP) = (Máxima + Mínima + Fechamento) / 3
VWAP = Cumulativo(TP x Volume) / Cumulativo(Volume)
O indicador acumula os dados corretamente através das atualizações das barras e reinicia de forma limpa no início de cada novo período.
COMO FUNCIONA
Para períodos intradiários (M15, M30, H1, H2, H4), o reset é baseado na divisão do timestamp Unix, garantindo uma deteção precisa dos intervalos em qualquer timeframe. Para os resets Daily (Diário) e Weekly (Semanal), o indicador utiliza um cálculo de tempo ajustado à sessão para alinhar com o início real do dia de negociação, independentemente do fuso horário da corretora.
PRINCIPAIS RECURSOS
- Sete períodos de reset: M15, M30, H1, H2, H4, Daily, Weekly
- Modos de Volume de Tick (Tick Volume) e Volume Real (Real Volume)
- Suporte ao desvio GMT da corretora (Broker GMT offset) e hora de início do dia personalizada (Day Start Hour) para o alinhamento correto da sessão diária
- Cor, largura e estilo de linha totalmente personalizáveis
- Opção "Conectar Linhas" (Connect Lines) para mostrar ou ocultar lacunas (gaps) nos limites do período
- Funciona em todos os ativos: Forex, Índices, Commodities, Ações, Cripto
- Suporte a múltiplas instâncias por gráfico (ex: Daily + Weekly juntos)
PARÂMETROS DE ENTRADA
VWAP Reset Period (Período de Reset do VWAP)
Seleciona o intervalo de tempo para o reset do VWAP.
Opções: M15, M30, H1, H2, H4, Daily (padrão), Weekly
Volume Mode (Modo de Volume)
Tick Volume (padrão) — disponível em todas as corretoras.
Real Volume — requer uma corretora que forneça dados de volume da bolsa (exchange).
Broker GMT Offset (Desvio GMT da Corretora)
O desvio GMT do servidor da sua corretora.
GMT+0 = 0, GMT+2 = 2, GMT+3 = 3 (comum para a maioria das corretoras durante o horário de verão)
Day Start Hour (Hora de Início do Dia)
A hora do servidor quando um novo dia de negociação começa.
Corretora GMT+0: use 22 | Corretora GMT+2: use 0 | Corretora GMT+3: use 1
Line Color (Cor da Linha)
Cor da linha do VWAP no gráfico. Padrão: Branco (White).
Line Width (Largura da Linha)
Espessura da linha do VWAP (1 a 5). Padrão: 4.
Line Style (Estilo da Linha)
Solid (Sólida - padrão), Dash (Tracejada), Dot (Pontilhada), DashDot (Traço-ponto) ou DashDotDot.
Connect Lines (Conectar Linhas)
false (padrão): Uma lacuna visível é mostrada em cada ponto de reset.
true: A linha é desenhada continuamente através dos limites do período.
CONFIGURAÇÃO DO DESVIO GMT DA CORRETORA
O indicador calcula o tempo da sessão usando esta fórmula:
Shift = (24 - DayStartHour) % 24
Configurações comuns de corretoras:
Corretora GMT+0, reset do servidor às 22:00 → Offset = 0, DayStartHour = 22
Corretora GMT+2, reset do servidor às 00:00 → Offset = 2, DayStartHour = 0
Corretora GMT+3, reset do servidor às 01:00 → Offset = 3, DayStartHour = 1
Para encontrar o desvio da sua corretora, compare a hora do servidor na barra de status do MetaTrader 5 com a hora UTC atual.
NOTAS DE USO
- Aplique o indicador a qualquer gráfico. A linha do VWAP será desenhada imediatamente, sem esperar pelo próximo tick.
- Para melhores resultados, use o reset Daily em gráficos M15-H1 e o reset Weekly em gráficos H4-D1.
- Múltiplas instâncias podem ser adicionadas ao mesmo gráfico com diferentes períodos de reset para análise de confluência multi-período.
- Se o Real Volume for selecionado mas não estiver disponível na sua corretora, o indicador usará um volume padrão de 1 por barra. Neste caso, mude para Tick Volume.
COMPATIBILIDADE
Plataforma: MetaTrader 5
Instrumentos: Todos os símbolos (Forex, Índices, Commodities, Ações, Cripto)
Volume: Volume de Tick (todas as corretoras) ou Volume Real (feeds ECN/bolsa)