

Introdução ao MQL5 (Parte 15): Criando Indicadores Personalizados com MQL5 — Guia para Iniciantes (IV)
 205
205
 1
1

Introdução
O artigo aborda a determinação dos pontos de entrada, stop loss (SL) e take profit (TP) com base na estrutura da tendência. Como utilizaremos grande parte do que já aprendemos até aqui, esta parte parecerá mais uma continuação do que um novo começo. Neste ponto, você já deve ter uma compreensão sólida dos fundamentos do MQL5 e, neste artigo, iremos um passo além, combinando esse conhecimento para desenvolver um indicador personalizado mais interessante.
Você é tão bom quanto os projetos que desenvolveu em MQL5, e é por isso que esta série sempre adota uma abordagem baseada em projetos. Esse é o método mais útil para aprender e evoluir. Nesta parte da série, criaremos um indicador capaz de reconhecer tendências, utilizar rompimentos de estrutura (Break of Structure - BOS) e gerar sinais de compra e venda. Esses sinais incluem o ponto de entrada, stop loss e vários níveis de take profit, fornecendo uma estratégia abrangente e completa que você poderá testar e aperfeiçoar. Neste artigo, você aprenderá a desenvolver indicadores personalizados em MQL5 utilizando conceitos de Price Action. Para criar uma estratégia seguidora de tendência, você aprenderá a reconhecer estruturas importantes do mercado, como máximas mais altas, mínimas mais altas, máximas mais baixas e mínimas mais baixas.
Neste artigo, você aprenderá:
- Como criar um indicador de Price Action.
- Reconhecendo pontos importantes, como mínima (L), máxima (H), mínima mais alta (HL), máxima mais alta (HH), mínima mais baixa (LL) e máxima mais baixa (LH), para compreender a estrutura de uma tendência de alta e de uma tendência de baixa.
- Desenhando as zonas de prêmio e desconto com base nos principais pontos da tendência e marcando o nível de retração de 50%.
- Como aplicar a relação risco-retorno no cálculo de metas potenciais de lucro em metas potenciais de lucro em um setup de alta.
- Calculando e marcando o ponto de entrada, stop loss (SL) e múltiplos níveis de take profit (TP) com base na estrutura da tendência.
1. Configuração do Projeto
1.1. Como o Indicador Funciona
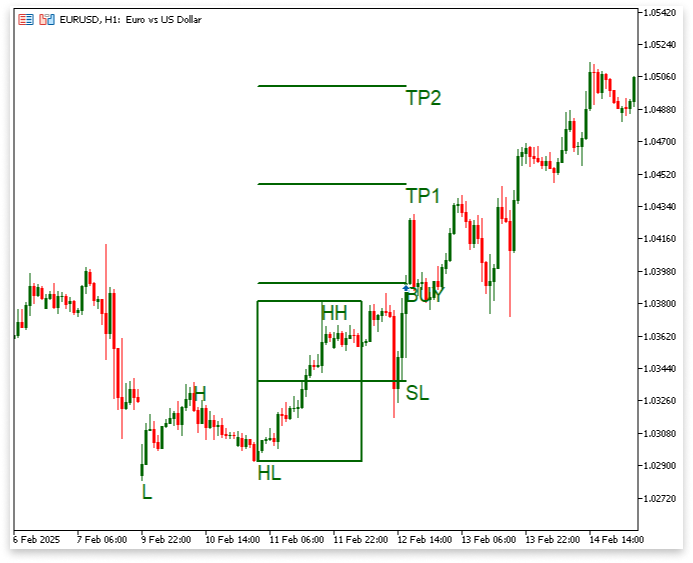
O indicador identificará uma mínima, uma máxima, uma mínima mais alta e uma máxima mais alta para indicar uma tendência de alta e gerar sinais de compra. Em seguida, será determinado o nível de retração de 50% entre a mínima mais alta e a máxima mais alta. Um rompimento da estrutura acima da máxima mais alta acionará a entrada, enquanto o nível de retração de 50% servirá como stop loss. O Take Profit 1 terá como objetivo uma relação risco-retorno de 1:1, enquanto o Take Profit 2 terá como objetivo uma relação de 1:2.
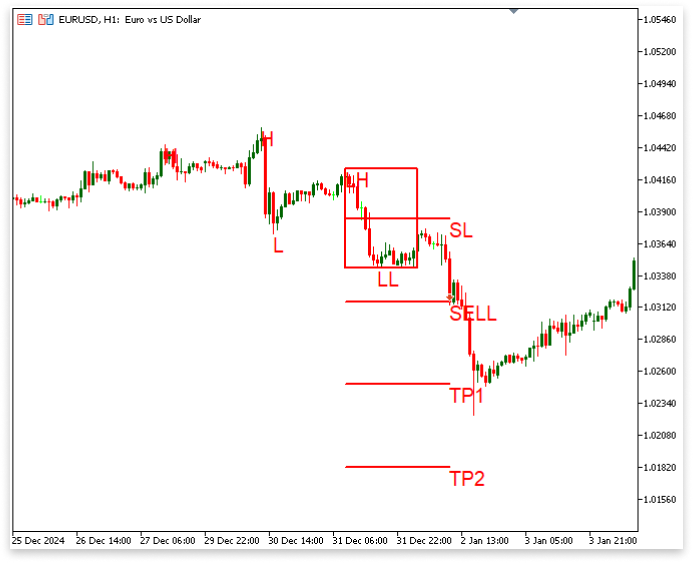
Para identificar uma tendência de baixa e gerar sinais de venda, o indicador identificará inicialmente uma máxima, uma mínima, uma máxima mais baixa e uma mínima mais baixa. Em seguida, calculará a retração de 50% entre a máxima mais baixa e a mínima mais baixa. O TP1 será de 1:1, o TP2 será de 1:2, o stop loss ficará no nível de 50% e a entrada ocorrerá após um rompimento abaixo da mínima mais baixa.
2. Construindo o Indicador de Price Action
Toda estratégia de negociação pode ser transformada em um indicador. Ela apenas ainda não foi visualizada. Qualquer lógica que siga um conjunto de regras pode ser codificada e exibida no gráfico, seja de oferta e demanda, Price Action ou suporte e resistência. É aí que entra o MQL5. Para traders algorítmicos, ele está entre as linguagens de programação mais poderosas e acessíveis, permitindo transformar qualquer lógica de negociação em uma ferramenta útil e visualmente atraente. Nesta seção, começaremos a desenvolver um indicador que analisa o movimento dos preços, identifica estruturas de mercado, como máximas, mínimas, máximas mais altas e mínimas mais baixas, e utiliza essas informações para gerar sinais de compra e venda contendo entrada, stop loss e níveis de take profit.
No Capítulo Um, apresentei o objetivo do projeto e expliquei como o indicador identificará tendências, detectará rompimentos de estrutura e produzirá sinais completos de negociação contendo entrada, stop loss e take profits. Agora começaremos a colocar tudo isso em prática no MQL5 neste capítulo. Pegaremos a lógica que discutimos e começaremos, passo a passo, a implementá-la em código.
2.1. Identificando Máximas e Mínimas
Encontrar os topos e fundos de oscilação (swing highs e swing lows) é a primeira etapa para criar nosso indicador de Price Action. Esses importantes pontos de reversão do mercado ajudam a identificar a estrutura da tendência. Podemos identificá-los em MQL5 comparando a máxima ou a mínima da vela atual com as máximas ou mínimas das velas anterior e posterior. A detecção de máximas mais altas, mínimas mais altas, máximas mais baixas e mínimas mais baixas, fundamentais para identificar padrões e rompimentos de estrutura, será baseada nesse processo.
Exemplo://+------------------------------------------------------------------+ //| FUNCTION FOR SWING LOWS | //+------------------------------------------------------------------+ bool IsSwingLow(const double &low[], int index, int lookback) { for(int i = 1; i <= lookback; i++) { if(low[index] > low[index - i] || low[index] > low[index + i]) return false; } return true; } //+------------------------------------------------------------------+ //| FUNCTION FOR SWING HIGHS | //+------------------------------------------------------------------+ bool IsSwingHigh(const double &high[], int index, int lookback) { for(int i = 1; i <= lookback; i++) { if(high[index] < high[index - i] || high[index] < high[index + i]) return false; } return true; }
As duas funções foram utilizadas no artigo anterior e ajudam a identificar tanto os topos quanto os fundos de oscilação.
2.2. Tendência de Alta
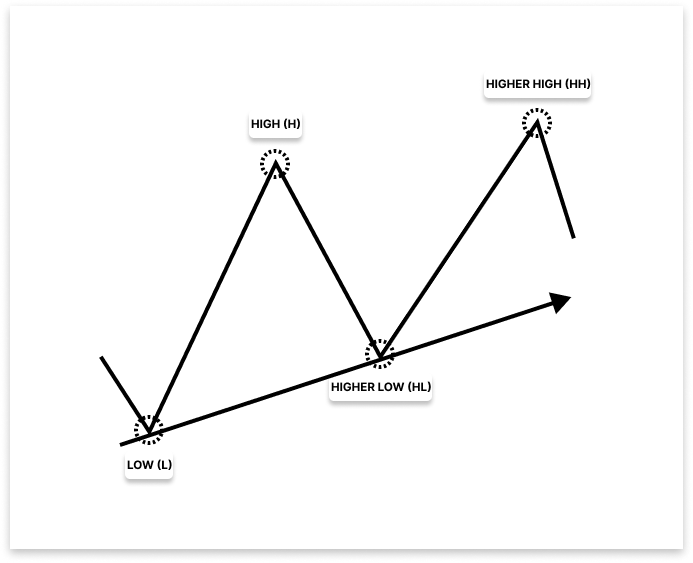
Utilizando a estrutura do mercado, este indicador deve primeiro verificar se existe uma tendência de alta antes de indicar um sinal de compra. Para isso, é necessário identificar quatro pontos principais de preço: uma mínima, uma máxima, uma mínima mais alta e uma máxima mais alta. Esse padrão caracteriza uma tendência de alta, indicando que os compradores estão no controle e que o mercado provavelmente continuará subindo. Após a confirmação desse padrão, o indicador estará pronto para gerar um sinal de compra válido.
Exemplo:
// CHART ID
long chart_id = ChartID();

// Input parameters
input int  LookbackBars = 10;   // Number of bars to look back/forward for swing points
input int  bars_check   = 1000; // Number of bars to check for swing points
input bool show_bullish = true; //Show Buy Signals

// Variables for Bullish Market Structure

double L;              // Low: the starting low point in the up trend
datetime L_time;       // Time of the low
string L_letter;       // Label for the low point (e.g., "L")

double H;              // High: the first high after the low
datetime H_time;       // Time of the high
string H_letter;       // Label for the high point (e.g., "H")

double HL;             // Higher Low: the next low that is higher than the first low
datetime HL_time;      // Time of the higher low
string HL_letter;      // Label for the higher low point (e.g., "HL")

double HH;             // Higher High: the next high that is higher than the first high
datetime HH_time;      // Time of the higher high
string HH_letter;      // Label for the higher high point (e.g., "HH")

//+------------------------------------------------------------------+
//| Custom indicator initialization function                         |
//+------------------------------------------------------------------+
int OnInit()
  {
//--- indicator buffers mapping

//---
   return(INIT_SUCCEEDED);
  }
//+------------------------------------------------------------------+
//| Expert deinitialization function                                 |
//+------------------------------------------------------------------+
void OnDeinit(const int reason)
  {

   ObjectsDeleteAll(chart_id);
  }
//+------------------------------------------------------------------+
//| Custom indicator iteration function                              |
//+------------------------------------------------------------------+
int OnCalculate(const int rates_total,
                const int prev_calculated,
                const datetime &time[],
                const double &open[],
                const double &high[],
                const double &low[],
                const double &close[],
                const long &tick_volume[],
                const long &volume[],
                const int &spread[])
  {
//---
   if(show_bullish == true) // Check if the bullish trend is to be displayed
     {
      if(rates_total >= bars_check) // Ensure enough bars are available for analysis
        {
         // Loop through the price data starting from a certain point based on bars_check and LookbackBars
         for(int i = rates_total - bars_check; i < rates_total - LookbackBars; i++)
           {
            // Check if the current bar is a swing low
            if(IsSwingLow(low, i, LookbackBars))
              {
               // Store the values for the swing low
               L = low[i];
               L_time = time[i];
               L_letter = StringFormat("Low%d", i);

               // Loop through further to find a swing high after the low
               for(int j = i; j < rates_total - LookbackBars; j++)
                 {
                  // Check if the current bar is a swing high and occurs after the identified swing low
                  if(IsSwingHigh(high, j, LookbackBars) && time[j] > L_time)
                    {
                     // Store the values for the swing high
                     H = high[j];
                     H_time = time[j];
                     H_letter = StringFormat("High%d", j);

                     // Loop further to find a higher low after the swing high
                     for(int k = j; k < rates_total - LookbackBars; k++)
                       {
                        // Check if the current bar is a swing low and occurs after the swing high
                        if(IsSwingLow(low, k, LookbackBars) && time[k] > H_time)
                          {
                           // Store the values for the higher low
                           HL = low[k];
                           HL_time = time[k];
                           HL_letter = StringFormat("Higher Low%d", j);

                           // Loop further to find a higher high after the higher low
                           for(int l = j ; l < rates_total - LookbackBars; l++)
                             {
                              // Check if the current bar is a swing high and occurs after the higher low
                              if(IsSwingHigh(high, l, LookbackBars) && time[l] > HL_time)
                                {
                                 // Store the values for the higher high
                                 HH = high[l];
                                 HH_time = time[l];
                                 HH_letter = StringFormat("Higher High%d", l);

                                 // Check if the pattern follows the expected bullish structure: Low < High, Higher Low < High, Higher High > High
                                 if(L < H && HL < H && HL > L && HH > H)
                                   {
                                    // Create and display text objects for Low, High, Higher Low, and Higher High on the chart
                                    ObjectCreate(chart_id, L_letter, OBJ_TEXT, 0, L_time, L);
                                    ObjectSetString(chart_id, L_letter, OBJPROP_TEXT, "L");
                                    ObjectSetInteger(chart_id, L_letter, OBJPROP_COLOR, clrDarkGreen);
                                    ObjectSetInteger(chart_id, L_letter, OBJPROP_FONTSIZE, 15);

                                    ObjectCreate(chart_id, H_letter, OBJ_TEXT, 0, H_time, H);
                                    ObjectSetString(chart_id, H_letter, OBJPROP_TEXT, "H");
                                    ObjectSetInteger(chart_id, H_letter, OBJPROP_COLOR, clrDarkGreen);
                                    ObjectSetInteger(chart_id, H_letter, OBJPROP_FONTSIZE, 15);

                                    ObjectCreate(chart_id, HL_letter, OBJ_TEXT, 0, HL_time, HL);
                                    ObjectSetString(chart_id, HL_letter, OBJPROP_TEXT, "HL");
                                    ObjectSetInteger(chart_id, HL_letter, OBJPROP_COLOR, clrDarkGreen);
                                    ObjectSetInteger(chart_id, HL_letter, OBJPROP_FONTSIZE, 15);

                                    ObjectCreate(chart_id, HH_letter, OBJ_TEXT, 0, HH_time, HH);
                                    ObjectSetString(chart_id, HH_letter, OBJPROP_TEXT, "HH");
                                    ObjectSetInteger(chart_id, HH_letter, OBJPROP_COLOR, clrDarkGreen);
                                    ObjectSetInteger(chart_id, HH_letter, OBJPROP_FONTSIZE, 15);
                                   }

                                 break; // Exit the loop once the pattern is found
                                }
                             }

                           break; // Exit the loop once the higher low is found
                          }
                       }

                     break; // Exit the loop once the higher high is found
                    }
                 }
              }
           }
        }
     }
//--- return value of prev_calculated for next call
   return(rates_total);
  }
Saídas:
Explicação:
Os parâmetros de entrada definidos no início do código são utilizados para analisar a estrutura do mercado. LookbackBars determina o número de barras analisadas antes e depois da barra atual para identificar topos e fundos de oscilação (swing highs e swing lows), garantindo que sejam relevantes para o mercado atual. Enquanto isso, bars_check controla o número total de barras de preço que serão analisadas, permitindo que o script percorra até 1000 barras em busca de possíveis padrões de alta.
Embora também exijam maior poder de processamento, valores mais altos para bars_check indicam que o algoritmo considerará uma quantidade maior de dados ao procurar esses pontos. Uma entrada booleana chamada show_bullish controla se os sinais de compra, ou sinais de alta, devem ser exibidos. Se show_bullish estiver definido como true, a aplicação analisará o movimento dos preços e determinará a estrutura de mercado de alta com base nos pontos de oscilação. Se estiver definido como false, o script não desenhará nem destacará qualquer estrutura de alta, mesmo que todos os critérios sejam atendidos.
A verificação de show_bullish == true é a primeira ação executada na lógica do indicador. Isso garante que a estrutura de alta só seja identificada quando o usuário desejar visualizar os sinais de compra. Em seguida, o programa verifica se há dados de preço suficientes para realizar a análise, caso os critérios sejam atendidos. Essa verificação é feita por meio da condição if (rates_total >= bars_check). Se houver menos barras disponíveis do que o necessário, a análise será ignorada para evitar erros causados por dados insuficientes. Se a condição for atendida, o script percorre os preços em busca dos pontos de oscilação.
O laço externo começa com a variável i, que procura fundos de oscilação válidos percorrendo os dados de preço de trás para frente, a partir da barra mais recente. A função IsSwingLow() determina se a barra atual é a menor dentro do intervalo definido por LookbackBars, identificando assim um fundo de oscilação. Assim que um fundo de oscilação é encontrado, seu preço e horário são armazenados nas variáveis L e L_time. Isso estabelece a base para a próxima etapa do processo de identificação do padrão de alta. Após identificar o fundo de oscilação, o programa procura o próximo topo de oscilação. Utilizando IsSwingHigh(), o segundo laço, indexado por j, procura um topo de oscilação em cada barra subsequente. Os valores de qualquer topo de oscilação encontrado após o fundo são armazenados em H e H_time. Isso forma o primeiro segmento da estrutura de mercado de alta, composta por uma mínima e uma máxima.
Após o topo de oscilação, o terceiro laço, indexado por k, procura uma mínima mais alta. O script utiliza novamente a função IsSwingLow() para localizar uma mínima mais alta, definida como uma mínima superior à mínima inicial L. Quando uma mínima mais alta é encontrada, HL e HL_time são atualizados com seu valor e horário. Após identificar essa mínima mais alta, o programa continua procurando a máxima mais alta subsequente. O topo de oscilação que sucede a mínima mais alta é verificado pelo quarto laço, indexado por l. Caso essa máxima mais alta seja encontrada, seus valores são armazenados em HH e HH_time. Em seguida, o código verifica se os quatro pontos críticos, mínima, máxima, mínima mais alta e máxima mais alta, formam um padrão de alta válido. A primeira mínima deve ser inferior à primeira máxima, a mínima mais alta deve ser inferior à primeira máxima, a mínima mais alta deve ser superior à primeira mínima e a máxima mais alta deve ser superior à primeira máxima. Esses critérios são verificados pela condição if (L < H && HL < H && HL > L && HH > H). Isso confirma uma tendência de alta, garantindo que o padrão siga a sequência esperada de máximas e mínimas ascendentes.
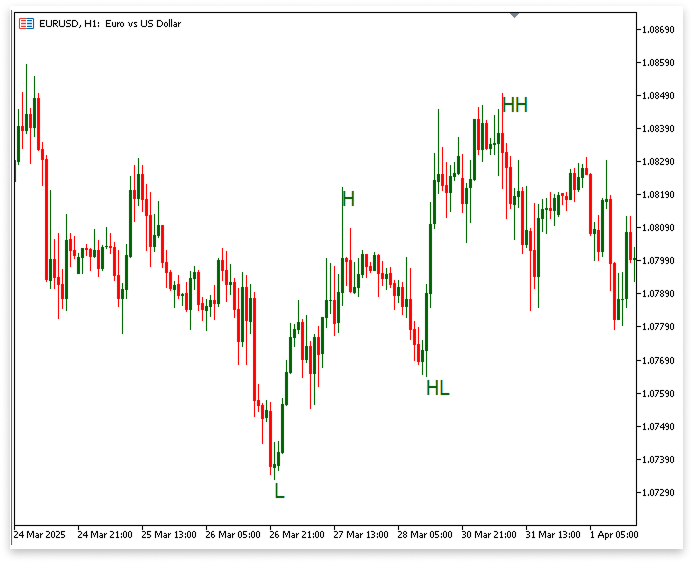
Se todos esses requisitos forem atendidos, o programa cria e exibe objetos de texto no gráfico para destacar os pontos identificados. O gráfico exibe os pontos como rótulos nos respectivos horários e preços: Mínima (L), Máxima (H), Mínima Mais Alta (HL) e Máxima Mais Alta (HH). A função ObjectCreate() é utilizada para criar os objetos de texto, enquanto ObjectSetInteger() e ObjectSetString() são utilizadas para configurar suas propriedades, incluindo tamanho da fonte e cor. Com esses pontos claramente destacados, o usuário pode identificar facilmente a estrutura de alta no gráfico. Em resumo, o objetivo do programa é encontrar um padrão de máximas mais altas e mínimas mais altas nos dados de preço para identificar uma estrutura de mercado de alta. Isso é feito analisando os pontos de oscilação dentro de um intervalo predeterminado de barras, registrando as informações relevantes e verificando se a estrutura segue o padrão esperado. Se o padrão for confirmado, ele será exibido visualmente no gráfico para o usuário. Todo esse processo é controlado pelos parâmetros de entrada, que permitem ajustes conforme as preferências do usuário.
2.2.1. Mapeando as Zonas de Prêmio e Desconto da Mínima Mais Alta até a Máxima Mais Alta
Essa divisão ajuda a definir os conceitos de "zona premium / zona de desconto". Abaixo do nível de 50%, a zona de desconto representa a faixa de preços considerada mais vantajosa ou "mais barata" para possíveis compras. Já acima do nível de 50%, encontra-se a zona premium / zona de desconto, que representa preços relativamente "mais caros". Em muitas estratégias de negociação, os traders normalmente preferem comprar na zona de desconto para otimizar a relação risco-retorno; entretanto, neste indicador específico adotamos uma estratégia ligeiramente diferente.
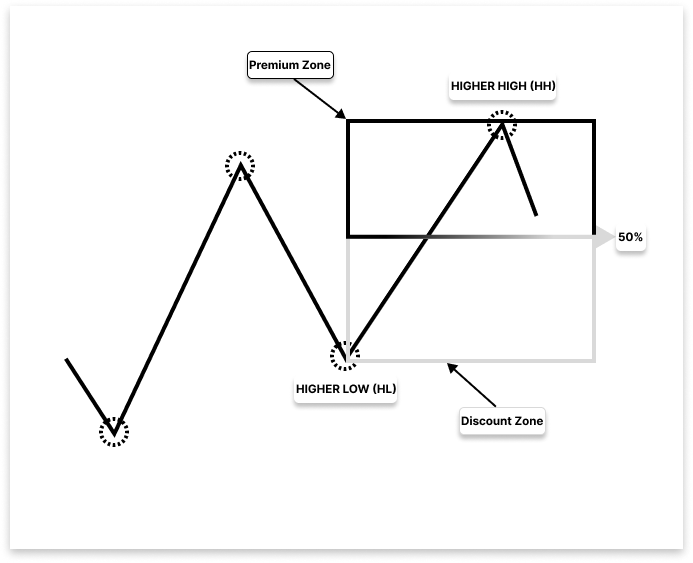
Neste caso, estamos interessados apenas em comprar quando o mercado negociar acima da zona premium / zona de desconto ou romper acima da Máxima Mais Alta (HH). Esse padrão indica que a estrutura de alta permanece válida e que o preço provavelmente continuará subindo. Aguardar o rompimento acima da Máxima Mais Alta ou da zona premium / zona de desconto ajuda a permanecer alinhado com a tendência e reduz a probabilidade de comprar durante um pullback ou uma reversão.
Exemplo:
// CHART ID
long chart_id = ChartID();

// Input parameters
input int  LookbackBars = 10;   // Number of bars to look back/forward for swing points
input int  bars_check   = 1000; // Number of bars to check for swing points
input bool show_bullish = true; //Show Buy Signals

// Variables for Bullish Market Structure

double L;              // Low: the starting low point in the up trend
datetime L_time;       // Time of the low
string L_letter;       // Label for the low point (e.g., "L")

double H;              // High: the first high after the low
datetime H_time;       // Time of the high
string H_letter;       // Label for the high point (e.g., "H")

double HL;             // Higher Low: the next low that is higher than the first low
datetime HL_time;      // Time of the higher low
string HL_letter;      // Label for the higher low point (e.g., "HL")

double HH;             // Higher High: the next high that is higher than the first high
datetime HH_time;      // Time of the higher high
string HH_letter;      // Label for the higher high point (e.g., "HH")

// Variables for Premium and Discount
string pre_dis_box;     // Name/ID for the premium-discount zone box (rectangle object on chart)
double lvl_50;          // The price level representing the 50% retracement between Higher Low and Higher High
string lvl_50_line;     // Name/ID for the horizontal line marking the 50% level


//+------------------------------------------------------------------+
//| Custom indicator initialization function                         |
//+------------------------------------------------------------------+
int OnInit()
  {
//--- indicator buffers mapping

//---
   return(INIT_SUCCEEDED);
  }
//+------------------------------------------------------------------+
//| Expert deinitialization function                                 |
//+------------------------------------------------------------------+
void OnDeinit(const int reason)
  {

   ObjectsDeleteAll(chart_id);
  }
//+------------------------------------------------------------------+
//| Custom indicator iteration function                              |
//+------------------------------------------------------------------+
int OnCalculate(const int rates_total,
                const int prev_calculated,
                const datetime &time[],
                const double &open[],
                const double &high[],
                const double &low[],
                const double &close[],
                const long &tick_volume[],
                const long &volume[],
                const int &spread[])
  {
//---
   if(show_bullish == true) // Check if the bullish trend is to be displayed
     {
      if(rates_total >= bars_check) // Ensure enough bars are available for analysis
        {
         // Loop through the price data starting from a certain point based on bars_check and LookbackBars
         for(int i = rates_total - bars_check; i < rates_total - LookbackBars; i++)
           {
            // Check if the current bar is a swing low
            if(IsSwingLow(low, i, LookbackBars))
              {
               // Store the values for the swing low
               L = low[i];
               L_time = time[i];
               L_letter = StringFormat("Low%d", i);

               // Loop through further to find a swing high after the low
               for(int j = i; j < rates_total - LookbackBars; j++)
                 {
                  // Check if the current bar is a swing high and occurs after the identified swing low
                  if(IsSwingHigh(high, j, LookbackBars) && time[j] > L_time)
                    {
                     // Store the values for the swing high
                     H = high[j];
                     H_time = time[j];
                     H_letter = StringFormat("High%d", j);

                     // Loop further to find a higher low after the swing high
                     for(int k = j; k < rates_total - LookbackBars; k++)
                       {
                        // Check if the current bar is a swing low and occurs after the swing high
                        if(IsSwingLow(low, k, LookbackBars) && time[k] > H_time)
                          {
                           // Store the values for the higher low
                           HL = low[k];
                           HL_time = time[k];
                           HL_letter = StringFormat("Higher Low%d", j);

                           // Loop further to find a higher high after the higher low
                           for(int l = j ; l < rates_total - LookbackBars; l++)
                             {
                              // Check if the current bar is a swing high and occurs after the higher low
                              if(IsSwingHigh(high, l, LookbackBars) && time[l] > HL_time)
                                {
                                 // Store the values for the higher high
                                 HH = high[l];
                                 HH_time = time[l];
                                 HH_letter = StringFormat("Higher High%d", l);

                                 // Check if the pattern follows the expected bullish structure: Low < High, Higher Low < High, Higher High > High
                                 if(L < H && HL < H && HL > L && HH > H)
                                   {
                                    // Create and display text objects for Low, High, Higher Low, and Higher High on the chart
                                    ObjectCreate(chart_id, L_letter, OBJ_TEXT, 0, L_time, L);
                                    ObjectSetString(chart_id, L_letter, OBJPROP_TEXT, "L");
                                    ObjectSetInteger(chart_id, L_letter, OBJPROP_COLOR, clrDarkGreen);
                                    ObjectSetInteger(chart_id, L_letter, OBJPROP_FONTSIZE, 15);

                                    ObjectCreate(chart_id, H_letter, OBJ_TEXT, 0, H_time, H);
                                    ObjectSetString(chart_id, H_letter, OBJPROP_TEXT, "H");
                                    ObjectSetInteger(chart_id, H_letter, OBJPROP_COLOR, clrDarkGreen);
                                    ObjectSetInteger(chart_id, H_letter, OBJPROP_FONTSIZE, 15);

                                    ObjectCreate(chart_id, HL_letter, OBJ_TEXT, 0, HL_time, HL);
                                    ObjectSetString(chart_id, HL_letter, OBJPROP_TEXT, "HL");
                                    ObjectSetInteger(chart_id, HL_letter, OBJPROP_COLOR, clrDarkGreen);
                                    ObjectSetInteger(chart_id, HL_letter, OBJPROP_FONTSIZE, 15);

                                    ObjectCreate(chart_id, HH_letter, OBJ_TEXT, 0, HH_time, HH);
                                    ObjectSetString(chart_id, HH_letter, OBJPROP_TEXT, "HH");
                                    ObjectSetInteger(chart_id, HH_letter, OBJPROP_COLOR, clrDarkGreen);
                                    ObjectSetInteger(chart_id, HH_letter, OBJPROP_FONTSIZE, 15);


                                    // Calculate the 50% retracement level between the Higher Low and Higher High
                                    lvl_50 = HL + ((HH - HL)/2);

                                    // Generate unique names for the premium-discount box and the 50% level line using the current loop index
                                    pre_dis_box = StringFormat("Premium and Discount Box%d", i);
                                    lvl_50_line = StringFormat("Level 50 Line%d", i);

                                    // Create a rectangle object representing the premium-discount zone from the Higher Low to the Higher High
                                    ObjectCreate(chart_id, pre_dis_box, OBJ_RECTANGLE, 0, HL_time, HL, time[l + LookbackBars], HH);

                                    // Create a trend line (horizontal line) marking the 50% retracement level
                                    ObjectCreate(chart_id, lvl_50_line, OBJ_TREND, 0, HL_time, lvl_50, time[l + LookbackBars], lvl_50);

                                    // Set the color of the premium-discount box to dark green
                                    ObjectSetInteger(chart_id, pre_dis_box, OBJPROP_COLOR, clrDarkGreen);

                                    // Set the color of the 50% level line to dark green
                                    ObjectSetInteger(chart_id, lvl_50_line, OBJPROP_COLOR, clrDarkGreen);

                                    // Set the width of the premium-discount box for better visibility
                                    ObjectSetInteger(chart_id, pre_dis_box, OBJPROP_WIDTH, 2);

                                    // Set the width of the 50% level line for better visibility
                                    ObjectSetInteger(chart_id, lvl_50_line, OBJPROP_WIDTH, 2);


                                   }

                                 break; // Exit the loop once the pattern is found
                                }
                             }

                           break; // Exit the loop once the higher low is found
                          }
                       }

                     break; // Exit the loop once the higher high is found
                    }
                 }
              }
           }
        }
     }
//--- return value of prev_calculated for next call
   return(rates_total);
  }
Saídas:
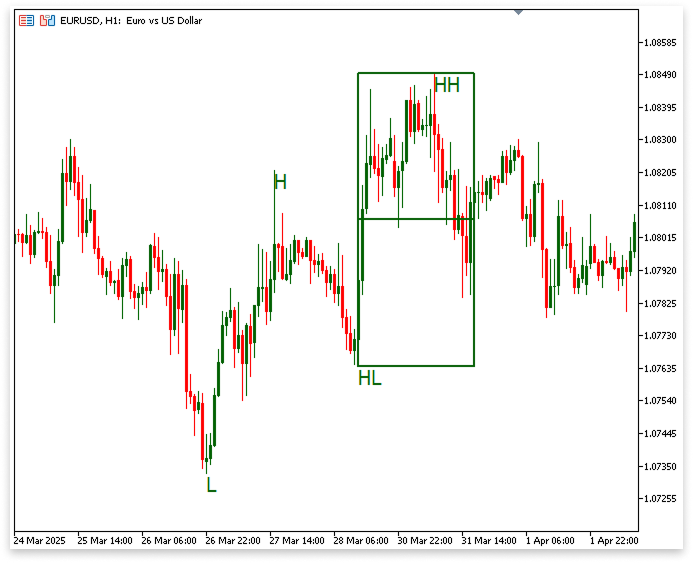
Explicação:
O código determina o nível de retração de 50%, que corresponde ao ponto médio entre a Mínima Mais Alta (HL) e a Máxima Mais Alta (HH). Esse nível separa a zona premium / zona de desconto (acima) da zona de desconto (abaixo). O ponto médio entre HL e HH é calculado utilizando a fórmula lvl_50 = HL + ((HH - HL)/2);. Em seguida, o índice do laço i é incluído nos nomes de duas variáveis do tipo string, pre_dis_box e lvl_50_line. Essas variáveis servem como identificadores exclusivos para os elementos visuais que serão desenhados no gráfico. Ao incluir o índice do laço, cada desenho será único e não substituirá os anteriores.
Um retângulo é criado no gráfico pela instrução ObjectCreate(chart_id, pre_dis_box, OBJ_RECTANGLE, 0, HL_time, HL, time[l + LookbackBars], HH);, representando graficamente o movimento entre a Mínima Mais Alta e a Máxima Mais Alta. Esse retângulo permite que os traders identifiquem rapidamente a faixa do movimento de alta mais recente. O início do retângulo é ancorado no horário e no preço da HL, enquanto sua extremidade é ancorada em uma barra futura (l + LookbackBars), utilizando o preço da HH. Isso faz com que o retângulo permaneça visível ao estender-se ligeiramente para o futuro.
Em seguida, uma linha horizontal é desenhada no gráfico no nível de 50% pela instrução ObjectCreate(chart_id, lvl_50_line, OBJ_TREND, 0, HL_time, lvl_50, time[l + LookbackBars], lvl_50);. Esse nível é importante porque, de acordo com a lógica deste indicador, procuramos possíveis sinais de compra apenas quando o mercado estiver negociando acima da zona premium / zona de desconto, ou seja, acima do nível de 50% do movimento de alta mais recente. As cores do retângulo e da linha são definidas como clrDarkGreen, e a função ObjectSetInteger é utilizada para aumentar sua espessura (largura) para 2, tornando ambos visualmente mais nítidos. Para que um sinal de compra seja considerado válido, o mercado deve romper completamente acima da HH; em outras palavras, o preço deve fechar fora e acima de toda a zona premium / zona de desconto. Em outras palavras, queremos comprar apenas quando a estrutura do mercado estiver claramente em tendência de alta e o preço tiver ultrapassado a máxima anterior (HH).
2.2.2. Indicando Ponto de Entrada, Stop-Loss e Take Profit
Depois que as zonas de prêmio e desconto entre a Mínima Mais Alta (HL) e a Máxima Mais Alta (HH) forem corretamente marcadas, o próximo passo será identificar possíveis sinais de compra. A chave para uma configuração de compra válida é aguardar que uma vela de rompimento de alta ultrapasse a Máxima Mais Alta (HH), indicando que o mercado continua apresentando forte movimento ascendente.
No entanto, apenas ultrapassar a HH não é suficiente. Para que a entrada seja confirmada, a vela de alta deve fechar acima da HH, pois precisamos ter certeza de que o rompimento é verdadeiro. O fechamento acima da HH indica que a pressão compradora permanece ativa e que o preço provavelmente continuará subindo. Depois que o rompimento for confirmado, o ponto de entrada será estabelecido no fechamento da vela de alta que rompeu acima da HH. Dessa forma, temos a confirmação de que o mercado demonstrou força suficiente nesse momento para entrarmos na operação.
Definimos o Stop Loss (SL) no nível de 50% (lvl_50), que corresponde ao ponto médio entre a HL e a HH, para proteger a operação contra uma possível reversão. Posicionamos o SL nesse nível para evitar sermos atingidos por um possível recuo em direção à zona de desconto (abaixo do nível de 50%), o que pode indicar uma mudança no sentimento do mercado. Nosso método para definir os níveis de Take Profit (TP) é baseado na relação Risco-Retorno (R:R). O objetivo de lucro do primeiro nível de Take Profit, TP1, é igual à distância de risco entre o ponto de entrada e o SL, pois utiliza uma relação R:R de 1:1. O objetivo de lucro do segundo nível de Take Profit, TP2, corresponde ao dobro da distância entre o ponto de entrada e o SL, utilizando uma relação R:R de 1:2. Esses dois níveis de take profit oferecem flexibilidade aos traders que preferem realizar parte do lucro no TP1, permitindo manter parte da posição aberta para capturar ganhos adicionais caso o mercado continue sua tendência de alta.
Exemplo:
// Variables for Entry, Stop Loss, and Take Profit
string entry_line;        // Line object to represent the entry point on the chart
string entry_txt;         // Text object for displaying "BUY" at the entry point
double lvl_SL;            // Stop Loss level (set at the 50% retracement level)
string lvl_sl_line;       // Line object for representing the Stop Loss level
string lvl_sl_txt;        // Text object for labeling the Stop Loss level
double TP1;               // Take Profit 1 level (1:1 risk-reward ratio)
double TP2;               // Take Profit 2 level (1:2 risk-reward ratio)
string lvl_tp_line;       // Line object for representing the Take Profit 1 level
string lvl_tp2_line;      // Line object for representing the Take Profit 2 level
string lvl_tp_txt;        // Text object for labeling the Take Profit 1 level
string lvl_tp2_txt;       // Text object for labeling the Take Profit 2 level
string buy_object;        // Arrow object to indicate the Buy signal on the chart
if(show_bullish == true) // Check if the bullish trend is to be displayed
  {
   if(rates_total >= bars_check) // Ensure enough bars are available for analysis
     {
      // Loop through the price data starting from a certain point based on bars_check and LookbackBars
      for(int i = rates_total - bars_check; i < rates_total - LookbackBars; i++)
        {
         // Check if the current bar is a swing low
         if(IsSwingLow(low, i, LookbackBars))
           {
            // Store the values for the swing low
            L = low[i];
            L_time = time[i];
            L_letter = StringFormat("Low%d", i);

            // Loop through further to find a swing high after the low
            for(int j = i; j < rates_total - LookbackBars; j++)
              {
               // Check if the current bar is a swing high and occurs after the identified swing low
               if(IsSwingHigh(high, j, LookbackBars) && time[j] > L_time)
                 {
                  // Store the values for the swing high
                  H = high[j];
                  H_time = time[j];
                  H_letter = StringFormat("High%d", j);

                  // Loop further to find a higher low after the swing high
                  for(int k = j; k < rates_total - LookbackBars; k++)
                    {
                     // Check if the current bar is a swing low and occurs after the swing high
                     if(IsSwingLow(low, k, LookbackBars) && time[k] > H_time)
                       {
                        // Store the values for the higher low
                        HL = low[k];
                        HL_time = time[k];
                        HL_letter = StringFormat("Higher Low%d", j);

                        // Loop further to find a higher high after the higher low
                        for(int l = j ; l < rates_total - LookbackBars; l++)
                          {
                           // Check if the current bar is a swing high and occurs after the higher low
                           if(IsSwingHigh(high, l, LookbackBars) && time[l] > HL_time)
                             {
                              // Store the values for the higher high
                              HH = high[l];
                              HH_time = time[l];
                              HH_letter = StringFormat("Higher High%d", l);

                              // Check if the pattern follows the expected bullish structure: Low < High, Higher Low < High, Higher High > High
                              if(L < H && HL < H && HL > L && HH > H)
                                {
                                 // Create and display text objects for Low, High, Higher Low, and Higher High on the chart
                                 ObjectCreate(chart_id, L_letter, OBJ_TEXT, 0, L_time, L);
                                 ObjectSetString(chart_id, L_letter, OBJPROP_TEXT, "L");
                                 ObjectSetInteger(chart_id, L_letter, OBJPROP_COLOR, clrDarkGreen);
                                 ObjectSetInteger(chart_id, L_letter, OBJPROP_FONTSIZE, 15);

                                 ObjectCreate(chart_id, H_letter, OBJ_TEXT, 0, H_time, H);
                                 ObjectSetString(chart_id, H_letter, OBJPROP_TEXT, "H");
                                 ObjectSetInteger(chart_id, H_letter, OBJPROP_COLOR, clrDarkGreen);
                                 ObjectSetInteger(chart_id, H_letter, OBJPROP_FONTSIZE, 15);

                                 ObjectCreate(chart_id, HL_letter, OBJ_TEXT, 0, HL_time, HL);
                                 ObjectSetString(chart_id, HL_letter, OBJPROP_TEXT, "HL");
                                 ObjectSetInteger(chart_id, HL_letter, OBJPROP_COLOR, clrDarkGreen);
                                 ObjectSetInteger(chart_id, HL_letter, OBJPROP_FONTSIZE, 15);

                                 ObjectCreate(chart_id, HH_letter, OBJ_TEXT, 0, HH_time, HH);
                                 ObjectSetString(chart_id, HH_letter, OBJPROP_TEXT, "HH");
                                 ObjectSetInteger(chart_id, HH_letter, OBJPROP_COLOR, clrDarkGreen);
                                 ObjectSetInteger(chart_id, HH_letter, OBJPROP_FONTSIZE, 15);


                                 // Calculate the 50% retracement level between the Higher Low and Higher High
                                 lvl_50 = HL + ((HH - HL)/2);

                                 // Generate unique names for the premium-discount box and the 50% level line using the current loop index
                                 pre_dis_box = StringFormat("Premium and Discount Box%d", i);
                                 lvl_50_line = StringFormat("Level 50 Line%d", i);

                                 // Create a rectangle object representing the premium-discount zone from the Higher Low to the Higher High
                                 ObjectCreate(chart_id, pre_dis_box, OBJ_RECTANGLE, 0, HL_time, HL, time[l + LookbackBars], HH);

                                 // Create a trend line (horizontal line) marking the 50% retracement level
                                 ObjectCreate(chart_id, lvl_50_line, OBJ_TREND, 0, HL_time, lvl_50, time[l + LookbackBars], lvl_50);

                                 // Set the color of the premium-discount box to dark green
                                 ObjectSetInteger(chart_id, pre_dis_box, OBJPROP_COLOR, clrDarkGreen);

                                 // Set the color of the 50% level line to dark green
                                 ObjectSetInteger(chart_id, lvl_50_line, OBJPROP_COLOR, clrDarkGreen);

                                 // Set the width of the premium-discount box for better visibility
                                 ObjectSetInteger(chart_id, pre_dis_box, OBJPROP_WIDTH, 2);

                                 // Set the width of the 50% level line for better visibility
                                 ObjectSetInteger(chart_id, lvl_50_line, OBJPROP_WIDTH, 2);


                                 for(int m = l; m < rates_total-1; m++)
                                   {

                                    if(close[m] > open[m] && close[m] > HH && time[m] >= time[l+LookbackBars])
                                      {

                                       TP1 = close[m] + (close[m] - lvl_50);
                                       TP2 = TP1 + (close[m] - lvl_50);

                                       entry_line = StringFormat("Entry%d", m);
                                       lvl_sl_line = StringFormat("SL%d", m);
                                       lvl_tp_line =  StringFormat("TP%d", m);
                                       lvl_tp2_line =  StringFormat("TP 2%d", m);

                                       ObjectCreate(chart_id,entry_line,OBJ_TREND,0,HL_time,close[m],time[m],close[m]);
                                       ObjectCreate(chart_id,lvl_sl_line,OBJ_TREND,0,HL_time,lvl_50,time[m],lvl_50);
                                       ObjectCreate(chart_id,lvl_tp_line,OBJ_TREND,0,HL_time,TP1,time[m],TP1);
                                       ObjectCreate(chart_id,lvl_tp2_line,OBJ_TREND,0,HL_time,TP2,time[m],TP2);

                                       ObjectSetInteger(chart_id,entry_line,OBJPROP_WIDTH,2);
                                       ObjectSetInteger(chart_id,lvl_sl_line,OBJPROP_WIDTH,2);
                                       ObjectSetInteger(chart_id,lvl_tp_line,OBJPROP_WIDTH,2);
                                       ObjectSetInteger(chart_id,lvl_tp2_line,OBJPROP_WIDTH,2);

                                       ObjectSetInteger(chart_id,entry_line,OBJPROP_COLOR,clrDarkGreen);
                                       ObjectSetInteger(chart_id,lvl_sl_line,OBJPROP_COLOR,clrDarkGreen);
                                       ObjectSetInteger(chart_id,lvl_tp_line,OBJPROP_COLOR,clrDarkGreen);
                                       ObjectSetInteger(chart_id,lvl_tp2_line,OBJPROP_COLOR,clrDarkGreen);

                                       entry_txt = StringFormat("Entry Text%d", m);
                                       lvl_sl_txt = StringFormat("SL Text%d", m);
                                       lvl_tp_txt = StringFormat("TP 1 Text%d", m);
                                       lvl_tp2_txt = StringFormat("TP 2 Text%d", m);

                                       ObjectCreate(chart_id, lvl_sl_txt, OBJ_TEXT, 0,time[m],lvl_50);
                                       ObjectSetString(chart_id, lvl_sl_txt, OBJPROP_TEXT, "SL");
                                       ObjectSetInteger(chart_id,lvl_sl_txt,OBJPROP_COLOR,clrDarkGreen);
                                       ObjectSetInteger(chart_id,lvl_sl_txt,OBJPROP_FONTSIZE,15);

                                       ObjectCreate(chart_id, entry_txt, OBJ_TEXT, 0,time[m],close[m]);
                                       ObjectSetString(chart_id, entry_txt, OBJPROP_TEXT, "BUY");
                                       ObjectSetInteger(chart_id,entry_txt,OBJPROP_COLOR,clrDarkGreen);
                                       ObjectSetInteger(chart_id,entry_txt,OBJPROP_FONTSIZE,15);

                                       ObjectCreate(chart_id, lvl_tp_txt, OBJ_TEXT, 0,time[m],TP1);
                                       ObjectSetString(chart_id, lvl_tp_txt, OBJPROP_TEXT, "TP1");
                                       ObjectSetInteger(chart_id,lvl_tp_txt,OBJPROP_COLOR,clrDarkGreen);
                                       ObjectSetInteger(chart_id,lvl_tp_txt,OBJPROP_FONTSIZE,15);

                                       ObjectCreate(chart_id, lvl_tp2_txt, OBJ_TEXT, 0,time[m],TP2);
                                       ObjectSetString(chart_id, lvl_tp2_txt, OBJPROP_TEXT, "TP2");
                                       ObjectSetInteger(chart_id,lvl_tp2_txt,OBJPROP_COLOR,clrDarkGreen);
                                       ObjectSetInteger(chart_id,lvl_tp2_txt,OBJPROP_FONTSIZE,15);

                                       buy_object = StringFormat("Buy Object%d", m);
                                       ObjectCreate(chart_id,buy_object,OBJ_ARROW_BUY,0,time[m],close[m]);

                                       break;
                                      }
                                   }


                                }

                              break; // Exit the loop once the pattern is found
                             }
                          }

                        break; // Exit the loop once the higher low is found
                       }
                    }

                  break; // Exit the loop once the higher high is found
                 }
              }
           }
        }
     }
  }
Saídas:
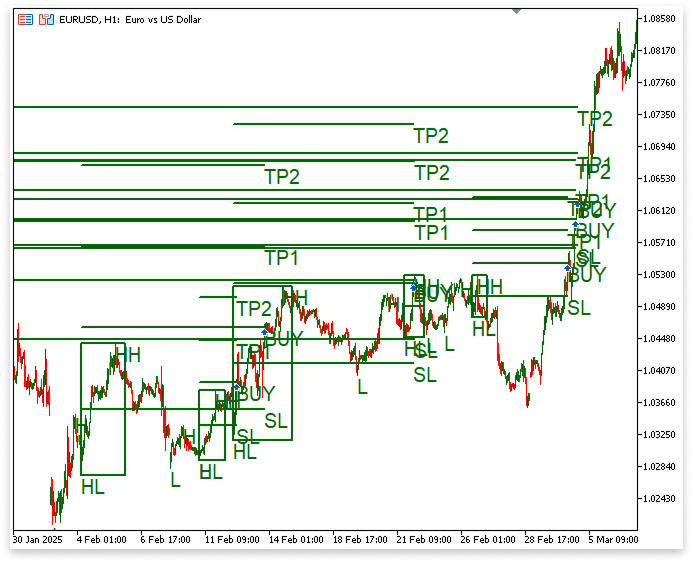
É possível observar que as zonas de prêmio e desconto, bem como os marcadores do sinal de compra, não foram desenhados com precisão na imagem acima. Isso ocorreu porque algumas condições importantes foram ignoradas antes da criação dos objetos no gráfico. Para aprimorar essa abordagem, precisamos incluir verificações adicionais para garantir que o sinal de compra seja realmente válido. Antes de desenhar qualquer objeto no gráfico, devemos confirmar que uma vela realmente rompeu a Máxima Mais Alta (HH). O rompimento da HH representa a continuação da tendência de alta, sendo um requisito essencial para que o sinal de compra seja considerado válido. Não devemos iniciar os cálculos de entrada e gerenciamento de risco antes que essa condição seja satisfeita.
Em seguida, é necessário contar o número de barras entre a Mínima Mais Alta (HL) e o final da caixa de Prêmio/Desconto. Isso garante que a movimentação do preço esteja dentro de um intervalo aceitável e ajuda a compreender o quanto o mercado já se deslocou. Após essa contagem, devemos confirmar que o preço de fechamento da vela de alta que rompeu a Máxima Mais Alta (HH) está próximo da caixa de Prêmio/Desconto. Isso garante que o sinal de compra não esteja muito distante da estrutura de mercado esperada e que esteja ocorrendo dentro de uma faixa de preço considerada adequada.
Exemplo:
// Declare variables to count bars
int n_bars;     // Number of bars from Higher Low to the end of the Premium/Discount box
int n_bars_2;   // Number of bars from the end of the Premium/Discount box to the bullish bar that broke HH
if(show_bullish == true) // Check if the bullish trend is to be displayed { if(rates_total >= bars_check) // Ensure enough bars are available for analysis { // Loop through the price data starting from a certain point based on bars_check and LookbackBars for(int i = rates_total - bars_check; i < rates_total - LookbackBars; i++) { // Check if the current bar is a swing low if(IsSwingLow(low, i, LookbackBars)) { // Store the values for the swing low L = low[i]; L_time = time[i]; L_letter = StringFormat("Low%d", i); // Loop through further to find a swing high after the low for(int j = i; j < rates_total - LookbackBars; j++) { // Check if the current bar is a swing high and occurs after the identified swing low if(IsSwingHigh(high, j, LookbackBars) && time[j] > L_time) { // Store the values for the swing high H = high[j]; H_time = time[j]; H_letter = StringFormat("High%d", j); // Loop further to find a higher low after the swing high for(int k = j; k < rates_total - LookbackBars; k++) { // Check if the current bar is a swing low and occurs after the swing high if(IsSwingLow(low, k, LookbackBars) && time[k] > H_time) { // Store the values for the higher low HL = low[k]; HL_time = time[k]; HL_letter = StringFormat("Higher Low%d", j); // Loop further to find a higher high after the higher low for(int l = j ; l < rates_total - LookbackBars; l++) { // Check if the current bar is a swing high and occurs after the higher low if(IsSwingHigh(high, l, LookbackBars) && time[l] > HL_time) { // Store the values for the higher high HH = high[l]; HH_time = time[l]; HH_letter = StringFormat("Higher High%d", l); // Loop through the bars to check for the conditions for entry for(int m = l; m < rates_total-1; m++) { // Check if the current bar is a bullish bar and if the price has broken the higher high (HH) if(close[m] > open[m] && close[m] > HH && time[m] >= time[l+LookbackBars]) { // Count the bars between HL_time and the end of the Premium/Discount box n_bars = Bars(_Symbol, PERIOD_CURRENT, HL_time, time[l + LookbackBars]); // Count the bars between the end of the Premium/Discount box and the candle that broke HH n_bars_2 = Bars(_Symbol, PERIOD_CURRENT, time[l + LookbackBars], time[m]); // Check if the pattern follows the expected bullish structure: Low < High, Higher Low < High, Higher High > High if(L < H && HL < H && HL > L && HH > H && open[l+LookbackBars] <= HH && n_bars_2 < n_bars) { // Create and display text objects for Low, High, Higher Low, and Higher High on the chart ObjectCreate(chart_id, L_letter, OBJ_TEXT, 0, L_time, L); ObjectSetString(chart_id, L_letter, OBJPROP_TEXT, "L"); ObjectSetInteger(chart_id, L_letter, OBJPROP_COLOR, clrDarkGreen); ObjectSetInteger(chart_id, L_letter, OBJPROP_FONTSIZE, 15); ObjectCreate(chart_id, H_letter, OBJ_TEXT, 0, H_time, H); ObjectSetString(chart_id, H_letter, OBJPROP_TEXT, "H"); ObjectSetInteger(chart_id, H_letter, OBJPROP_COLOR, clrDarkGreen); ObjectSetInteger(chart_id, H_letter, OBJPROP_FONTSIZE, 15); ObjectCreate(chart_id, HL_letter, OBJ_TEXT, 0, HL_time, HL); ObjectSetString(chart_id, HL_letter, OBJPROP_TEXT, "HL"); ObjectSetInteger(chart_id, HL_letter, OBJPROP_COLOR, clrDarkGreen); ObjectSetInteger(chart_id, HL_letter, OBJPROP_FONTSIZE, 15); ObjectCreate(chart_id, HH_letter, OBJ_TEXT, 0, HH_time, HH); ObjectSetString(chart_id, HH_letter, OBJPROP_TEXT, "HH"); ObjectSetInteger(chart_id, HH_letter, OBJPROP_COLOR, clrDarkGreen); ObjectSetInteger(chart_id, HH_letter, OBJPROP_FONTSIZE, 15); // Calculate the 50% retracement level between the Higher Low and Higher High lvl_50 = HL + ((HH - HL)/2); // Generate unique names for the premium-discount box and the 50% level line using the current loop index pre_dis_box = StringFormat("Premium and Discount Box%d", i); lvl_50_line = StringFormat("Level 50 Line%d", i); // Create a rectangle object representing the premium-discount zone from the Higher Low to the Higher High ObjectCreate(chart_id, pre_dis_box, OBJ_RECTANGLE, 0, HL_time, HL, time[l + LookbackBars], HH); // Create a trend line (horizontal line) marking the 50% retracement level ObjectCreate(chart_id, lvl_50_line, OBJ_TREND, 0, HL_time, lvl_50, time[l + LookbackBars], lvl_50); // Set the color of the premium-discount box to dark green ObjectSetInteger(chart_id, pre_dis_box, OBJPROP_COLOR, clrDarkGreen); // Set the color of the 50% level line to dark green ObjectSetInteger(chart_id, lvl_50_line, OBJPROP_COLOR, clrDarkGreen); // Set the width of the premium-discount box for better visibility ObjectSetInteger(chart_id, pre_dis_box, OBJPROP_WIDTH, 2); // Set the width of the 50% level line for better visibility ObjectSetInteger(chart_id, lvl_50_line, OBJPROP_WIDTH, 2); // Calculate Take Profit levels based on the 50% retracement TP1 = close[m] + (close[m] - lvl_50); // TP1 at 1:1 risk-reward ratio TP2 = TP1 + (close[m] - lvl_50); // TP2 at 1:2 risk-reward ratio // Create unique object names for Entry, Stop Loss, and Take Profit lines and text entry_line = StringFormat("Entry%d", m); lvl_sl_line = StringFormat("SL%d", m); lvl_tp_line = StringFormat("TP%d", m); lvl_tp2_line = StringFormat("TP 2%d", m); // Create the lines on the chart for Entry, Stop Loss, and Take Profit levels ObjectCreate(chart_id, entry_line, OBJ_TREND, 0, HL_time, close[m], time[m], close[m]); ObjectCreate(chart_id, lvl_sl_line, OBJ_TREND, 0, HL_time, lvl_50, time[m], lvl_50); ObjectCreate(chart_id, lvl_tp_line, OBJ_TREND, 0, HL_time, TP1, time[m], TP1); ObjectCreate(chart_id, lvl_tp2_line, OBJ_TREND, 0, HL_time, TP2, time[m], TP2); // Set the properties for the lines (width, color, etc.) ObjectSetInteger(chart_id, entry_line, OBJPROP_WIDTH, 2); ObjectSetInteger(chart_id, lvl_sl_line, OBJPROP_WIDTH, 2); ObjectSetInteger(chart_id, lvl_tp_line, OBJPROP_WIDTH, 2); ObjectSetInteger(chart_id, lvl_tp2_line, OBJPROP_WIDTH, 2); ObjectSetInteger(chart_id, entry_line, OBJPROP_COLOR, clrDarkGreen); ObjectSetInteger(chart_id, lvl_sl_line, OBJPROP_COLOR, clrDarkGreen); ObjectSetInteger(chart_id, lvl_tp_line, OBJPROP_COLOR, clrDarkGreen); ObjectSetInteger(chart_id, lvl_tp2_line, OBJPROP_COLOR, clrDarkGreen); // Create the text labels for Entry, Stop Loss, and Take Profit levels entry_txt = StringFormat("Entry Text%d", m); lvl_sl_txt = StringFormat("SL Text%d", m); lvl_tp_txt = StringFormat("TP 1 Text%d", m); lvl_tp2_txt = StringFormat("TP 2 Text%d", m); // Create the text objects for the Entry, Stop Loss, and Take Profit labels ObjectCreate(chart_id, lvl_sl_txt, OBJ_TEXT, 0, time[m], lvl_50); ObjectSetString(chart_id, lvl_sl_txt, OBJPROP_TEXT, "SL"); ObjectSetInteger(chart_id, lvl_sl_txt, OBJPROP_COLOR, clrDarkGreen); ObjectSetInteger(chart_id, lvl_sl_txt, OBJPROP_FONTSIZE, 15); ObjectCreate(chart_id, entry_txt, OBJ_TEXT, 0, time[m], close[m]); ObjectSetString(chart_id, entry_txt, OBJPROP_TEXT, "BUY"); ObjectSetInteger(chart_id, entry_txt, OBJPROP_COLOR, clrDarkGreen); ObjectSetInteger(chart_id, entry_txt, OBJPROP_FONTSIZE, 15); ObjectCreate(chart_id, lvl_tp_txt, OBJ_TEXT, 0, time[m], TP1); ObjectSetString(chart_id, lvl_tp_txt, OBJPROP_TEXT, "TP1"); ObjectSetInteger(chart_id, lvl_tp_txt, OBJPROP_COLOR, clrDarkGreen); ObjectSetInteger(chart_id, lvl_tp_txt, OBJPROP_FONTSIZE, 15); ObjectCreate(chart_id, lvl_tp2_txt, OBJ_TEXT, 0, time[m], TP2); ObjectSetString(chart_id, lvl_tp2_txt, OBJPROP_TEXT, "TP2"); ObjectSetInteger(chart_id, lvl_tp2_txt, OBJPROP_COLOR, clrDarkGreen); ObjectSetInteger(chart_id, lvl_tp2_txt, OBJPROP_FONTSIZE, 15); // Create a Buy arrow object to indicate the Buy signal on the chart buy_object = StringFormat("Buy Object%d", m); ObjectCreate(chart_id, buy_object, OBJ_ARROW_BUY, 0, time[m], close[m]); break; // Exit the loop once a Buy signal is found } } } break; // Exit the loop once the pattern is found } } break; // Exit the loop once the higher low is found } } break; // Exit the loop once the higher high is found } } } } } }
Saídas:
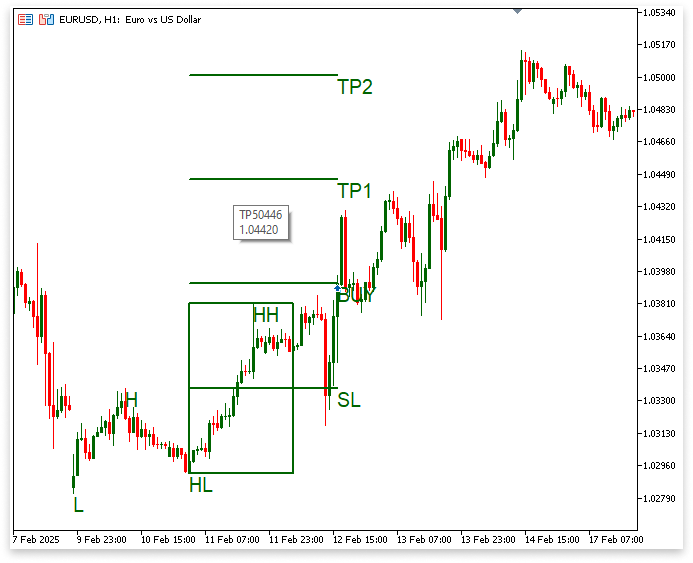
Explicação:
Duas variáveis inteiras, n_bars e n_bars_2, foram declaradas no escopo global do código. Essas variáveis determinam o número de velas (barras) entre pontos importantes do padrão da estrutura de mercado de alta. Especificamente, n_bars representa o número de barras entre a Mínima Mais Alta (HL) e o final da caixa de Prêmio/Desconto (time[l + LookbackBars]). Já n_bars_2 contabiliza o número de barras entre a vela de alta que rompeu a Máxima Mais Alta (HH) e o final da caixa de Prêmio/Desconto. Essa contagem é utilizada para verificar se o movimento do preço se afastou excessivamente da zona ideal de negociação ou se o sinal de compra ainda permanece válido.
Essas variáveis são utilizadas posteriormente no código como parte de uma condição adicional de validação que fortalece a confirmação da estrutura de mercado de alta. Após identificar a Mínima, a Máxima, a Mínima Mais Alta e a Máxima Mais Alta (garantindo que atendam às condições L < H, HL < H, HL > L e HH > H) e verificar que o preço de abertura da vela que encerra a caixa de Prêmio/Desconto não está acima da Máxima Mais Alta, é realizada uma verificação adicional: n_bars_2 < n_bars. Isso garante que a vela de rompimento de alta (aquela que rompe acima da HH) apareça relativamente próxima da formação da estrutura, evitando sinais que ocorram muito tempo depois, o que poderia indicar uma configuração fraca ou inválida.
Todas as rotinas ObjectCreate() e ObjectSet*(), anteriormente utilizadas para desenhar a Mínima, a Máxima, a Mínima Mais Alta, a Máxima Mais Alta, a caixa de Prêmio/Desconto, a linha de 50% e os marcadores de Entrada/SL/TP no gráfico, foram movidas para dentro desse bloco if, impondo essa validação mais rigorosa. Isso significa que esses elementos visuais somente serão criados e exibidos quando todos os requisitos relacionados à estrutura de alta e ao tempo forem satisfeitos. Dessa forma, o gráfico permanece limpo, evitando ser sobrecarregado por elementos incorretos ou prematuros decorrentes de sinais enganosos.
2.3. Tendência de Baixa
Antes de indicar um sinal de venda, este indicador deve utilizar a estrutura do mercado para confirmar a existência de uma tendência de baixa. Isso é feito identificando uma sequência de pontos importantes de preço: uma máxima, uma mínima, uma máxima mais baixa e uma mínima mais baixa. Esse padrão demonstra que os vendedores estão no controle e que o mercado provavelmente continuará se movendo para baixo, confirmando o momentum de baixa. Assim que essa estrutura for confirmada, o indicador começará a procurar sinais de venda válidos.
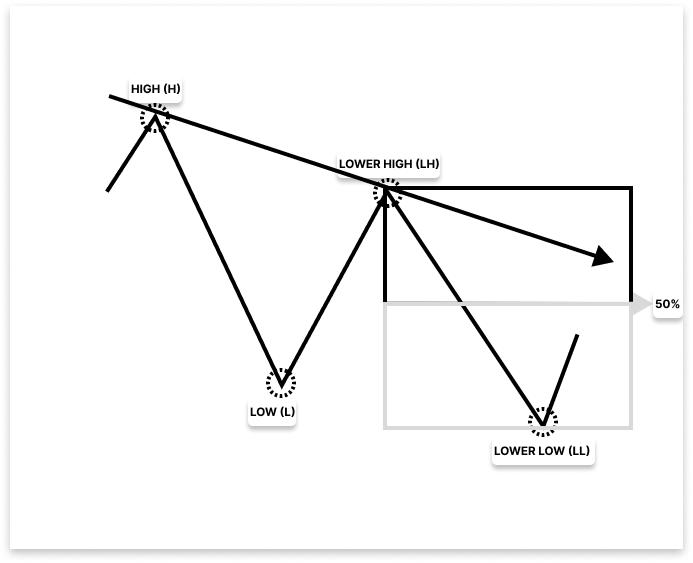
Exemplo:
// Variables for Bearish Market Structure
double LH;              // Lower High: the high formed after the initial low in a downtrend
datetime LH_time;       // Time of the Lower High
string LH_letter;       // Label used to display the Lower High on the chart (e.g., "LH")
double LL;              // Lower Low: the new low formed after the Lower High in a downtrend
datetime LL_time;       // Time of the Lower Low
string LL_letter;       // Label used to display the Lower Low on the chart (e.g., "LL")
string sell_object; // Arrow object to indicate the Sell signal on the chart
// BEARISH TREND
if(show_bearish == true)  // Check if the user enabled the bearish trend display
  {
   if(rates_total >= bars_check)  // Ensure enough candles are available for processing
     {
      // Loop through historical bars to find a swing high (potential start of bearish structure)
      for(int i = rates_total - bars_check; i < rates_total - LookbackBars; i++)
        {
         if(IsSwingHigh(high, i, LookbackBars))  // Detect first swing high
           {
            H = high[i];
            H_time = time[i];
            H_letter = StringFormat("High B%d", i);  // Label for the high

            // From the swing high, look for the next swing low
            for(int j = i; j < rates_total - LookbackBars; j++)
              {
               if(IsSwingLow(low, j, LookbackBars) && time[j] > H_time)  // Confirm next swing low
                 {
                  L = low[j];
                  L_time = time[j];
                  L_letter = StringFormat("Low B%d", j);  // Label for the low

                  // From the swing low, look for the Lower High
                  for(int k = j; k < rates_total - LookbackBars; k++)
                    {
                     if(IsSwingHigh(high, k, LookbackBars) && time[k] > L_time)
                       {
                        LH = high[k];
                        LH_time = time[k];
                        LH_letter = StringFormat("Lower High%d", k);  // Label for the Lower High

                        // From the LH, find a Lower Low
                        for(int l = j ; l < rates_total - LookbackBars; l++)
                          {
                           if(IsSwingLow(low, l, LookbackBars) && time[l] > LH_time)
                             {
                              LL = low[l];
                              LL_time = time[l];
                              LL_letter = StringFormat("Lower Low%d", l);  // Label for Lower Low

                              // Calculate 50% retracement level from LH to LL
                              lvl_50 = LL + ((LH - LL)/2);

                              // Prepare object names
                              pre_dis_box = StringFormat("Gan Box B%d", i);
                              lvl_50_line = StringFormat("Level 50 Line B%d", i);

                              // Search for a bearish entry condition
                              for(int m = l; m < rates_total-1; m++)
                                {
                                 // Confirm bearish candle breaking below the LL
                                 if(close[m] < open[m] && close[m] < LL && time[m] >= time[l+LookbackBars])
                                   {
                                    // Count bars for pattern distance validation
                                    n_bars = Bars(_Symbol,PERIOD_CURRENT,LH_time, time[l+LookbackBars]);  // From LH to box end
                                    n_bars_2 = Bars(_Symbol,PERIOD_CURRENT,time[l+LookbackBars], time[m]);  // From box end to break candle

                                    // Confirm valid bearish structure and proximity of break candle
                                    if(H > L && LH > L && LH < H && LL < L && open[l+LookbackBars] >= LL && n_bars_2 < n_bars)
                                      {
                                       // Draw the Premium/Discount box
                                       ObjectCreate(chart_id,pre_dis_box, OBJ_RECTANGLE,0,LH_time,LH, time[l+LookbackBars],LL);
                                       ObjectCreate(chart_id,lvl_50_line, OBJ_TREND,0,LH_time,lvl_50, time[l+LookbackBars],lvl_50);

                                       ObjectSetInteger(chart_id,pre_dis_box,OBJPROP_WIDTH,2);
                                       ObjectSetInteger(chart_id,lvl_50_line,OBJPROP_WIDTH,2);

                                       // Label the structure points
                                       ObjectCreate(chart_id, H_letter, OBJ_TEXT, 0, H_time, H);
                                       ObjectSetString(chart_id, H_letter, OBJPROP_TEXT, "H");
                                       ObjectSetInteger(chart_id,H_letter,OBJPROP_FONTSIZE,15);

                                       ObjectCreate(chart_id, L_letter, OBJ_TEXT, 0, L_time, L);
                                       ObjectSetString(chart_id, L_letter, OBJPROP_TEXT, "L");
                                       ObjectSetInteger(chart_id,L_letter,OBJPROP_FONTSIZE,15);

                                       ObjectCreate(chart_id, LH_letter, OBJ_TEXT, 0, LH_time, LH);
                                       ObjectSetString(chart_id, LH_letter, OBJPROP_TEXT, "LH");
                                       ObjectSetInteger(chart_id,LH_letter,OBJPROP_FONTSIZE,15);

                                       ObjectCreate(chart_id, LL_letter, OBJ_TEXT, 0, LL_time, LL);
                                       ObjectSetString(chart_id, LL_letter, OBJPROP_TEXT, "LL");
                                       ObjectSetInteger(chart_id,LL_letter,OBJPROP_FONTSIZE,15);

                                       ObjectSetInteger(chart_id,H_letter,OBJPROP_WIDTH,2);
                                       ObjectSetInteger(chart_id,L_letter,OBJPROP_WIDTH,2);
                                       ObjectSetInteger(chart_id,LL_letter,OBJPROP_WIDTH,2);
                                       ObjectSetInteger(chart_id,LH_letter,OBJPROP_WIDTH,2);

                                       // Calculate Take Profits based on 1:1 and 1:2 RR
                                       TP1 = close[m] - (lvl_50 - close[m]);
                                       TP2 = TP1 - (lvl_50 - close[m]);

                                       // Generate entry, SL and TP object names
                                       entry_line = StringFormat("Entry B%d", m);
                                       lvl_sl_line = StringFormat("SL B%d", m);
                                       lvl_tp_line =  StringFormat("TP B%d", m);
                                       lvl_tp2_line =  StringFormat("TP 2 B%d", m);

                                       // Draw entry, SL, TP1, TP2 levels
                                       ObjectCreate(chart_id,entry_line,OBJ_TREND,0,LH_time,close[m],time[m],close[m]);
                                       ObjectCreate(chart_id,lvl_sl_line, OBJ_TREND,0,LH_time,lvl_50, time[m],lvl_50);
                                       ObjectCreate(chart_id,lvl_tp_line, OBJ_TREND,0,LH_time,TP1, time[m],TP1);
                                       ObjectCreate(chart_id,lvl_tp2_line, OBJ_TREND,0,LH_time,TP2, time[m],TP2);

                                       ObjectSetInteger(chart_id,entry_line,OBJPROP_WIDTH,2);
                                       ObjectSetInteger(chart_id,lvl_sl_line,OBJPROP_WIDTH,2);
                                       ObjectSetInteger(chart_id,lvl_tp_line,OBJPROP_WIDTH,2);
                                       ObjectSetInteger(chart_id,lvl_tp2_line,OBJPROP_WIDTH,2);

                                       // Generate text labels
                                       entry_txt = StringFormat("Entry Text B%d", m);
                                       lvl_sl_txt = StringFormat("SL Text B%d", m);
                                       lvl_tp_txt = StringFormat("TP Text B%d", m);
                                       lvl_tp2_txt = StringFormat("TP 2 Text B%d", m);

                                       ObjectCreate(chart_id, entry_txt, OBJ_TEXT, 0,time[m],close[m]);
                                       ObjectSetString(chart_id, entry_txt, OBJPROP_TEXT, "SELL");
                                       ObjectSetInteger(chart_id,entry_txt,OBJPROP_FONTSIZE,15);

                                       ObjectCreate(chart_id, lvl_sl_txt, OBJ_TEXT, 0,time[m],lvl_50);
                                       ObjectSetString(chart_id, lvl_sl_txt, OBJPROP_TEXT, "SL");
                                       ObjectSetInteger(chart_id,lvl_sl_txt,OBJPROP_FONTSIZE,15);

                                       ObjectCreate(chart_id, lvl_tp_txt, OBJ_TEXT, 0,time[m],TP1);
                                       ObjectSetString(chart_id, lvl_tp_txt, OBJPROP_TEXT, "TP1");
                                       ObjectSetInteger(chart_id,lvl_tp_txt,OBJPROP_FONTSIZE,15);

                                       ObjectCreate(chart_id, lvl_tp2_txt, OBJ_TEXT, 0,time[m],TP2);
                                       ObjectSetString(chart_id, lvl_tp2_txt, OBJPROP_TEXT, "TP2");
                                       ObjectSetInteger(chart_id,lvl_tp2_txt,OBJPROP_FONTSIZE,15);

                                       // Draw sell arrow
                                       sell_object = StringFormat("Sell Object%d", m);
                                       ObjectCreate(chart_id,sell_object,OBJ_ARROW_SELL,0,time[m],close[m]);
                                      }

                                    break;  // Exit loop after valid setup
                                   }
                                }

                              break;  // Exit LL search
                             }
                          }

                        break;  // Exit LH search
                       }
                    }

                  break;  // Exit L search
                 }
              }
           }
        }
     }
  }
Saídas:
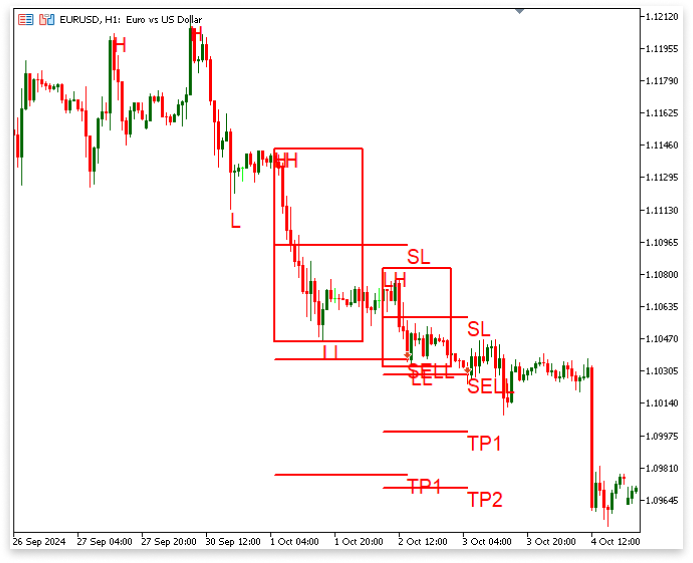
Explicação:
O código começa utilizando if(show_bearish == true) para verificar se o usuário ativou a lógica da tendência de baixa. Caso ela esteja habilitada e haja barras suficientes disponíveis (rates_total >= bars_check), o indicador percorre o histórico de barras para identificar uma estrutura de mercado de baixa válida. A primeira etapa consiste em identificar um topo de oscilação (H). Após identificar esse topo, o código procura um fundo de oscilação (L) que ocorra depois da máxima. Quando ele é encontrado, o código continua procurando uma máxima mais baixa (LH) e, em seguida, uma mínima mais baixa (LL), validando a estrutura de baixa, que corresponde a um topo de oscilação abaixo da primeira máxima (H). Com esses valores e seus respectivos horários, são criados no gráfico os rótulos "H", "L", "LH" e "LL".
Em seguida, é desenhada a caixa da zona premium / zona de desconto entre a Máxima Mais Baixa (LH) e a Mínima Mais Baixa (LL), e é calculado o nível de retração de 50% entre esses dois pontos (lvl_50 = LL + ((LH - LL)/2)). Antes de desenhar qualquer objeto relacionado à operação (entrada, SL, TP1 e TP2), o indicador procura uma vela de baixa (close < open) que feche abaixo da LL. O código também garante que o rompimento da estrutura ocorra dentro de um número razoável de barras utilizando duas variáveis: n_bars, que conta o número de barras entre a Máxima Mais Baixa (LH) e o final da caixa de Prêmio/Desconto, e n_bars_2, que conta o número de barras entre o final da caixa e a vela de baixa que rompe a Mínima Mais Baixa (LL). Somente quando todos os requisitos forem atendidos, incluindo uma estrutura válida, um rompimento confirmado e uma distância adequada, o código desenha a linha de entrada no fechamento da vela, posiciona o Stop Loss (SL) no nível de 50% e define o TP1 e o TP2 com relações risco-retorno de 1:1 e 1:2, respectivamente.
Além disso, ele adiciona uma seta de venda e a palavra "SELL" sobre a vela de baixa. Para uma tendência de baixa, a lógica é essencialmente a mesma utilizada para a tendência de alta, porém de forma invertida. Como a tendência de baixa é apenas o oposto da tendência de alta, que já foi detalhada anteriormente, a explicação é mais breve. A estrutura e o raciocínio permanecem os mesmos, apenas invertidos para representar um movimento descendente em vez de um movimento ascendente.
Conclusão
Neste artigo, desenvolvemos um indicador personalizado em MQL5 que identifica a estrutura do mercado detectando pontos importantes, como Mínima (L), Mínima Mais Baixa (LL), Mínima Mais Alta (HL), Máxima (H) e Máxima Mais Alta (HH). Com base nesses pontos, o indicador determina tendências de alta e de baixa e desenha automaticamente os pontos de entrada, o stop loss no nível de 50% e os níveis de take profit (TP1 e TP2) com base em uma estrutura bem definida. Ele também marca as zonas de prêmio e desconto para destacar visualmente as regiões onde o preço tem maior probabilidade de reagir. Todos os objetos do gráfico são desenhados somente quando condições específicas são atendidas, garantindo que os sinais permaneçam limpos e confiáveis.
Traduzido do Inglês pela MetaQuotes Ltd.
Artigo original: https://www.mql5.com/en/articles/17689
Aviso: Todos os direitos sobre esses materiais pertencem à MetaQuotes Ltd. É proibida a reimpressão total ou parcial.
Esse artigo foi escrito por um usuário do site e reflete seu ponto de vista pessoal. A MetaQuotes Ltd. não se responsabiliza pela precisão das informações apresentadas nem pelas possíveis consequências decorrentes do uso das soluções, estratégias ou recomendações descritas.

 Algoritmo de otimização do dingo - Dingo Optimization Algorithm (DOA)
 Arbitragem Estatística via Reversão à Média no Trading de Pares: Superando o Mercado com Matemática
 Redes neurais no trading: uma visão unificada sobre espaço e tempo (Global-Local Attention)
 Redes neurais no trading: uma visão unificada sobre espaço e tempo (Extralonger)

- Aplicativos de negociação gratuitos
- 8 000+ sinais para cópia
- Notícias econômicas para análise dos mercados financeiros
Você concorda com a política do site e com os termos de uso
Já segui suas instruções. Mas nenhum indicador aparece, como L, H, HL, HH, nem informações como COMPRA, TP, SL. Verifiquei meu diário, não havia nenhum erro?
Qual par e qual intervalo de tempo você testou?
Por favor, preciso da sua ajuda.
Obrigado.