Gann Square of 144
- 지표
- 버전: 3.20
- 업데이트됨: 19 7월 2026
- 활성화: 10

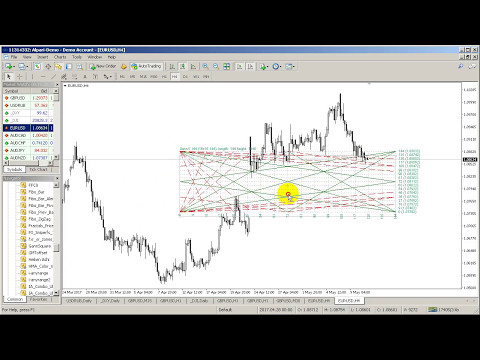
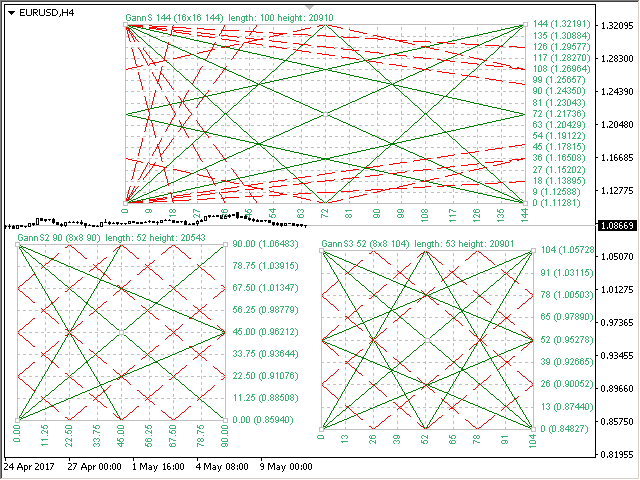
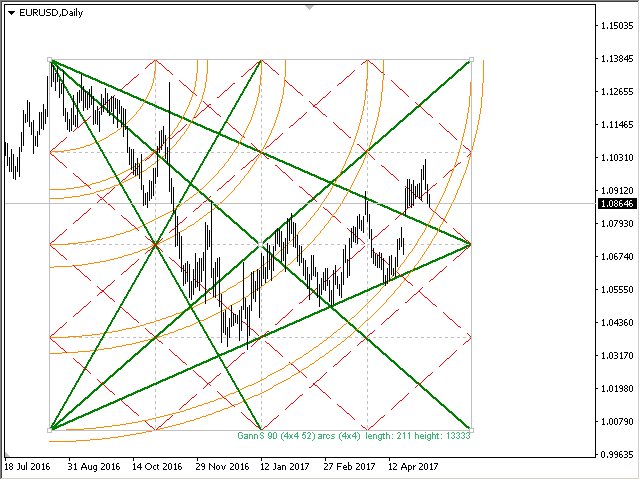
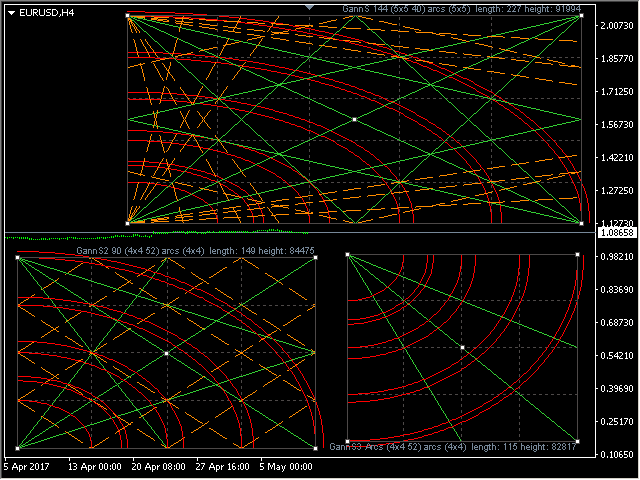
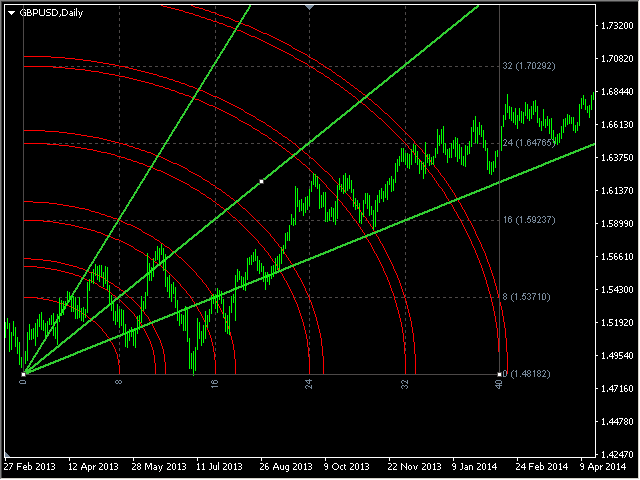
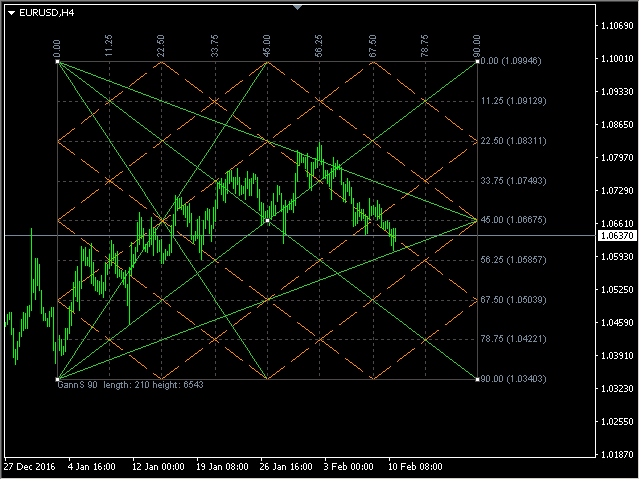
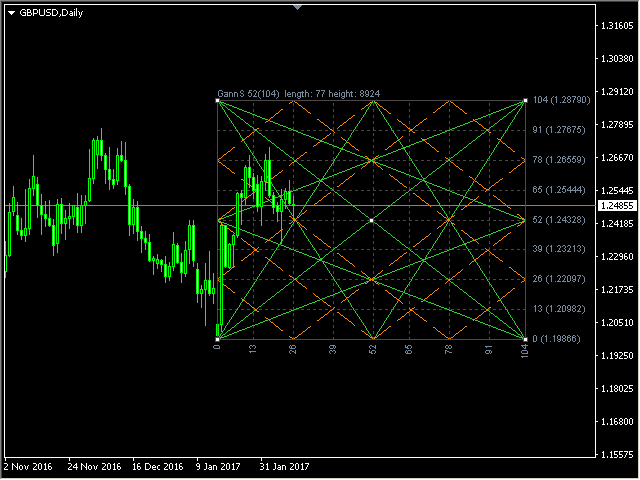
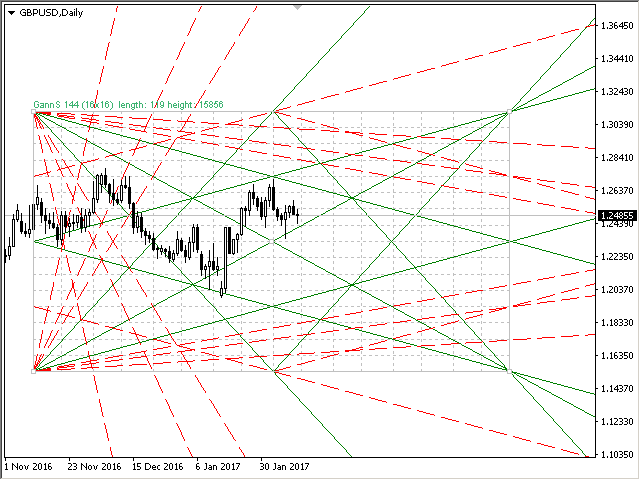
The Gann Box (or Gann Square) is a market analysis method based on the "Mathematical formula for market predictions" article by W.D. Gann. This indicator can plot three models of Squares: 90, 52(104), 144. There are six variants of grids and two variants of arcs. You can plot multiple squares on one chart simultaneously
Parameters
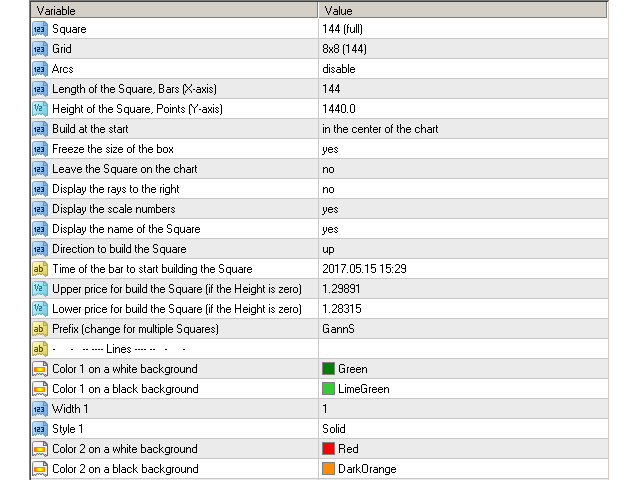
Square — selection of a Gann square model:
- 90 — square of 90 (or square of nine);
- 52 (104) — square of 52 (or 104);
- 144 — universal square of 144;
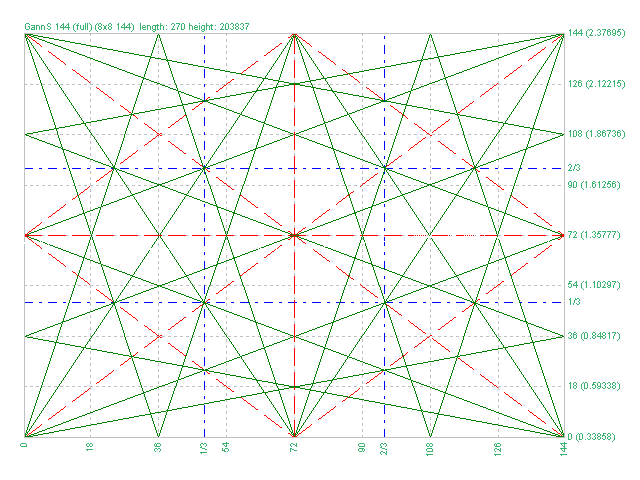
- 144 (full) — "full" version of the square, combined lines from other squares. As far as is known, W.D. Gann did not have such a markup;
- for Arcs — simplified square for arcs;
Grid — variants of grids:
- 4x4 (52) — 4 by 4 grid, 52 markup;
- 5x5 (40);
- 8x8 (90);
- 8x8 (104);
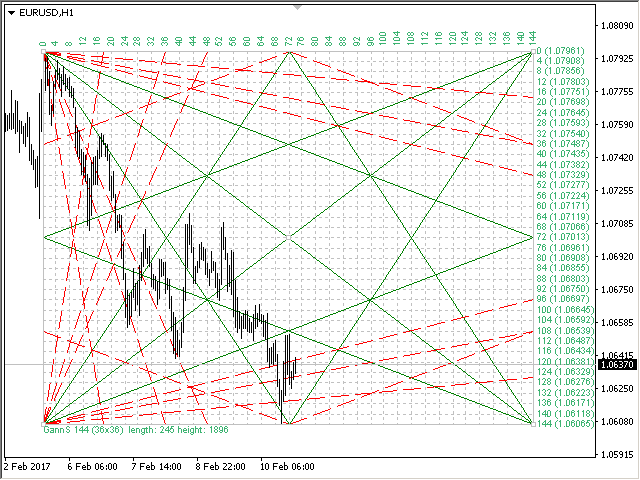
- 8x8 (144);
- 16x16 (144);
- 36x36 (144);
- disable — disable the grid;
Arcs — variants of arcs:
- 4x4;
- 5x5;
- disable — disable the arcs;
Square parameters at start:
Length of Square, Bars (X-axis) — length of the square in bars;
Height of Square, Points (Y-axis) — height of the square in points;
Build at the start — build the square at the start:
Height of Square, Points (Y-axis) — height of the square in points;
Build at the start — build the square at the start:
— in the center of the chart — in the center of the chart;— at the specified time — at the specified time;— to use the previous — use the previous square (if present on the chart);
Freeze the size of the box — fix the scale of the Gann box;
Leave the square on the chart — leave the square on the chart when removing the indicator;
Display the rays to the right — display the rays to the right;
Display the scale numbers — display the scale numbers;
Display the name of the Square — display the name of the square;
Direction of Square — direction to build the square, up or down;
Time of the bar to start building the Square — time of the bar to start plotting the box;
Upper price for build the Square (if the Height is zero) — upper price of the box, if the "Height of Square" parameter is zero, then the square is plotted for these prices;
Lower price for build the Square (if the Height is zero) — lower price of the box, if the "Height of Square" parameter is zero, then the square is plotted for these prices;
Prefix (change for several boxes) — prefix of the box objects, it should be changed if multiple squares are used simultaneously;
Colours
Color 1 on a white background — the color of line 1 on a white background;
Color 1 on a black background — the color of line 1 on a black background;
Width 1 — line width 1;
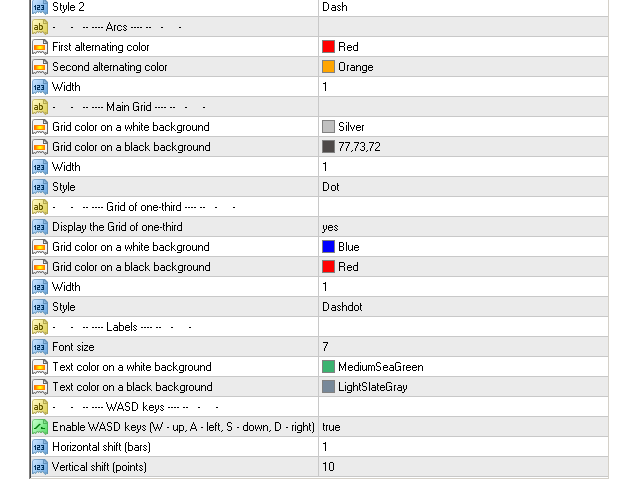
Style 1 — line style 1;
Color 2 on a white background — the color of line 2 on a white background;
Color 2 on a black background — the color of line 2 on a black background;
Width 2 — line width 2;
Style 2 — line style 2;
Color 1 on a black background — the color of line 1 on a black background;
Width 1 — line width 1;
Style 1 — line style 1;
Color 2 on a white background — the color of line 2 on a white background;
Color 2 on a black background — the color of line 2 on a black background;
Width 2 — line width 2;
Style 2 — line style 2;
Arcs
Color on a white background;
Color on a black background;
Width — the width of the arc line;
Color on a black background;
Width — the width of the arc line;
Grid
Grid color on a white background;
Grid color on a black background;
Width lines — the width of the grid lines;
Style lines — the style of the grid lines;
Grid color on a black background;
Width lines — the width of the grid lines;
Style lines — the style of the grid lines;
Lines 1/3
Display the Grid of one-third — show the grid 1/3;
Font size;
Text color on a white background;
Text color on a black background;
Key control
Enable WASD keys — activate control with 'WASD' keys. 'W' is up, 'A' is left, 'S' is down, and 'D' is right;
Horizontal shift (bars) — horizontal shift of the Square (bars);
Vertical shift (points) — vertical shift of the Square (points);
All timeframes — display a square on all timeframes of the chart;
M1-MN1 — display a square on the corresponding period M1-MN1.


more than great