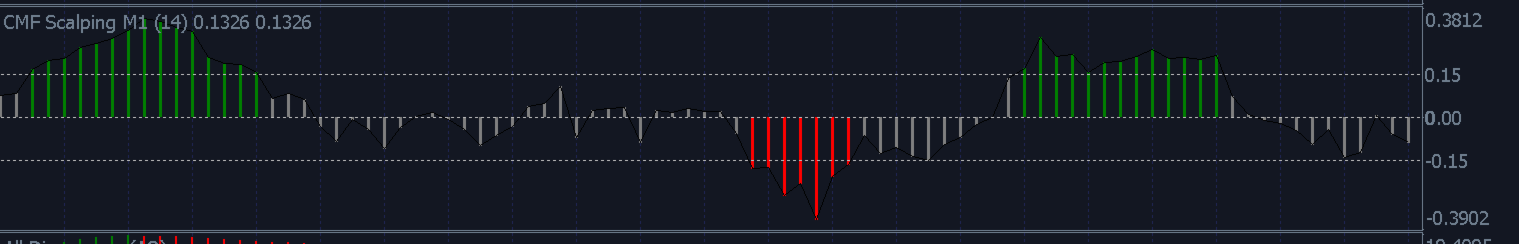
CMF Scalping

Dynamic CMF Calculation: Customize the period for the Chaikin Money Flow (CMF) to fine-tune your analysis and maximize signal precision.

Intuitive Color-Coded Alerts: Instantly interpret market conditions with clear visual cues:

  • Green Alert: Indicates the Overbought zone – signaling a potential selling opportunity.

  • Red Alert: Indicates the Oversold zone – suggesting a potential buying opportunity.

  • Gray Alert: Represents the Neutral zone – a signal to wait for a confirmed trend or reversal.

Automatic Divergence Detection: Effortlessly uncover hidden market turning points. Our system automatically spots divergences between price and momentum, helping you anticipate significant reversals.

Real Volume Integration: Enhance signal accuracy by switching to the Real Volume Option, ensuring your trading decisions are based on the most reliable market data.

추천 제품
Introduction It is common practice for professional trades to hide their stop loss / take profit from their brokers. Either from keeping their strategy to the themselves or from the fear that their broker works against them. Using this indicator, the stop loss / take profit points will be drawn on the product chart using the bid price. So, you can see exactly when the price is hit and close it manually.  Usage Once attached to the chart, the indicator scans the open orders to attach lines for t
Price vs Vwap
Pieter Gerhardus Van Zyl
Price vs VWAP is a clean, non-repainting indicator that compares raw market price directly against a rolling Volume Weighted Average Price (VWAP) over a configurable time window. It plots two lines in a separate window: the real closing price and a dynamically calculated VWAP based on recent volume and price interaction. By adapting the VWAP lookback to the chart timeframe, it delivers a clear view of value versus execution, helping traders see whether price is trading at a premium or discount.
캔들의 종가를 예측하는 지표입니다. 지표는 주로 D1 차트에서 사용하기 위한 것이. 이 지표는 전통적인 외환 거래와 바이너리 옵션 거래 모두에 적합합니다. 지표는 독립형 거래 시스템으로 사용하거나 기존 거래 시스템에 추가로 사용할 수 있습니다. 이 표시기는 현재 양초를 분석하여 양초 본체 내부의 특정 강도 요인과 이전 양초의 매개변수를 계산합니다. 따라서 지표는 시장 움직임의 추가 방향과 현재 양초의 종가를 예측합니다. 이 방법 덕분에 지표는 단기 및 중장기 거래 모두에 적합합니다. 지표를 사용하면 시장 상황을 분석하는 동안 지표가 생성할 잠재적 신호의 수를 설정할 수 있습니다. 표시기 설정에는 이를 위한 특별한 매개변수가 있습니다. 또한 인디케이터는 새로운 신호에 대해 차트의 메시지 형태, 이메일 및 PUSH 알림 형태로 알릴 수 있습니다. 구매 후 저에게 꼭 써주세요! 나는 당신에게 지표와 거래에 대한 나의 추천을 줄 것입니다! 또한 보너스를 받으세요!
Binary Option Signal
Yaroslav Varankin
Indicator for binary options arrow is easy to use and does not require configuration works on all currency pairs, cryptocurrencies buy signal blue up arrow sell signal red down arrow tips do not trade during news and 15-30 minutes before their release, as the market is too volatile and there is a lot of noise it is worth entering trades one or two candles from the current period (recommended for 1 candle) timeframe up to m 15 recommended money management fixed lot or fixed percentage of the depo
A technical indicator that calculates its readings on trading volumes. In the form of a histogram, it shows the accumulation of the strength of the movement of the trading instrument. It has independent calculation systems for bullish and bearish directions. Works on any trading instruments and time frames. Can complement any trading system. The indicator does not redraw its values, the signals appear on the current candle. It is easy to use and does not load the chart, does not require addition
Trend Bilio
Ivan Simonika
Trend Bilio - an arrow indicator without redrawing shows potential market entry points in the form of arrows of the corresponding color: upward red arrows suggest opening a buy, green down arrows - selling. The entrance is supposed to be at the next bar after the pointer. The arrow indicator Trend Bilio visually "unloads" the price chart and saves time for analysis: no signal - no deal, if an opposite signal appears, then the current deal should be closed. It is Trend Bilio that is considered
The Super Arrow Indicator provides non-repainting buy and sell signals with exceptional accuracy. Key Features No repainting – confirmed signals remain fixed Clear visual arrows: green for buy, red for sell Real-time alerts via pop-up, sound, and optional email Clean chart view with no unnecessary clutter Works on all markets: Forex, gold, oil, indices, crypto Adjustable Parameters TimeFrame Default: "current time frame" Function: Sets the time frame for indicator calculation Options: Can be set
Alpha Trend sign has been a very popular trading tool in our company for a long time. It can verify our trading system and clearly indicate trading signals, and the signals will not drift. Main functions: Based on the market display of active areas, indicators can be used to intuitively determine whether the current market trend belongs to a trend market or a volatile market. And enter the market according to the indicator arrows, with green arrows indicating buy and red arrows indicating se
Be notified of every color change of Heiken Ashi (HA) candles. The indicator will trigger past and new signals every time that HA candles change their colors. Note : this tool is based on the code of Heiken Ashi indicator developed by MetaQuotes Software Corp. Features The signals are triggered at closing of last bar/opening of a new bar; Any kind of alerts can be enabled: Dialog Box, Email message, SMS notifications for smartphones and tablets, and Sound alerts; By default, up arrows are plott
This is a mini One pair version of Advanced Detector of Trend Reversal and Continuance known as TrueTrendStarM(TTSm25). It is a sensitive and Predictive indicator of Price Trends for Professional traders.  ( ATTENTION BUYERS:-Now the indicator is available for UNLIMITED TIME ONE TIME buy of just $500 ). Avail the Opportunity.    It detects high odds changes in Price Trend direction long before other indicator detects it. I have been working on it since 2019.    This is possible due to fractal
M5 Scalperin
Andrey Kozak
M5 Scalperin – Professional Intraday Scalping System for MetaTrader 4 M5 Scalperin is a professional scalping indicator designed for intraday trading on the Forex market . The system automatically identifies optimal entry points and displays clear buy and sell arrows directly on the chart , allowing traders to quickly react to short-term market movements. The indicator is optimized for high-probability pullback entries within a strong trend , helping traders capture fast profits in active market
Binary Gap
Teresinha Moraes Correia
A gap is a space on the chart between two consecutive candlesticks where no trading occurred between the close of one candle and the open of the next. In the Forex market, gaps mainly appear at the weekly open, reflecting events or expectations from the weekend. Technically, a gap may indicate an imbalance between supply and demand. Strategies use gaps as signals of possible trend continuation or reversal, offering opportunities for technical analysis based on liquidity and momentum.
This is a signal that mainly diagnoses the current direction based on data analysis, price breakout algorithms, and strategies based on some major indicators. This signal will display all the signals from a historical period on the main chart and is a good choice if you like to show the direction of the signals on the chart. Advantage: Suitable for all breeds. Applies to all cycles. Only one adjustable parameter, easy to use. Notice: This signal only provides all the most probable signals, and u
Quantina Bitcoin Indicator
Quantina Intelligence Limited
Features: Generates BUY / SELL Signals for easy to use: You do not need to read or understand market trend lines on indicators. Quantina Bitcoin Indicator shows a little Red Arrow for SELL and a little Green Arrow for the BUY entry points above- and under - the actual bars. (Green = Bullish Trend , Red = Bearish Trend). Measured Signal Strength also has written on the chart for advanced traders. Working on every known currency pairs: It's working on major-, minor-, and cross - pairs too. Also, Q
Volume Compair
Thiago Pereira Pinho
Professional Cumulative Delta & Volume Median Indicator Track   real buying/selling pressure   with this powerful volume analysis tool. The   Volume Compare Indicator   combines   Cumulative Delta   and   Volume Medians   to help you identify institutional activity, imbalances, and potential reversals. Key Features: Cumulative Delta Histogram   – Visualizes net buying vs. selling volume in real-time. Buy/Sell Volume Medians   – Horizontal lines showing average buy & sell volume levels. Smart Vo
"다이나믹 스캘핑 오실레이터"는 MT4를 위한 고급 맞춤형 암호화폐/외환 지표이자 효율적인 트레이딩 도구입니다! - 차세대 오실레이터 - 사용 방법은 그림을 참조하세요. - 다이나믹 스캘핑 오실레이터는 적응형 과매도/과매수 영역을 제공합니다. - 오실레이터는 동적인 과매도/과매수 영역에서 정확한 진입 시점을 찾는 보조 도구입니다. - 과매도 값: 녹색선 아래, 과매수 값: 주황색선 위. - 이 지표는 가격 변동 패턴과도 결합하기 좋습니다. - 일반 오실레이터보다 훨씬 정확합니다. 적합한 시간대: M30, H1, H4, D1, W1. - PC 및 모바일 알림 기능 제공. .......................................................................... 여기를 클릭하여 고품질 트레이딩 로봇과 지표를 확인하세요! MQL5 웹사이트에서만 제공되는 오리지널 제품입니다.
Donchian Time Sync Analyzer는   기존 Donchian 채널 분석에 강력한   다중 시간대   기능을 추가하여 트레이더가 다섯 가지 차트 기간에 걸쳐   추세 강도   와 잠재적   반전 신호를   동시에 모니터링할 수 있도록 합니다. 이 고급 지표는 선택한 시간대의 최고가와 최저가를 계산하여 여러 시간대에 걸쳐 추세 방향의 수렴을 파악하는 데 도움이 되는   명확한 시각적 신호를   생성합니다. 분 단위부터 시간 단위까지 통합된 분석을 제공함으로써 단일 시간대 도구보다 더 심층적인 시장 통찰력을 제공하여 트레이더가   중요한 돌파를 확인   하고 시간대 확인을 통해   잘못된 신호를 피할 수 있도록   지원합니다. 핵심 기능 이 정교한 도구는 검증된   돈키안 채널 전략을   여러 시간대에 걸쳐 동시에 적용하여 단기 가격 변동이 장기 추세와 일치하는지 여부를 보여주는 동기화된 신호를 표시합니다. 이 시스템은 선택한 시간대에서 가격이 중요한 지지선 또는 저항선
Happy Scalping Indicator
Leandro Bernardez Camero
이 지표는 공격적인 스캘핑 과 바이너리 옵션에서 빠른 진입 을 위해 설계되었습니다 , 각 캔들 마다 신호를 생성하여 언제든지 무엇이 일어나고 있는지 정확히 알 수 있습니다. Happy Scalping 채널에 가입하세요: MQL5 재작성 없음 : 현재 캔들의 신호는 실시간 으로 생성됩니다. 이는 캔들이 아직 형성 중일 때 가격이 이전 캔들의 종가에 비해 상승하거나 하락하는지에 따라 신호가 변경될 수 있음을 의미합니다. 그러나 캔들이 닫히면 , 신호의 색상은 완전히 고정됩니다 . 변경되지 않으며, 사라지지 않고, 이동하지 않습니다. 보이는 그대로 남습니다. 왜 이렇게 설계되었나요? 많은 스캘퍼들은 특히 가격의 돌파나 급격한 움직임 이 있을 때 즉시 신호를 받는 것을 선호합니다. 이를 통해 그런 빠른 피프스를 바로잡을 수 있습니다. 반면, 일부 트레이더는 닫힌 캔들로 확인을 기다리는 것 을 선호하며, 이 지표는 그들도 완벽하게 사용할 수 있습니다. 두 가지 접근 방식 모두 유효합니
Market voleum profile
Israr Hussain Shah
Description The Market Profile & Volume Profile Indicator is a powerful technical analysis tool designed to visualize market activity and price distribution over specific timeframes. Unlike standard technical indicators that focus solely on price over time, this indicator organizes price data to show where the market spent the most time (TPO) and where the most volume was traded (Volume Profile). It automatically calculates and displays key structural levels such as the Point of Control (POC) ,
Simply The Best Pro
Szymon Palczynski
5 (1)
This indicator displays the histogram and arrows on chart. When Simple The Best Pro are placed on a chart, they identify the trend.  The color of may be blue or red. The blue color stands for upside moves and the red color stands for downside trends. The indicator offers to set Stop Loss (SL) and  Take Profit (TP)  setting. The default value is ATR. Indicator has automatic optimization. The STB is a unique indicator that shows the tendency (button Bars) of a particular signals. The STB tells us
EZZ Zig Zag MT4
Paulo Rocha
5 (1)
EZZ Elite Zig Zag is an indicator for the MetaTrader 4 terminal. This indicator traces the peak of the trend based on the market reversal, thus showing various opportunities in the financial market. EZZ Elite Zig Zag is a visual tool, intuitive, and easy to understand and use.  Test it Yourself by Downloading it for Free. Author Paulo Rocha all rights reserved
Signal From Level
Yaroslav Varankin
Binary Options Support Resistance Indicator This indicator is designed for binary options trading and effectively shows retracements from support and resistance levels. Signals appear on the current candle. A red arrow pointing downwards indicates a potential selling opportunity, while a blue arrow pointing upwards suggests buying opportunities. All that needs adjustment is the color of the signal arrows. It is recommended to use it on the M1-M5 timeframes as signals are frequent on these timef
VR Cub
Vladimir Pastushak
VR Cub 은 고품질 진입점을 얻는 지표입니다. 이 지표는 수학적 계산을 용이하게 하고 포지션 진입점 검색을 단순화하기 위해 개발되었습니다. 지표가 작성된 거래 전략은 수년 동안 그 효율성을 입증해 왔습니다. 거래 전략의 단순성은 초보 거래자라도 성공적으로 거래할 수 있다는 큰 장점입니다. VR Cub은 포지션 개시 지점과 이익 실현 및 손절매 목표 수준을 계산하여 효율성과 사용 편의성을 크게 높입니다. 간단한 거래 규칙을 이해하려면 아래 전략을 사용한 거래 스크린샷을 살펴보세요. 설정, 세트 파일, 데모 버전, 지침, 문제 해결 등은 다음에서 얻을 수 있습니다. [블로그] 다음에서 리뷰를 읽거나 작성할 수 있습니다. [링크] 버전 [MetaTrader 5] 진입점 계산 규칙 포지션 개설 진입점을 계산하려면 VR Cub 도구를 마지막 최고점에서 마지막 최저점까지 늘려야 합니다. 첫 번째 지점이 두 번째 지점보다 빠른 경우, 거래자는 막대가 중간선 위에서 마감될 때까지 기다립니다
EARLY REMINDER: The Starting price is 65 price will rise soon up to 365$ and then 750$ after first 10 copies of sales. Grab this offer now! Introduction Hello, traders! Welcome to the demonstration of the Forex Beast Indicator , a comprehensive tool designed to assist aspiring traders in navigating the complexities of the forex market. This indicator incorporates seven essential components to provide a well-rounded trading experience: Moving Averages Colored Zones Support and Resistance Levels
DualVWAP
Kourosh Hossein Davallou
Dual Timeframe VWAP Indicator for MT4  Description Professional VWAP indicator that displays both **Daily** and **Weekly** VWAP simultaneously on your chart.   Features: - Dual VWAP Lines: Blue for Daily, Red for Weekly - Configurable Bands: Two deviation bands for each timeframe - Session Control: Customizable trading hours for Daily VWAP - Clean Visuals: Solid lines for main VWAP, dashed for bands - Optimizable: Parameters can be optimized using Genetic Algorithm Key Settings: - Enable/di
Title : Market Bias Indicator - Oscillator-Based Trading Tool Introduction : Discover the potential of the "Market Bias Indicator," a revolutionary oscillator-based trading tool designed for precise market analysis. If you're in search of a robust alternative to traditional bias indicators, your quest ends here. Market Bias Indicator offers unparalleled accuracy in identifying market sentiment and is your gateway to confident trading decisions. Recommended Trading Pairs : Market Bias Indicator i
Scalping trader full - full version of the scalping indicator for intraday trading. This indicator analyzes the state of the market and shows the trader with arrows when to open orders and in which direction. When the arrow appears, open an order in the direction of the arrow. We set take profit at the minimum distance (about 10 pips + spread). Stoploss is an indicator signal in the opposite direction. Indicator advantages: shows signals on the chart when to open orders. shows in which directi
Blahtech Market Profile
Blahtech Limited
4.53 (15)
Was: $249  Now: $99   Market Profile defines a number of day types that can help the trader to determine market behaviour. A key feature is the Value Area, representing the range of price action where 70% of trading took place. Understanding the Value Area can give traders valuable insight into market direction and establish the higher odds trade. It is an excellent addition to any system you may be using. Blahtech Limited presents their Market Profile indicator for the MetaTrader community. Ins
This is a new strategy for SUPPLY DEMAND areas It is based on a calculation using the tick volume to detect the big price action in market for both bear /bull actions this smart volume action candles are used to determine the supply and demand areas prices in between main supply and demand lines indicate sideway market  up arrows will be shown when prices moves above the main supply and the secondary supply lines Down arrows will be shown when prices moves below the main demand and the secondary
Infinity Trend Pro
Yaroslav Varankin
1 (1)
This is a trend indicator without redrawing Developed instead of the binary options strategy (by the color of the Martingale candlestick) Also works well in forex trading When to open trades (binary options) A signal will appear in the place with a candle signaling the current candle It is recommended to open a deal for one candle of the current timeframe M1 and M5 When a blue dot appears, open a deal up When a red dot appears, open a trade down. How to open trades on Forex. When a signal is rec
이 제품의 구매자들이 또한 구매함
Gann Made Easy
Oleg Rodin
4.83 (160)
Gann Made Easy 는 mr.의 이론을 사용하여 최고의 거래 원칙을 기반으로 하는 전문적이고 사용하기 쉬운 Forex 거래 시스템입니다. W.D. 간. 이 표시기는 Stop Loss 및 Take Profit Levels를 포함하여 정확한 BUY 및 SELL 신호를 제공합니다. PUSH 알림을 사용하여 이동 중에도 거래할 수 있습니다. 구매 후 거래 방법 안내 및 유용한 추가 지표를 무료로 받으시려면 저에게 연락주세요! 아마도 Gann 거래 방법에 대해 이미 여러 번 들었을 것입니다. 일반적으로 Gann의 이론은 초보자 거래자뿐만 아니라 이미 거래 경험이 있는 사람들에게도 매우 복잡한 것입니다. Gann의 거래 방식은 이론적으로 적용하기 쉽지 않기 때문입니다. 나는 그 지식을 연마하고 Forex 지표에 최고의 원칙을 적용하기 위해 몇 년을 보냈습니다. 표시기는 적용하기가 매우 쉽습니다. 차트에 첨부하고 간단한 거래 권장 사항을 따르기만 하면 됩니다. 지표는 지속적으로 시장 분석
M1 Sniper
Oleg Rodin
5 (21)
M1 SNIPER 는 사용하기 쉬운 거래 지표 시스템입니다. M1 시간대에 맞춰 설계된 화살표 지표입니다. 이 지표는 M1 시간대 스캘핑을 위한 단독 시스템으로 사용할 수 있으며, 기존 거래 시스템의 일부로도 사용할 수 있습니다. 이 거래 시스템은 M1 시간대 거래용으로 특별히 설계되었지만, 다른 시간대에도 사용할 수 있습니다. 원래는 XAUUSD와 BTCUSD 거래를 위해 이 방법을 설계했지만, 다른 시장 거래에도 유용하다는 것을 알게 되었습니다. 이 지표의 신호는 추세 방향과 반대로 거래될 수 있습니다. 저는 지표의 신호를 활용하여 양방향으로 거래할 수 있도록 돕는 특별한 거래 기법을 알려드립니다. 이 방법은 특별한 동적 지지선과 저항선 가격 영역을 활용하는 것을 기반으로 합니다. 구매하시면 M1 SNIPER 화살표 지표를 바로 다운로드하실 수 있습니다. 또한, 아래 스크린샷에 표시된 Apollo Dynamic SR 지표는 M1 SNIPER 도구를 사용하는 모든 사용자에게 무료로
Scalper Inside PRO
Alexey Minkov
4.74 (69)
12% OFF EASTER SALE An exclusive indicator that utilizes an innovative algorithm to swiftly and accurately determine the market trend. The indicator automatically calculates opening, closing, and profit levels, providing detailed trading statistics. With these features, you can choose the most appropriate trading instrument for the current market conditions. Additionally, you can easily integrate your own arrow indicators into Scalper Inside Pro to quickly evaluate their statistics and profitabi
Market Makers
Mohamed Hassan
5 (3)
After purchase, contact me privately to receive 1 month of free testing with EA Forex Proton! This advanced MT4 trading robot automatically executes signals from any MT4 indicator, including Market Makers. The latest version also includes AI integration, allowing each trade signal to be analyzed using Artificial Intelligence. Live Signal with EA Forex Proton: Click here Market Makers is a powerful price action trading system designed to identify high-probability Buy and Sell opportunities based
Trend Screener
STE S.S.COMPANY
4.79 (95)
트렌드 표시기, 트렌드 트레이딩 및 필터링을 위한 획기적인 고유 솔루션, 하나의 도구 안에 내장된 모든 중요한 트렌드 기능! Forex, 상품, 암호 화폐, 지수 및 주식과 같은 모든 기호/도구에 사용할 수 있는 100% 다시 칠하지 않는 다중 시간 프레임 및 다중 통화 표시기입니다. 기간 한정 특가: 지원 및 저항 스크리너 지표는 단 100달러에 평생 제공됩니다. (원래 가격 50 달러) (제안 연장) Trend Screener는 차트에 점이 있는 화살표 추세 신호를 제공하는 효율적인 지표 추세 추종 지표입니다. 추세 분석기 표시기에서 사용할 수 있는 기능: 1. 트렌드 스캐너. 2. 최대 이익 분석이 있는 추세선. 3. 추세 통화 강도 측정기. 4. 경고가 있는 추세 반전 점. 5. 경고가 있는 강력한 추세 점. 6. 추세 화살표 Trend Screener Indicator가 있는 일일 분석 예, 일일 신호 성능...등은 여기에서 찾을 수 있습니다.   여기를 클릭하십시오. L
Atomic Analyst
Issam Kassas
5 (5)
우선적으로 언급할 점은이 거래 지표가 다시 그리지 않고 지연되지 않으며 이를 통해 수동 및 로봇 거래 모두에 이상적이라는 점입니다. 사용자 매뉴얼: 설정, 입력 및 전략. Atomic Analyst는 가격의 강도와 모멘텀을 활용하여 시장에서 더 나은 이점을 찾는 PA Price Action Indicator입니다. 고급 필터를 장착하여 잡음과 거짓 신호를 제거하고 거래 잠재력을 높이는 데 도움이 됩니다. 복잡한 지표의 다중 레이어를 사용하여 Atomic Analyst는 차트를 스캔하고 복잡한 수학적 계산을 간단한 신호와 색상으로 변환하여 초보 트레이더가 이해하고 일관된 거래 결정을 내릴 수 있도록합니다. "Atomic Analyst"는 새로운 및 경험이 풍부한 트레이더를위한 종합적인 거래 솔루션입니다. 프리미엄 지표와 최고 수준의 기능을 하나의 거래 전략에 결합하여 모든 종류의 트레이더에 대한 다재다능한 선택지가되었습니다. 인트라데이 거래 및 스캘핑 전략 : 빠르고 정확한 일일
Ultimate Sniper Dashboard
Hispraise Chinedum Abraham
4.82 (22)
299달러로 할인! 추후 가격이 인상될 수 있습니다! 아래 설명을 읽어보세요! Ultimate Sniper Dashboard를 위한 최고의 엔트리 시스템: ULTIMATE DYNAMIC LEVELS. (내 제품을 확인하십시오) Ultimate Sniper Dashboard는 MT4 다중 통화 테스트 제한으로 인해 라이브 시장에서만 작동합니다. Ultimate-Sniper 대시보드를 소개합니다! HA-Sniper와 MA-Sniper를 모두 포함하는 최고의 제품입니다. 그리고 많은 특수 모드. Ultimate Sniper Dashboard는 절대 야수입니다! 초보자 또는 전문가 트레이더를 위한 최고의 솔루션! 다시 움직임을 놓치지 마세요! 단순함과 핍을 좋아하는 트레이더를 위해 특별한 제품을 준비했습니다. 본질적으로 단순한 대시보드는 여러 사용자 지정 알고리즘을 기반으로 28개의 통화 쌍을 살펴보는 모든 작업을 수행합니다. 단 하나의 차트로 전문가처럼 시장을 읽을 수 있습니다. 움직이기
Super Signal – Skyblade Edition 전문가용 노리페인트 / 노래그 트렌드 신호 시스템, 뛰어난 승률 제공 | MT4 / MT5용 1분, 5분, 15분과 같은 낮은 타임프레임에서 가장 좋은 성능을 보입니다. 핵심 기능: Super Signal – Skyblade Edition은 추세 매매를 위해 설계된 스마트 신호 시스템입니다. 이 시스템은 다중 필터 로직을 활용하여, 명확한 방향성과 실질적인 모멘텀이 수반된 고품질 추세만을 감지합니다. 이 시스템은 고점 또는 저점을 예측하지 않으며 , 다음 세 가지 조건이 모두 충족될 때만 신호를 발생시킵니다: 명확한 추세 방향 강화되는 모멘텀 건전한 변동성 구조 또한, 시장 세션 기반의 유동성 분석을 통해 신호의 신뢰성과 타이밍을 더욱 향상시킵니다. 신호 특성: 모든 화살표 신호는 100% 리페인트 없음 / 지연 없음 신호가 한 번 발생하면 고정되며, 깜빡이거나 사라지지 않음 차트 상의 시각적 화살표, 정보 패널, 팝업 알
ON Trade Waves Patterns Harmonic Elliot Wolfe를 소개합니다. 이는 수동 및 자동 방법을 사용하여 다양한 시장 패턴을 감지하기 위해 개발된 고급 지표입니다. 다음은 그 작동 방식입니다: 조화적 패턴: 이 지표는 차트에 나타나는 조화적 패턴을 식별할 수 있습니다. 이러한 패턴은 Scott Carney의 "Harmonic Trading vol 1 및 2"에서 설명한 것처럼 조화적 거래 이론을 연습하는 트레이더에게 중요합니다. 수동으로 그리든 자동 감지를 사용하든 ON Trade Waves Patterns가 도움을 줄 것입니다. 컨트롤 패널: 이 지표에는 사용자 친화적인 컨트롤 패널이 있습니다. 차트 및 시간 프레임 설정을 저장하여 다양한 구성 간에 쉽게 전환할 수 있습니다. 차트 공간을 최대화하려면 최소화할 수도 있습니다. 다른 분석 도구를 사용하는 것을 선호하는 경우 닫기 버튼을 클릭하여 모든 지표 데이터를 숨길 수 있습니다. 템플릿 저장: 설정을 사
Dynamic Scalper System
Vitalyi Belyh
5 (1)
" Dynamic Scalper System " 지표는 추세 파동 내에서 스캘핑 방식으로 거래하도록 설계되었습니다. 주요 통화쌍 및 금에서 테스트되었으며, 다른 거래 상품과의 호환성이 가능합니다. 추가적인 가격 변동 지원을 통해 추세에 따라 단기 포지션 진입 신호를 제공합니다. 지표의 원리 큰 화살표는 추세 방향을 결정합니다. 작은 화살표 형태의 스캘핑 신호를 생성하는 알고리즘은 추세 파동 내에서 작동합니다. 빨간색 화살표는 상승 방향을, 파란색 화살표는 하락 방향을 나타냅니다. 민감한 가격 변동선은 추세 방향으로 그려지며, 작은 화살표의 신호와 함께 작용합니다. 신호는 다음과 같이 작동합니다. 적절한 시점에 선이 나타나면 진입 신호가 형성되고, 선이 있는 동안 미결제 포지션을 유지하며, 완료되면 거래를 종료합니다. 권장되는 작업 시간대는 M1~H4입니다. 화살표는 현재 캔들에 형성되며, 다음 캔들이 이미 시작되었더라도 이전 캔들의 화살표는 다시 그려지지 않습니다. 입력 매개
PRO Renko System
Oleg Rodin
5 (30)
PRO Renko System 은 RENKO 차트 거래를 위해 특별히 고안된 매우 정확한 거래 시스템입니다. 이것은 다양한 거래 상품에 적용될 수있는 보편적 인 시스템입니다. 체계는 효과적으로 당신에게 정확한 반전 신호에 접근을 주는 소위 시장 소음을 중화합니다. 이 표시기는 사용하기가 매우 쉽고 신호 생성을 담당하는 매개 변수가 하나만 있습니다. 당신은 쉽게 당신의 선택의 어떤 무역 계기에 공구를 적응시킬 수 있고 renko 막대기의 크기. 나는 항상 당신이 내 소프트웨어로 수익성있게 거래 할 수 있도록 추가 지원을 제공 할 준비가되어 있습니다! 나는 당신에게 행복하고 수익성있는 거래를 기원합니다! 구매 후 저에게 연락하십시오! 내 렌코 차트 생성기를 보내드립니다. 또한 내 개인 권장 사항 및 시스템의 다른 모듈을 무료로 공유 할 것입니다!
TPSpro RFI Levels
Roman Podpora
4.86 (28)
러시아어 설명서  /  영어   설명서  /  MT5 버전 주요 기능: 판매자와 구매자의 활동 영역을 표시합니다! 이 지표는 매수 및 매도에 대한 모든 올바른 첫 번째 임펄스 레벨/존을 표시합니다. 진입점 검색이 시작되는 이러한 레벨/존이 활성화되면 레벨의 색상이 바뀌고 특정 색상으로 채워집니다. 상황을 더욱 직관적으로 파악할 수 있도록 화살표도 표시됩니다. LOGIC AI - 템플릿 활성화 시 진입점 검색을 위한 영역(원) 표시 시각적 명확성을 개선하기 위해 인공지능을 사용하여 진입점을 검색한 영역을 표시하는 기능이 추가되었습니다. 더 높은 시간대의 레벨/존 표시(MTF 모드) 더 높은 시간 간격을 사용하여 레벨/존을 표시하는 기능이 추가되었습니다. 또한, 이 지표는 자동 추세 감지 기능(   TPSproTREND PRO   )을 구현했습니다. 거래를 위한 별도의 전문적인 단계별 알고리즘 이 알고리즘은 추세 방향과 반대 방향으로의 당일 거래 모두에 적합하도록 설계되었습니다. 각
BTMM State Engine Pro MT4
Garry James Goodchild
BTMM State Engine Pro is a MetaTrader 4 indicator for traders who use the Beat The Market Maker approach: Asian session context, kill zone timing, level progression, peak formation detection, and a multi-pair scanner from a single chart. It combines cycle state logic with a built-in scanner dashboard so you do not need the same tool on many charts at once. What it does Draws the Asian session range; session times can follow broker server offset or be set in inputs. Tracks level progression (L
Advanced Currency Strength28 Indicator
Bernhard Schweigert
4.91 (657)
현재 40% 할인 초보자 또는 전문가 트레이더를 위한 최고의 솔루션! 이 지표는 우리가 독점 기능과 새로운 공식을 통합했기 때문에 독특하고 고품질이며 저렴한 거래 도구입니다. 단 하나의 차트로 28 Forex 쌍의 통화 강도를 읽을 수 있습니다! 새로운 추세 또는 스캘핑 기회의 정확한 트리거 포인트를 정확히 찾아낼 수 있기 때문에 거래가 어떻게 개선될지 상상해 보십시오. 사용 설명서: 여기를 클릭  https://www.mql5.com/en/blogs/post/697384 그것이 첫 번째, 원본입니다! 쓸모없는 지망생 클론을 사지 마십시오. 더 스페셜  강력한 통화 모멘텀을 보여주는 하위 창의 화살표 GAP가 거래를 안내합니다! 기본 또는 호가 통화가 과매도/과매도 영역(외부 시장 피보나치 수준)에 있을 때 개별 차트의 기본 창에 경고 표시가 나타납니다. 통화 강도가 외부 범위에서 떨어질 때 풀백/반전 경고. 교차 패턴의 특별 경고 추세를 빠르게 볼 수 있는 다중 시간
Easy Breakout
Mohamed Hassan
4.71 (14)
After your purchase, feel free to contact me for more details on how to receive a bonus indicator called VFI, which pairs perfectly with Easy Breakout for enhanced confluence!    Easy Breakout is a powerful price action trading system built on one of the most popular and widely trusted strategies among traders: the Breakout strategy ! This indicator delivers crystal-clear Buy and Sell signals based on breakouts from key support and resistance zones. Unlike typical breakout indicators, it levera
Volatility Trend System - a trading system that gives signals for entries. The volatility system gives linear and point signals in the direction of the trend, as well as signals to exit it, without redrawing and delays. The trend indicator monitors the direction of the medium-term trend, shows the direction and its change. The signal indicator is based on changes in volatility and shows market entries. The indicator is equipped with several types of alerts. Can be applied to various trading ins
Trend Lines PRO
Roman Podpora
5 (1)
트렌드 라인즈 프로       이 지표는 시장이 실제로 어떤 방향으로 전환되는지 파악하는 데 도움이 됩니다. 실제 추세 반전 지점과 주요 시장 참여자들이 다시 진입하는 지점을 보여줍니다. 보시다시피       BOS 라인       복잡한 설정이나 불필요한 노이즈 없이 더 높은 시간대의 추세 변화와 주요 레벨을 확인할 수 있습니다. 신호는 차트에 다시 그려지지 않고 캔들이 마감된 후에도 계속 표시됩니다. VERSION MT 5   -   RFI LEVELS PRO   표시기   와 결합할 때 최대 잠재력을 발휘합니다. 지표가 보여주는 내용: 실제 변화       추세(BOS 라인) 한 번 신호가 나타나면 그 신호는 계속 유효합니다! 이는 신호를 발생시킨 후 변경될 수 있는 리페인팅 방식의 지표와 중요한 차이점입니다. 리페인팅 방식의 지표는 잠재적으로 자금 손실로 이어질 수 있습니다. 이제 더욱 높은 확률과 정확도로 시장에 진입할 수 있습니다. 또한 화살표가 나타난 후 목표가(익절)
GOLD Impulse with Alert
Bernhard Schweigert
4.67 (12)
이 지표는 Advanced Currency IMPULSE with ALERT  +   Currency Strength Exotics  의 2가지 제품의 슈퍼 조합입니다. 그것은 모든 시간 프레임에 대해 작동하며 8개의 주요 통화와 하나의 기호에 대한 강약의 충동을 그래픽으로 보여줍니다! 이 표시기는 금, 이국적인 쌍, 상품, 지수 또는 선물과 같은 기호에 대한 통화 강도 가속을 표시하는 데 특화되어 있습니다. 금, 은, 오일, DAX, US30, MXN, TRY, CNH 등의 진정한 통화 강도 가속(충동 또는 속도)을 표시하기 위해 9번째 줄에 모든 기호를 추가할 수 있습니다. 새로운 기본 알고리즘을 기반으로 구축되어 잠재적인 거래를 훨씬 더 쉽게 식별하고 확인할 수 있습니다. 이는 통화의 강세 또는 약세가 가속되는지 여부를 그래픽으로 표시하고 가속 속도를 측정하기 때문입니다. 자동차의 속도계처럼 생각하면 됩니다. 가속화할 때 Forex 시장에서 동일한 일이 분명히 더 빠르
Order Block Hunter
Noha Mohamed Fathy Younes Badr
5 (10)
Order block hunter indicator is the best indicator for  hunt the order blocks that area where there has been a large concentration of limit orders waiting to be executed Order blocks are identified on a chart by observing previous price action and looking for areas where the price experienced significant movement or sudden changes in direction .This indicator does that for you by using very complicated codes and helps you to take the best areas To buy and sell because it make marks at the best a
Advanced Supply Demand
Bernhard Schweigert
4.91 (299)
현재 40% 할인! 초보자나 전문 트레이더를 위한 최고의 솔루션! 이 보조지표는 우리가 다수의 독창적 기능과 새로운 공식을 통합한 독특하고 고품질이며 저렴한 거래 도구입니다. 이 업데이트를 통해 이중 시간대를 표시할 수 있습니다. 더 높은 TF를 표시할 수 있을 뿐만 아니라 차트 TF와 더 높은 TF 모두를 표시할 수 있습니다: 중첩 영역 표시. 모든 Supply Demand 트레이더들이 좋아할 것입니다. :) 중요한 정보 공개 Advanced Supply Demand의 잠재력을 극대화하려면 다음을 방문하십시오. https://www.mql5.com/ko/blogs/post/720245   진입 또는 목표의 명확한 트리거 포인트를 정확히 찾아냄으로 해서 거래가 어떻게 개선될지 상상해 보십시오. 새로운 알고리즘을 기반으로 매수자와 매도자 간의 잠재적인 불균형을 훨씬 더 쉽게 분간할 수 있습니다. 왜냐하면 가장 강한 공급영역과 가장 강한 수요 영역과 과거에 어떻게 진행 되었는지를(이전
- Real price is 80$ - 40% Discount (It is 49$ now) Contact me for instruction, add group and any questions! - Non-repaint - I just sell my products in Elif Kaya profile, any other websites are stolen old versions, So no any new updates or support. - Lifetime update free Related product:   Bitcoin Expert Introduction The breakout and retest strategy is traded support and resistance levels. it involves price breaking through a previous level.  The break and retest strategy is designed to help tr
KT Gaussian Trend Filter MT4
KEENBASE SOFTWARE SOLUTIONS
KT Gaussian Trend Filter는 가우시안 필터링과 선형 회귀 기반 스무딩을 결합하여 명확하고 정밀한 추세 분석을 제공합니다. 간단한 매수 및 매도 신호를 생성하며, 시장의 장기적 방향성을 효과적으로 강조합니다. 기능 완전한 사용자 설정이 가능한 가우시안 필터: 필터의 길이와 극값을 조절하여 스무딩 강도와 추세 선명도를 세밀하게 조정할 수 있습니다. 선형 회귀 보정 기능: 가우시안 필터링 결과를 추가적으로 보정하여 시장 변동성에 따른 오탐지 신호를 최소화합니다. 다중 시간대 스캐너: 여러 시간대에서 가우시안 추세 방향을 자동으로 감지하고 직관적인 대시보드에 표시합니다. 트레일링 밴드 기능: 기존 추세 내에서 깊은 되돌림 구간의 진입 타이밍을 쉽게 파악할 수 있습니다. 색상 설정 사용자화: 트레이딩 스타일과 차트 레이아웃에 맞춰 인디케이터의 색상을 자유롭게 변경할 수 있습니다. 내장 알림 기능: 팝업, 이메일, 푸시 알림, 사운드 등을 통한 즉각적인 알림 수신이 가능합니
Special offer : ALL TOOLS , just $35 each! New tools   will be   $30   for the   first week   or the   first 3 purchases !  Trading Tools Channel on MQL5 : Join my MQL5 channel to update the latest news from me 다중 시간 프레임의 체적 주문 블록 지표는 주요 시장 참가자들이 주문을 축적하는 중요한 가격 영역을 식별하여 시장 행동에 대한 더 깊은 통찰을 원하는 트레이더들을 위해 설계된 강력한 도구입니다. 이 영역들은 체적 주문 블록으로 알려져 있으며, 잠재적 지지 및 저항 구역으로 작용해 정보에 입각한 거래 결정에 중요한 이점을 제공합니다. MT5 버전 보기:   Volumetric Order Blocks MT5 Multi Timeframe See more products at:   https://www.mql5.com
Route Lines Prices - 은 가격 방향을 찾는 데 사용되는 지표입니다. 간단한 인터페이스에는 가격 움직임 및 미래 방향 계산을 위한 다양한 알고리즘이 포함되어 있습니다. 이러한 알고리즘에는 사용된 시간대에 따른 변동성 계산 및 가격 평활화 기능이 있습니다. 이 지표는 " Calculating price values " 값을 변경하는 단일 매개변수를 제공합니다. 기본값인 1은 균형 잡힌 자동 계산을 제공하며, 별도의 설정 없이 바로 사용할 수 있습니다. 2에서 500 사이의 값을 수동으로 변경하여 자신만의 거래 시스템에 맞게 지표를 맞춤 설정할 수 있습니다. 이 지표는 M1부터 H4까지의 시간대에서 사용을 권장합니다. 모든 거래 상품에 적용 가능합니다. 신호 화살표는 캔들 종가에 생성되며, 과거 차트에는 다시 그려지지 않습니다. 메인 차트에 동일한 화살표가 표시됩니다. 다양한 유형의 알림을 사용할 수 있으며, 내장된 라인 궤적 카운터는 종가를 기반으로 작동합니다. 이는
현재 40% 할인 ! 초보자 또는 전문가 트레이더를 위한 최고의 솔루션! 이 대시보드 소프트웨어는 28개의 통화 쌍에서 작동합니다. 2가지 주요 지표(Advanced Currency Strength 28 및 Advanced Currency Impulse)를 기반으로 합니다. 전체 Forex 시장에 대한 훌륭한 개요를 제공합니다. 고급 통화 강도 값, 통화 이동 속도 및 모든(9) 시간대의 28 Forex 쌍에 대한 신호를 보여줍니다. 추세 및/또는 스캘핑 기회를 정확히 파악하기 위해 차트의 단일 지표를 사용하여 전체 시장을 볼 수 있을 때 거래가 어떻게 개선될지 상상해 보십시오! 잠재적인 거래를 식별하고 확인하면서 강력한 통화와 약한 통화를 더욱 쉽게 식별할 수 있도록 이 지표에 기능을 내장했습니다. 이 표시기는 통화의 강세 또는 약세가 증가 또는 감소하는지 여부와 모든 시간대에서 수행되는 방식을 그래픽으로 보여줍니다. 추가된 새로운 기능은 현재 시장 조건 변화에 적응하는
Stratos Pali
Michela Russo
4.43 (7)
Stratos Pali Indicator   is a revolutionary tool designed to enhance your trading strategy by accurately identifying market trends. This sophisticated indicator uses a unique algorithm to generate a complete histogram, which records when the trend is Long or Short. When a trend reversal occurs, an arrow appears, indicating the new direction of the trend. Important Information Revealed Leave a review and contact me via mql5 message to receive My Top 5 set files for Stratos Pali at no cost! Dow
Scalper Vault
Oleg Rodin
5 (36)
Scalper Vault 는 성공적인 스캘핑에 필요한 모든 것을 제공하는 전문 스캘핑 시스템입니다. 이 표시기는 외환 및 바이너리 옵션 거래자가 사용할 수 있는 완전한 거래 시스템입니다. 권장 시간 프레임은 M5입니다. 시스템은 추세 방향으로 정확한 화살표 신호를 제공합니다. 또한 상단 및 하단 신호와 Gann 시장 수준을 제공합니다.  이 시스템은 사용하기가 매우 쉽습니다. 원하는 시장 지역의 화살표만 따라가면 됩니다. 엑시트는 가격이 적정 수준에 도달하거나 시장의 고점 또는 저점 신호가 나타날 때 수행됩니다.  표시기는 PUSH 알림을 포함한 모든 유형의 경고를 제공합니다. 인디케이터 구매 후 연락주세요. 내 개인 거래 권장 사항과 훌륭한 보너스 지표를 무료로 공유합니다! 나는 당신에게 행복하고 유익한 거래를 기원합니다!
Dynamic Forex28 Navigator
Bernhard Schweigert
4.43 (7)
Dynamic Forex28 Navigator - 차세대 외환 거래 도구. 현재 49% 할인. Dynamic Forex28 Navigator는 오랫동안 인기 있는 지표의 진화형으로, 세 가지의 힘을 하나로 결합했습니다. 고급 통화 Strength28 지표(695개 리뷰) + 고급 통화 IMPULSE with ALERT(520개 리뷰) + CS28 콤보 신호(보너스). 지표에 대한 자세한 정보 https://www.mql5.com/en/blogs/post/758844 차세대 Strength 지표는 무엇을 제공합니까?  원래 지표에서 좋아했던 모든 것이 새로운 기능과 더 높은 정확도로 강화되었습니다. 주요 기능: 독점적인 통화 Strength 공식.  모든 시간대에 걸쳐 부드럽고 정확한 강도선. 추세와 정확한 진입을 식별하는 데 이상적입니다. 역동적인 시장 피보나치 수준(시장 피보나치).  이 지표에만 있는 고유한 기능. 가격 차트가 아닌 통화 강도에 피보나치가 적용됩니다.
Miraculous Indicator – Gann Square of Nine 기반 100% 비리페인트 Forex 및 바이너리 도구 이 영상은 Miraculous Indicator 를 소개합니다. 이 지표는 Forex 및 바이너리 옵션 트레이더를 위해 특별히 개발된 매우 정확하고 강력한 트레이딩 도구입니다. 이 지표가 독특한 이유는 전설적인 **Gann Square of Nine(Gann 9의 사각형)**과 **Gann's Law of Vibration(Gann 진동의 법칙)**에 기반을 두고 있기 때문입니다. 이는 현대 트레이딩에서 가장 정밀한 예측 도구 중 하나로 손꼽힙니다. Miraculous Indicator는 완전히 비리페인트(non-repaint) 됩니다. 즉, 캔들이 마감된 후에도 신호가 변경되거나 사라지지 않습니다. 보이는 것이 곧 결과입니다. 이는 트레이더가 자신감을 가지고 거래에 진입하고 청산할 수 있는 신뢰할 수 있고 일관된 기반을 제공합니다. 주요 특징: Gann
Currency Strength Exotics
Bernhard Schweigert
4.88 (33)
현재 20% 할인! 초보자 또는 전문가 트레이더를 위한 최고의 솔루션! 이 표시기는 Exotic Pairs Commodities, Indexes 또는 Futures와 같은 기호에 대한 통화 강도를 표시하는 데 특화되어 있습니다. 금, 은, 석유, DAX, US30, MXN, TRY, CNH 등의 진정한 통화 강도를 보여주기 위해 9번째 줄에 모든 기호를 추가할 수 있습니다. 이것은 독특하고 고품질이며 저렴한 거래 도구입니다. 우리는 많은 독점 기능과 새로운 공식을 통합했습니다. 새로운 추세 또는 스캘핑 기회의 정확한 트리거 포인트를 정확히 찾아낼 수 있기 때문에 거래가 어떻게 개선될지 상상해 보십시오. 사용 설명서: 여기를 클릭 https://www.mql5.com/en/blogs/post/708876 모든 시간대에 작동합니다. TREND를 빠르게 확인할 수 있습니다! 새로운 기본 알고리즘을 기반으로 설계되어 잠재적인 거래를 더욱 쉽게 식별하고 확인할 수 있습니다. 8개의
제작자의 제품 더 보기
Indicador Fimathe
Thiago Pereira Pinho
5 (4)
Fimathe Indicator The   Fimathe Indicator   is a tool for MetaTrader 5 designed to help traders identify support, resistance, neutral zones, and price channels. It features an interactive interface for drawing and managing support and resistance levels, generating take-profit channels and neutral zones, and providing visual and sound alerts for breakouts. Key Features Support and Resistance Lines: Dynamic and draggable lines to identify key levels. Reference Channel: Creates a channel between su
FREE
Fimathe Painel
Thiago Pereira Pinho
5 (1)
Fimathe 3.0: Your Intelligent EA for Trend Detection and Automated Trades! Discover the power of Fimathe (strategy created by Marcelo Ferreira), now with integrated automation for precise and profitable entries in MetaTrader 5. Designed for traders seeking efficiency, this Expert Advisor combines advanced trend analysis with an intuitive and customizable panel. Trade with confidence, minimize risks, and maximize gains! Key Features: Customizable Panel: Choose the size and position of the panel t
Sync
Thiago Pereira Pinho
5 (1)
**Sync MT5 – Real-Time Multi-Chart Analysis Manager** Transform your MT5 platform into a professional analysis workstation. Sync is a comprehensive tool that synchronizes charts, objects, and crosshairs across multiple windows, allowing you to trade with unprecedented precision and efficiency. **MAIN FEATURES** 1. **Smart Chart Synchronization**    - Synchronize symbols and timeframes across multiple charts with one click.    - Group system – Organize your charts by strategy or asset.    - A
ADX Histogram Indicator
Thiago Pereira Pinho
The   ADX  Histogram   is a modern and visual upgrade of the classic   Average Directional Index (ADX) . It transforms the standard ADX and DI+ / DI– values into a   color-coded histogram , making trend analysis much clearer and faster.  Key Features: Histogram with four states :  Blue = Normal Buy Trend Green = Strong Buy Trend  Orange = Normal Sell Trend  Red = Strong Sell Trend Automatic strength detection : uses the ADX line to separate “normal” vs. “strong” signals.  Fully customizable: ADX
FREE
The MarketProfileTPO indicator for MetaTrader 5 is a powerful tool designed to bring the Market Profile concept, based on Time Price Opportunity (TPO) analysis , directly onto your main chart window. This indicator calculates and displays the price distribution over a specified period, highlighting key areas of market activity and concentration. It is particularly optimized for high-volatility instruments like NAS100, US30, and XAUUSD when used on the M1 (1-minute) timeframe, offering a detailed
FREE
DTK Scalping Panel
Thiago Pereira Pinho
A powerful and intuitive trade management tool designed for scalpers and intraday traders. Created to complement the Nampim Samba Scalper strategy , it allows traders to open, manage, and close positions quickly without leaving the chart.  Key Features: Customizable trading panel – choose position (left, right, center, top, bottom). One-click trading buttons – instantly open Buy/Sell trades with pre-set lot sizes. Close management – close last 1/2/3 trades or all Buy/Sell positions with one clic
FREE
Price Compass
Thiago Pereira Pinho
프라이스 컴파스 는 금융 시장에서 추세 내비게이션 시스템 역할을 하도록 설계된 강력한 기술 분석 도구입니다. 이 지표는 시장의 평균적인 방향성 압력 을 평가하여 단기적인 노이즈를 효과적으로 걸러내고, 지배적인 움직임을 명확하게 식별합니다. 현재 가격이 '중앙 평균'에서 얼마나 벗어나 있는지 정량화하여, 시장 방향 에 대한 정확한 신호(강세, 약세 또는 중립)를 제공합니다. 해석 (나침반의 세 가지 상태) (Interpretação - Os Três Estados do Compass) 이 지표는 제로 라인 을 중심으로 별도의 보조 창에 표시되며, 현재 시장 상태를 알리기 위해 세 가지 다른 색상을 사용합니다: 나침반 상태 (Estado do Compass) 위치 (Localização) 신호 (Sinalização) 해석 (Interpretação) 북쪽 (강세) 제로 라인 위 긍정 (Positive) 시장이 강한 매수 압력 하에 있음을 나타냅니다. 상승 추세 의 시작 또는 지속을 시
FREE
Market Profile TPO MT4
Thiago Pereira Pinho
The   MarketProfileTPO   indicator for MetaTrader 5 is a powerful tool designed to bring the   Market Profile concept, based on Time Price Opportunity (TPO) analysis , directly onto your main chart window. This indicator calculates and displays the price distribution over a specified period, highlighting key areas of market activity and concentration. It is particularly optimized for   high-volatility instruments   like   NAS100, US30, and XAUUSD   when used on the M1 (1-minute) timeframe, offer
FREE
Keltner Channels Modern
Thiago Pereira Pinho
The Keltner Channel Pro is a modern and enhanced version of the classic Keltner Channel , designed for traders who want to identify trends, reversals, and overbought/oversold zones with greater accuracy.  Built with EMA (Exponential Moving Average) and ATR (Average True Range) , this indicator automatically adapts to market volatility, providing dynamic channels that help filter noise and improve trade timing.  Key Features: Main channel (upper, middle, and lower) based on EMA + ATR. Optional ad
FREE
The   Real Flow Defense Levels   indicator is a proprietary tool designed to identify and plot   significant, high-conviction price zones   directly onto your main trading chart. It uses a dynamic, volume-based analysis to determine where the market has previously demonstrated the   strongest defense or concentration of activity . These plotted lines serve as   dynamic support and resistance levels , highlighting the prices where major participants are most likely to enter or defend their positi
FREE
Real Flow Defense Levels
Thiago Pereira Pinho
The   Real Flow Defense Levels   indicator is a proprietary tool designed to identify and plot   significant, high-conviction price zones   directly onto your main trading chart. It uses a dynamic, volume-based analysis to determine where the market has previously demonstrated the   strongest defense or concentration of activity . These plotted lines serve as   dynamic support and resistance levels , highlighting the prices where major participants are most likely to enter or defend their positi
FREE
VForce Pro MT4
Thiago Pereira Pinho
5 (1)
**V-FORCE PRO - MetaTrader 5를 위한 고급 거래량 지표** **V-Force Pro로 실제 거래량의 힘을 발견하세요 - 시장 분석의 혁명!** **더 이상 어둠 속에서 거래하지 마세요! 실시간으로 대형 투자자들의 힘을 시각화하세요.** **모든 트레이더가 직면하는 문제:** 모든 기술적 지표가 같은 방향을 가리키는데도 왜 일부 시장 움직임은 실패할까요? 그 해답은 **실제 거래량**에 있습니다 - 대부분의 트레이더들이 간과하는 퍼즐의 가장 중요한 조각입니다! **V-Force Pro 5.3 - Speed Edition을 소개합니다** 단순한 히스토그램을 넘어서, 각 움직임 뒤에 숨겨진 **진정한 강도**를 드러내는 유일무이한 거래량 지표입니다! **독점적인 기능:** **1. 다단계 지배력 분석** *   **강력한 강세(진한 파랑):** 강한 확신을 가진 **매수** 거래량이 지배적 *   **약한 강세(연한 파랑):** 매수 압력은 있지만 주저함이
Volume Compair
Thiago Pereira Pinho
Professional Cumulative Delta & Volume Median Indicator Track   real buying/selling pressure   with this powerful volume analysis tool. The   Volume Compare Indicator   combines   Cumulative Delta   and   Volume Medians   to help you identify institutional activity, imbalances, and potential reversals. Key Features: Cumulative Delta Histogram   – Visualizes net buying vs. selling volume in real-time. Buy/Sell Volume Medians   – Horizontal lines showing average buy & sell volume levels. Smart Vo
Follow Line MT4
Thiago Pereira Pinho
Stop chasing the market. The Follow Line Indicator provides clear, high-probability signals right on your chart. This advanced tool features a Dynamic Trend Line that instantly adapts to market structure. It’s your immediate visual reference: Blue means you're in an uptrend, and Red signals a downtrend. The core function tracks price extremes and volatility to define the true trend strength. The best part is the automatic signal generation: Buy Arrow: Appears when the trend line flips from Red t
Volume Compair Indicator
Thiago Pereira Pinho
It allows traders to better understand the balance between buying and selling pressure, providing clear visual signals for potential reversals and breakouts .  Key Features:   Cumulative Delta Volume : separates buying and selling pressure in real time. Median Buy & Sell Volume lines : highlight equilibrium zones in order flow. Volume Velocity Factor : adjusts delta strength based on sudden volume changes. Smart MFI Alerts : automatic buy/sell arrows appear when Money Flow Index (MFI) reaches ov
VForce Pro
Thiago Pereira Pinho
**V-FORCE PRO - MetaTrader 5를 위한 고급 거래량 지표** **V-Force Pro로 실제 거래량의 힘을 발견하세요 - 시장 분석의 혁명!** **더 이상 어둠 속에서 거래하지 마세요! 실시간으로 대형 투자자들의 힘을 시각화하세요.** **모든 트레이더가 직면하는 문제:** 모든 기술적 지표가 같은 방향을 가리키는데도 왜 일부 시장 움직임은 실패할까요? 그 해답은 **실제 거래량**에 있습니다 - 대부분의 트레이더들이 간과하는 퍼즐의 가장 중요한 조각입니다! **V-Force Pro 5.3 - Speed Edition을 소개합니다** 단순한 히스토그램을 넘어서, 각 움직임 뒤에 숨겨진 **진정한 강도**를 드러내는 유일무이한 거래량 지표입니다! **독점적인 기능:** **1. 다단계 지배력 분석** *   **강력한 강세(진한 파랑):** 강한 확신을 가진 **매수** 거래량이 지배적 *   **약한 강세(연한 파랑):** 매수 압력은 있지만 주저함
CMF Scalping Indicator
Thiago Pereira Pinho
Dynamic CMF Calculation: Customize the period for the Chaikin Money Flow (CMF) to fine-tune your analysis and maximize signal precision. Intuitive Color-Coded Alerts: Instantly interpret market conditions with clear visual cues: Green Alert: Indicates the Overbought zone – signaling a potential selling opportunity. Red Alert: Indicates the Oversold zone – suggesting a potential buying opportunity. Gray Alert: Represents the Neutral zone – a signal to wait for a confirmed trend or reversal. Autom
Follow Line
Thiago Pereira Pinho
The Follow Line Indicator is an essential technical analysis tool that provides a clear, immediate visualization of the trend while detecting high-probability reversals in real-time. By combining adaptive price tracking with clear visual alerts, it transforms complex data into actionable trading signals. Key Features Dynamic Trend Line: Tracks the market's prevailing direction, automatically adjusting to each new price extreme. Clear Colors: The line turns Blue during uptrends and Red during dow
필터:
리뷰 없음
리뷰 답변