Robos
- 지표
-
Namu Makwembo
 I am a Fx Trader and computer programmer , I make trading systems and indicators be sure to check out my hot collection
 - 버전: 4.0
- 업데이트됨: 8 8월 2022
- 활성화: 11
Big promotion on the Robos, Get yours now
Robos Indicator
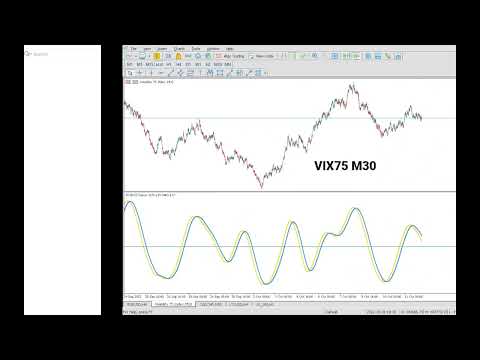
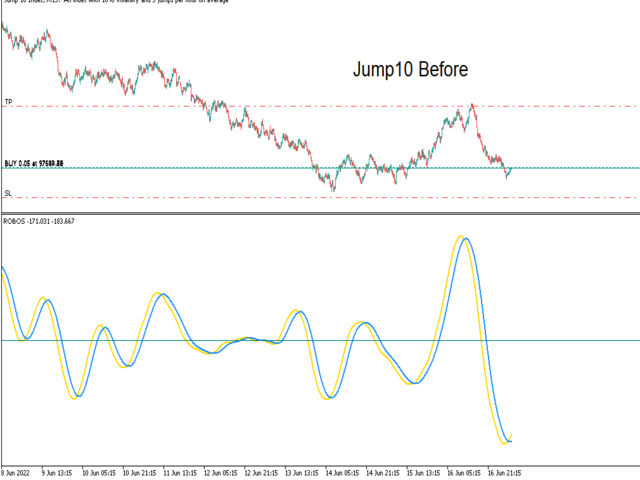
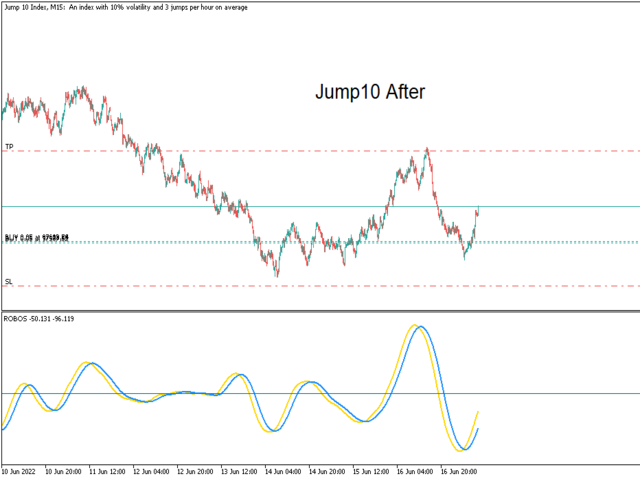
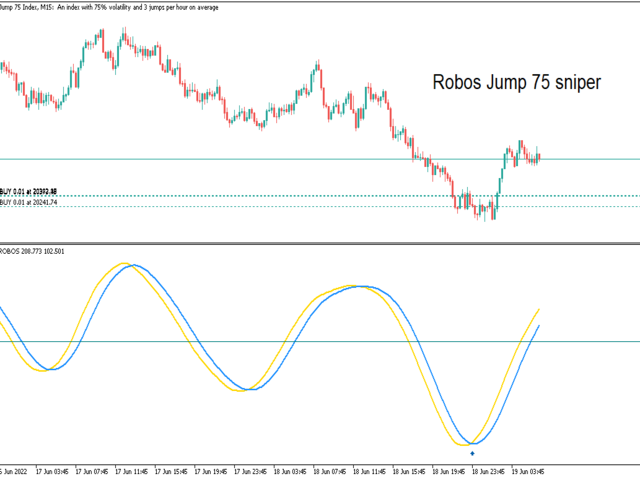
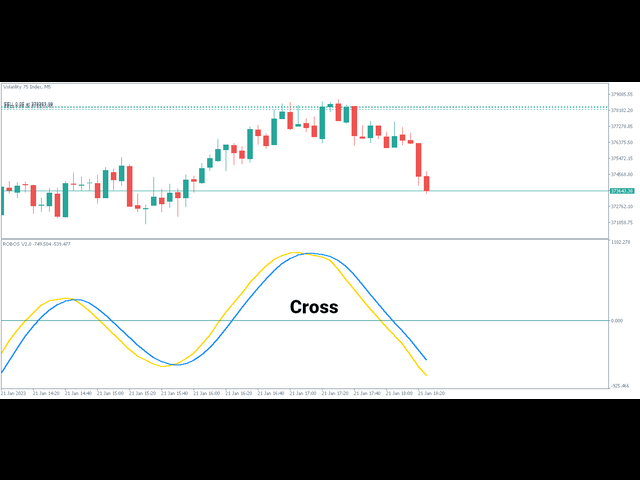
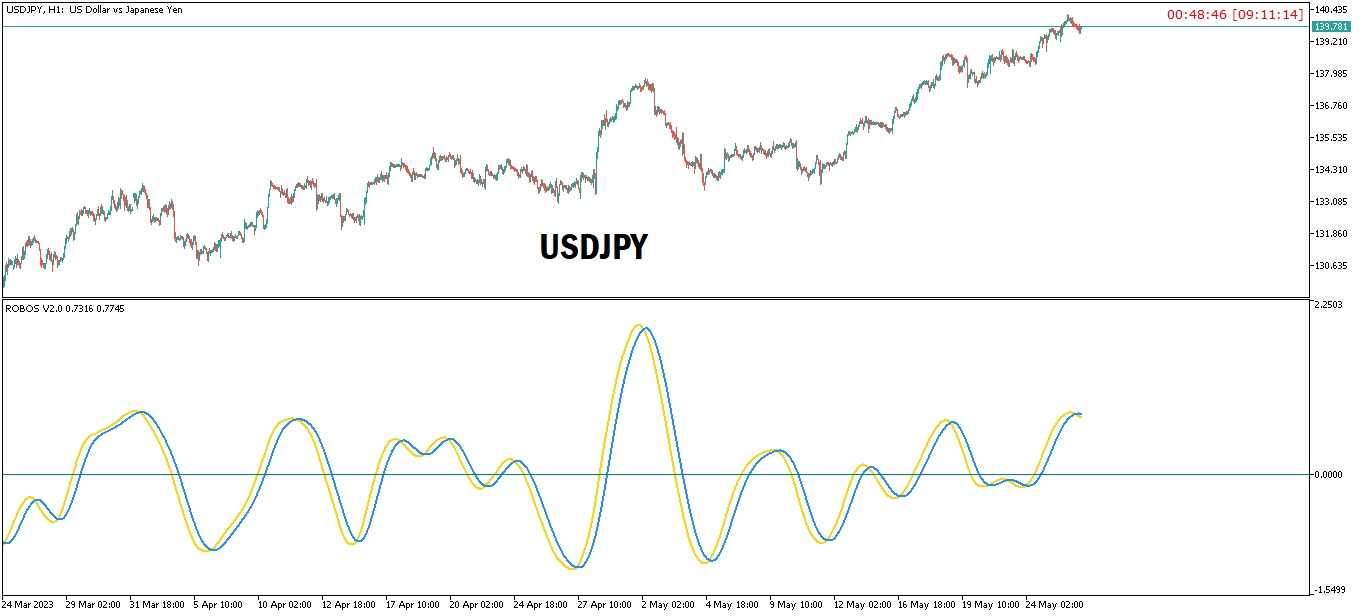
The ROBOS indicator is a multi timeframe oscillator that targets the overbought and oversold regions of a price chart, a signal is indicated by the two lines crossing, compatible with all tradable instruments
Latest Release
The latest release is the version 4.0
#What's new in version 4.0 ?
Features
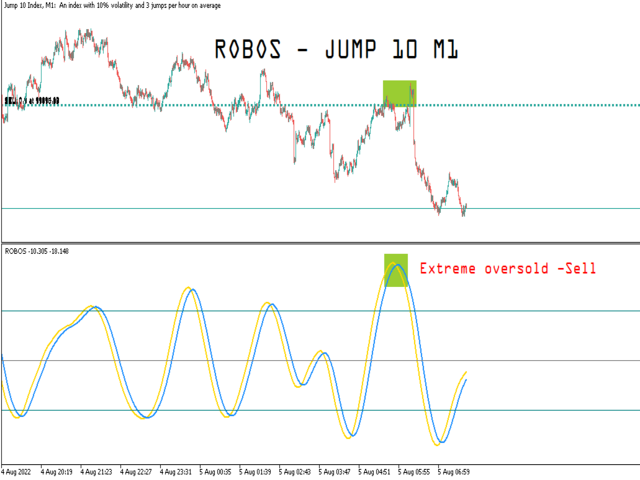
Extreme oversold and overbought levels
- ROBOS version 4.0 comes with cool new feature , the ability to target only extreme overbought & oversold prices , The new version also gives you the option to allow only extreme overbought or oversold signal alerts
#Input Parameters
* Mode: Enum options ( 'Mix','swing catcher, 'mix')
* Look Back: 1000 ( the limit of the candles to calculate )
___Alert Options___
* Enable Alerts: True/false
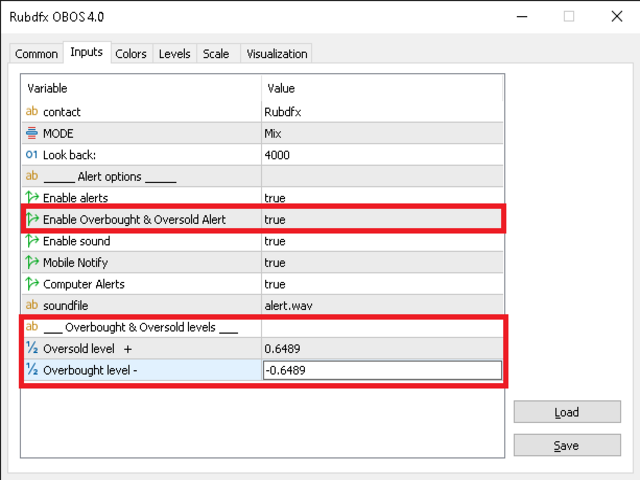
* Enable Overbought & Oversold Alert: True /False
* Enable sound: True/False
* Mobile Notify: True/false
* Computer Alerts: True/False
* Sound file: alert.wav
___Overbought & Oversold Levels___
* Oversold Level + : value
* Overbought level - : - value //negative value
Note the overbought level should be set to negative( Add a negative sign " - " before adding the overbought level value)
-This will now enable the indicator to send notifications when the price has been extremely Oversold and Overbought
-You can turn off the Overbought and Oversold Alerts notifications by setting the " Overbought and Oversold Alerts " to false
-This will not affect normal indicator functionality , all other alerts will still work fine with this feature turned off
#Indicator Usage?
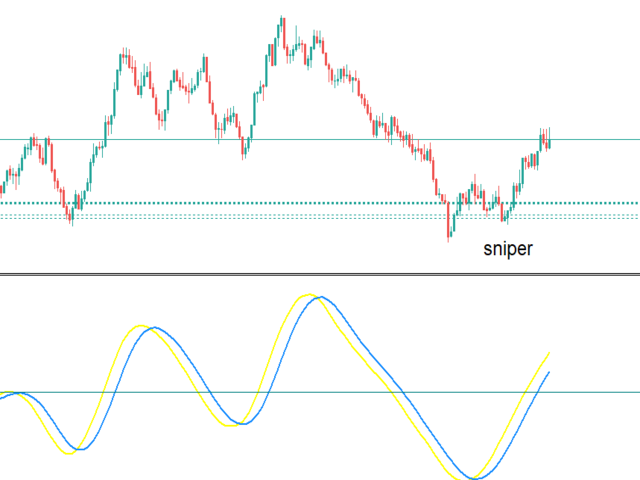
Buying: Place your Buy Entries when the lines cross below the zero (0) line indicating a buy signal , you can also target signals from overbought regions with new version 4.0; stop loss just a few pips below the swing low , A good exit strategy would be when the lines cross again
Selling: Place your Sell Entries when the lines cross from above the zero (0) indicating a sell signal , you can also target signals from oversold regions with new version 4.0 ; stop loss just a few pips above the swing high, take profit when the lines cross again
This indicator also usually works well when paired with the Price Tracker indicator
#Compatibility
-All tradable Currency pairs, Synthetic indices ,Metals, Crypto, NASDAQ etsuitable for scalping and Swing trading,
-It can also be used as additional Confluence to enter a trade when Price is at a significant level of supply and demand or Trend line touch
-MT4/MT5 versions available ,get in touch with us
To see detailed information on how to use overbought and oversold levels , please continue reading here

RESPECT TO THE AUTHOR