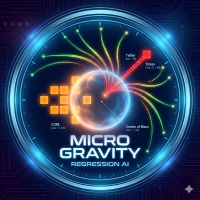
Micro gravity regression AIselfregulation system

5

AI Adaptive Market Holographic System Indicator Based on Microstructure and Field Theory

Abstract:

This paper aims to explore the construction principles and implementation mechanism of a novel financial market analysis tool—the Micro gravity regression AIselfregulation system. This system fuses Market Microstructure theory, classical mechanics (elasticity and gravity models), information entropy theory, and adaptive AI algorithms. By aggregating Tick-level data in real-time, physically modeling absorption density, and utilizing an entropy-based dynamic decay mechanism, the system attempts to build a dynamic physical field capable of quantifying market "Mass," "Tension," and "State," providing visualized decision support for high-frequency and swing trading.

1. Introduction

Traditional technical indicators (such as MA, RSI) are mostly based on linear processing of closing prices, which often results in lag and difficulty in capturing the internal gaming details of price. With the development of high-frequency trading, data based on Order Flow and microstructure has become crucial. The MicroStructure HUD system proposed in this study no longer views price merely as a numerical sequence but as a physical entity with "Mass" and "Energy." By simulating the Center of Mass (CoM) in a physical field and the elastic tension under Hooke's Law, it reveals the intrinsic driving forces of price movement.

2. Implementation Logic & Process

The core code implementation of this system can be decomposed into four coupled modules: the Data Aggregation Layer, the Physics Calculation Layer, the Entropy-Weighted Adaptive Layer, and the AI Learning Layer.

2.1 Data Aggregation Layer: Footprint Aggregation

  • Logic: The system first intercepts every Tick (price change) in the market in real-time via the UpdateFootprintData function.

  • Process:

    • Binning: The price space is divided into several discrete price levels (Bins) according to a GlobalStep (e.g., 0.5 or 1.0 points).

    • Flow Direction Identification: By comparing the price change between the current Tick and the previous Tick, it determines whether it is an active Buy or active Sell.

    • Accumulation: Within the BarFP structure of each candlestick, the system dynamically accumulates the volume (Ticks), buy volume, and sell volume for each price level.

  • Purpose: To transform time-series data into spatial distribution data, constructing the "material basis" of the market.

2.2 Physics Calculation Layer: Mass & Absorption Density (Physics Engine & Absorption)

  • Logic: Based on the hypothesis that "Volume equals Mass," the system calculates the market's Center of Mass (CoM). Version 16.0 introduces the concept of "Absorption Density."

  • Process:

    • Density Weighting: In CalculatePhysics, mass is no longer just volume. The system calculates the buy/sell imbalance:

      $$Imbalance = \frac{|Buy - Sell|}{Total}$$
      $$DensityFactor = 1.0 + Imbalance \times (Gain - 1.0)$$
    • Scientific Basis: The more intense the struggle between bulls and bears (high imbalance), the greater the "density" at that price node, forming a more solid support/resistance.

    • Time Decay: A decay factor ( decay_factor ) is introduced; data further from the current time contributes less mass ($Weight = Decay^{Distance}$).

    • Center of Mass (CoM) Calculation:

      $$CoM = \frac{\sum (Price_i \times Mass_i)}{\sum Mass_i}$$
    • Tension Calculation: Based on Hooke's Law, the system calculates the restorative force (Tension) generated by the deviation of the current price from the CoM.

      $$Tension = (Price - CoM) \times K_{elasticity}$$

2.3 Entropy-Weighted Adaptive Layer: Dynamic Memory (Entropy & Dynamic Decay)

  • Logic: Market states switch between ordered (trend) and disordered (oscillation). The system uses CalculateEfficiency to compute the Efficiency Ratio (ER) as a proxy indicator for "Negative Entropy."

  • Implementation:

    • If ER is high (obvious trend), the system increases the decay coefficient (e.g., 0.99), shifting from short-term memory to long-term memory, because trends have inertia.

    • If ER is low (market chaos), the system decreases the decay coefficient (e.g., 0.80), accelerating the forgetting of historical data to adapt to rapid changes.

2.4 AI Learning Layer: Parameter Auto-Repair (Active AI Learning)

  • Logic: Through the TrainModel function, the system possesses self-reflection capabilities.

  • Process:

    • Prediction: Records historical high-tension states ( Tension Alert ).

    • Validation: After $N$ periods, checks if the price has reversed as expected (returned to the Center of Mass).

    • Reward/Punishment:

      • If the prediction succeeds (high tension leads to reversal), the current parameters are reinforced.

      • If the prediction fails (price continues to break through after high tension), the elasticity coefficient $K$ is reduced (indicating the market has broken its original constraints and entered a new equilibrium), or parameters are penalized.

    • Forgetting: Parameter corrections naturally decay back to baseline values over time to prevent overfitting.

3. Scientific Basis

3.1 Market Microstructure Theory

The Bin structure in the code directly corresponds to the Limit Order Book (LOB) and Trade Flow in microstructure theory.

  • Absorption: The practice of increasing mass weight via Imbalance in the code scientifically simulates the "absorption" phenomenon. When a large number of Market Orders attack a specific price level but the price does not move, it implies that Limit Orders have absorbed all liquidity. In the physical model, this manifests as extreme "density" at that location, making it difficult to penetrate (High Mass results in strong CoM traction).

3.2 Statistical Mechanics & Mean Reversion

  • Center of Mass (CoM): Represents the market's "Fair Value" or "Consensus Zone." According to statistical mechanics, particles (prices) always tend to distribute in the state of lowest energy (near the center of mass).

  • Tension: Quantifies the degree of price deviation from the consensus. Excessive deviation leads to an increase in system potential energy, which in turn generates a reverse restorative force. When Tension > AlertThreshold , it implies the market is in an unstable state, and the probability of Mean Reversion or a Phase Transition (Breakout) is extremely high.

3.3 Information Entropy & Adaptive Systems

The InpDynamicDecay logic referenced in the code is based on cybernetics.

  • Low Entropy State (Trend): High information transmission efficiency; historical prices have strong guiding significance for the future, so the system extends memory (High Decay).

  • High Entropy State (Oscillation): The market is filled with noise; historical information quickly becomes invalid, so the system shortens memory (Low Decay). This design solves the adaptability problem of traditional indicators with "fixed parameters" across different market conditions.

4. Analysis & Conclusion

4.1 Visual Analysis: Orange Core & Red Alert

  • Orange Blocks (Core Support): In the visualization, the orange areas identified by the code logic phy_grid[i].state == "Core" represent high-density, large-mass zones. These are defensive lines built by actual capital commitment from both bulls and bears, serving as strong support/resistance levels in trading.

  • Red Connection Lines (Stress Alert): When the tension line turns red ( Tension > 8.0 ), it indicates that the price is like a rubber band stretched to its limit. At this point, one should not chase the trend but look for reversal signals.

4.2 Limitations & Advantages of the Model

  • Advantages: This model completely detaches from lagging MA algorithms, modeling directly based on the physical properties of transactions. The identification of support and resistance has physical precision. The introduction of the AI module gives it rudimentary "evolutionary" capabilities.

  • Limitations: Driven by high-volatility news events, physical laws may temporarily fail (e.g., price gaps escaping the gravitational field). Therefore, InpTensionAlert is introduced in the code as a phase transition warning.

4.3 Conclusion

The "Micro gravity regression AI self-regulation system" is not just an indicator; it is a physical simulation system based on the four-dimensional space of Price-Volume-Time-Entropy. Through the layered analysis of the code logic, we see that it uses the "density" of micro-data to build a gravitational field, uses "entropy" to regulate time perception, and uses "AI" to correct physical constants. This interdisciplinary fusion provides a brand-new analytical perspective for quantitative trading based on first principles.

Keywords: Market Microstructure, Center of Mass, Algorithmic Trading, Adaptive System, MQL5


리뷰 1
v2tokyo
145
v2tokyo 2026.03.17 14:58 

This indicator is truly exciting. I use it to understand market state transitions, and it works great for that purpose. It can also be helpful for identifying reversal points or deciding profit‑taking levels when letting a position run. I recommend it to anyone who feels that ordinary indicators just aren’t enough.

추천 제품
XFlow
Maxim Kuznetsov
XFlow shows an expanding price channel that helps determine the trend and the moments of its reversal. It is also used when accompanying transactions to set take profit/stop loss and averages. It has practically no parameters and is very easy to use - just specify an important moment in the history for you and the indicator will calculate the price channel. DISPLAYED LINES ROTATE - a thick solid line. The center of the general price rotation. The price makes wide cyclical movements around the
CChart
Rong Bin Su
Overview In the fast-paced world of forex and financial markets, quick reactions and precise decision-making are crucial. However, the standard MetaTrader 5 terminal only supports a minimum of 1-minute charts, limiting traders' sensitivity to market fluctuations. To address this issue, we introduce the Second-Level Chart Candlestick Indicator , allowing you to effortlessly view and analyze market dynamics from 1 second to 30 seconds on a sub-chart. Key Features Support for Multiple Second-Level
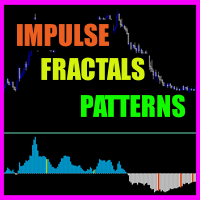
Impulse fractals indicator - is counter-trend oriented complex market fractal pattern.  Market creates bull/bear impulse, trend starts, fractals on impulsed wave are an agressive pullback signals. Buy arrow is plotted when market is bearish and it's impulse showed up-side fractal, and sell arrow is plotted when market is bullish and it's impulse showed dn-side fractal. Main indicator's adjustable inputs : impulsePeriod - main period of impulse histogram  filterPeriod  - smoothes impulse accordi
Ziva LSE System
Hassan Abdullah Hassan Al Balushi
ZIVA LSE System A Professional Liquidity & Structure Execution Framework Executive Overview ZIVA LSE System is a professionally engineered analytical framework designed to interpret market behavior through structural logic and liquidity dynamics. It is not positioned as a conventional indicator. Rather, it functions as a structured execution environment that organizes price action into a clear, disciplined decision-making model. The system is built to deliver consistency, clarity, and controlled
An all‑in‑one trading assistant that blends AI candle synthesis with a 15‑pattern Heat Map, ATR‑scaled S/R & pivots, and a Vigilant risk monitor (LOC/TF/SR/PAT gates, Ready%, EM points, SR‑distance bar). The Opportunity Advisor adds ETAs, checklists and gate status; Multi‑TF Confluence confirms alignment from M1–D1. The Professional Trade Suggestion panel shows regime, session filter, R:R presets, Partials and Quality Pause. Clean, readable UI with one‑click S/R toggles, scanners and a built‑in,
Oneiroi
Oleksandr Powchan
5 (1)
Oneiroi trades hard oversold and overbought conditions. On M15 you can achieve a very high hitrate. The system does not trade a lot because meeting the three conditions is quite hard. It will work on any pair and any broker but some are better than others. The EA will work also on small accounts but i would highly recomend to use a 100kcent account. Our Goal is to help you be way more profitable and way more stress free, so you can enjoy the things that are important to you and your family.
Apex Trend Engine
Thiago Balonyi Candal Da Rosa
Apex Trend Engine is a professional Expert Advisor built to trade market structure and directional momentum with a disciplined risk framework. Unlike conventional systems that rely on lagging indicators or risky recovery methods, Apex Trend Engine focuses on identifying high-probability trend conditions and executing trades with precision and control. The system uses a combination of structural price analysis, volatility filtering, and trend validation to avoid low-quality market conditions. Tra
가격이 유동성을 탐색할 수 있는 위치 파악 Liquidity Reaction Map MT5는 확인된 가격 구조를 기반으로 잠재적인 매수측 및 매도측 유동성 영역을 식별하는 차트 기반 시장 분석 지표입니다. 스윙 포인트, 동일 고점과 동일 저점, 전일 및 전주 레벨, 세션 고점과 저점, 심리적 라운드 가격을 하나의 정리된 유동성 지도에 결합합니다. 서로 가까운 레벨은 하나로 병합할 수 있으며 강도, 현재 가격과의 거리, 여러 출처의 일치 정도에 따라 순위가 결정됩니다. 이 지표는 가격이 유동성 영역에 접근하거나, 해당 유동성을 스윕하거나, 거부되거나, 돌파할 수 있는 위치를 분석하는 데 도움을 줍니다. 거래를 개시하거나 관리하지 않습니다. 유동성 출처 유동성 지도는 다음 항목을 기반으로 유동성을 식별할 수 있습니다. 확인된 스윙 고점과 저점 동일 고점과 동일 저점 전일 고점과 저점 전주 고점과 저점 완료된 세션의 고점과 저점 심리적 라운드 가격 레벨 설정 가능한 여러 시간대 매수측 유
Core Scalper RSI
Ignacio Agustin Mene Franco
CORE SCALPER RSI A gold scalper that trades in the direction of momentum Core Scalper RSI gauges market strength using the RSI indicator, triggering only when momentum is clearly leaning in one direction. Designed for XAUUSD on the M5 timeframe—where gold moves rapidly and every second counts. The concept in 3 steps 1️⃣ Take the pulse The RSI determines who’s in control: if the momentum is bullish, it enables buy trades; if bearish, it enables sell trades. If the market is indec
Zonar Smart Analysis
Elvin Entero Tomolin
**Zonar Smart Analysis** is a complete "Smart Money" trading system designed for MetaTrader 5. It automates the classic **Opening Range Breakout (ORB)** strategy while filtering false signals using advanced Price Action algorithms (Wick Rejection & Swing Analysis). Stop guessing where the session is going. Let Zonar draw the zones, identify the breakout, and highlight institutional Order Blocks for maximum confluence. ### Key Features * **Automated ORB Box:** Automatically detects the Market
Saturated Trend
Vitalii Zakharuk
The Saturated Trend indicator simplifies your decision making process by recognizing reversals with a built-in algorithm and then confirming signals at support/resistance levels. Implements a type of technical analysis based on the idea that the market is cyclical. Thus, the indicator follows the market trend with great reliability, ignoring sharp market fluctuations and noise around the average price. The indicator can be used both for pipsing on short periods and for long-term trading.
Have you ever wondered why so many Forex traders get trapped in weak positions on the wrong side of the market? One of the easiest ways the market makers do this, is by using volatility. A currency pair moves suddenly, often on a news release or economic data. Traders jump in, expecting some quick and easy profits, but the move suddenly moves in the opposite direction. This happens in all timeframes, and in all currency pairs. The candle or bar closes, with a wide spread, but then reverses sharp
Channel Universal   knows how to correctly build a forex channel and forms a classic trading strategy, it is easy to execute, therefore it is accessible even to beginners. Price channels work equally well on any trading assets and timeframes, they can be used both independently and with additional confirmation from oscillators and market volumes. If you look at the price and try to identify the simplest visual patterns, you will immediately see that the price almost never moves in a straight l
Introduction This indicator detects volume spread patterns for buy and sell opportunity. The patterns include demand and supply patterns. You might use each pattern for trading. However, these patterns are best used to detect the demand zone (=accumulation area) and supply zone (=distribution area). Demand pattern indicates generally potential buying opportunity. Supply pattern indicates generally potential selling opportunity. These are the underlying patterns rather than direct price action. T
Seasonal Pattern Trader
Dominik Patrick Doser
Disclaimer : Keep in mind that seasonal patterns are not always reliable. Therefore, thoughtful risk management is crucial to minimize losses.  Seasonal patterns in the financial world are like a well-guarded secret that successful investors use to their advantage. These patterns are recurring price movements that occur during specific periods or around special events. Additionally, there are also intraday patterns that repeat. For example, Uncle Ted from Forex Family suggests examining previou
Nexus Target Pro Indicator Product Overview Nexus Target Pro is a technical indicator designed for breakout zone analysis. The tool charts a dynamic breakout box based on user-defined time ranges and plots arrow signals when price breaks out of the established zones. Technical Features Signal Generation: Displays non-repainting breakout direction arrows on the chart. Target Levels: Plots up to 5 calculated profit target levels based on the breakout box structure. Risk Levels: Displays a sugges
Kadenspikekiller
Netsai Mundawata
Boom & Crash AI Spike Detector MT5 – Advanced Edition + Weltrade Support Unlock the Next Generation of Boom & Crash Trading Experience a smarter way to trade with our Advanced AI Boom & Crash Spike Detector for MT5. Powered by enhanced AI technology and intelligent market filtering, this indicator delivers high-probability Buy and Sell signals with improved accuracy and reduced false entries. Designed for scalpers, day traders, and swing traders, the latest version combines precision, spee
Aegis Kalman Trend
Amanda Vitoria De Paula Pereira
Aegis Kalman Trend is a raw automated trading engine built specifically to extract real momentum from XAUUSD without chasing market noise or taking dummy entries, most retail expert advisors use slow moving averages that cruzam atrasadas and wipe your balance during choppy sessions but this chassi uses a dual-matrix Kalman filter to track the true institutional price line with zero phase-lag, the core algorithm runs an adaptive noise engine that calculates volatility on the fly, it adjusts the f
News Sniper AI Automated News Straddle Breakout System for MetaTrader 5 While most EAs run away from high-impact news, this one was built to hunt them. News Sniper AI connects directly to the MQL5 built-in Economic Calendar, detects upcoming NFP, CPI, FOMC, and GDP releases, and automatically places a precision straddle (Buy Stop + Sell Stop) around the current price seconds before the data drops. When the number hits and price explodes in one direction, the triggered order rides the spike wh
VibeFox Squeeze Detector — 스퀴즈 압축, 모멘텀, 진입 지점 VibeFox Squeeze Detector는 MetaTrader 5를 위한 실시간 Squeeze Detector 지표입니다. 시장이 좁은 범위로 압축되는 구간을 식별하고 그 수면 아래에서 쌓여가는 모멘텀을 측정하므로, 시장이 속박에서 벗어나는 순간 곧바로 행동할 수 있습니다. 고전적인 스퀴즈 로직과 모멘텀 히스토그램은 별도의 하위 창에 표시되고, 진입 표시는 가격 차트 위에 바로 찍히며, 모든 컨트롤은 하나의 현대적인 인터랙티브 패널에 모여 있습니다. 지표가 측정하는 것 핵심 개념은 서로 다른 속도로 확장하고 수축하는 두 변동성 밴드의 비교입니다. Bollinger Bands 는 변동성에 빠르게 반응합니다. 이 밴드가 Keltner Channel 안쪽으로 좁아지면 시장은 스퀴즈에 들어간 것입니다——방향성 있는 움직임이 오기 전에 에너지가 축적되는 압축된 범위의 구간입니다. Bollinger Bands
Mac Rider Gold
Ignacio Agustin Mene Franco
MacRider GOLD is a professional grid-based Expert Advisor (EA) specifically designed for XAUUSD (Gold). It combines MACD signal filtering with dynamic trailing stops and advanced money management. The EA uses the MACD indicator to detect trend direction before placing pending orders, filtering out low-quality entries and focusing on high-probability setups. The grid system places BUY STOP and SELL STOP orders at configurable distances, while automatic profit closing and dynamic trailing stops
Morbius
Lukas Szyry
Morbius ORB TRADER — 스마트 세션 반전 정밀도 Morbius ORB TRADER는 고전적인 세션 시간대 분석과 현대적인 스마트 머니 컨셉(SMC)의 정밀함을 결합한 고도화된 Expert Advisor(EA)입니다. 맹목적으로 돌파를 거래하는 대신, 4단계 엔진을 사용하여 유동성 쓸어담기(Sweeps)와 기관 투자자의 변동(Displacements)을 기다려 완전 자동화된 고정밀 반전 거래를 실행합니다. 거래 전략 4단계 세션 매트릭스: 알고리즘은 아시아 래인지(축적)를 표시하고, 런던 세션 동안의 가짜 돌파(조작)를 기다리며, 뉴욕 오프닝 래인지(ORB)를 활용하여 최종 돌파(확장)를 검증합니다. SMC 및 멀티 타임프레임: M15 및 M5 타임프레임에서 시장을 동시에 분석합니다. 뉴욕 돌파 후 공정 가치 갭(FVG) 및 오더 블록(공급/수요 존) 같은 기관의 흔적을 자체적으로 식별하고 해당 존의 리테스트를 인내심 있게 기다립니다. 인걸핑(Engulfing) 트리거
ENGLISH VERSION (for MQL5 Market) Product Description: RSI Trend & Volatility Dashboard (Multi-Timeframe Filter) This professional dashboard provides traders with an ultimate market overview inside a single chart. It continuously monitors the trend direction across 5 timeframes simultaneously: M5, M15, M30, H1, and D1 [MQL5]. No more tedious chart switching or multi-window clutter – see everything from quick scalping moves to global institutional daily trends in real-time [MQL5]. Key Adva
Bid Price Timer Indicator — 정밀한 타이밍과 스마트한 가격 추적! Bid Price Timer Indicator 는 시간, 정확도, 명확성 을 중요시하는 트레이더를 위해 설계된 강력한 도구입니다. 주요 기능: 고정 타이머 표시 – 타이머는 항상 차트의 오른쪽 에 표시되며, X_Offset 으로 위치를 조정할 수 있습니다. 실시간 가격 추적 – 타이머는 매수 호가 (Bid 가격) 에 따라 위아래로 부드럽게 이동 합니다. 자동 위치 조정 – 가격이 변경되면 타이머가 자동으로 새로운 가격 수준에 맞게 이동 합니다. 선택 가능한 수평선 표시 – 정확한 Bid 가격 수준 을 시각적으로 보여줍니다. ️ 1초 단위 실시간 업데이트 – 타이머는 매초 갱신되며 , 다음 캔들까지의 카운트다운 을 실시간으로 보여줍니다. 트레이더들이 좋아하는 이유: 정확한 캔들 마감 타이밍 을 예측할 수 있습니다 차트를 깔끔하고 현대적이며 직관적 으로
Introduction to Fractal Pattern Scanner Fractal Indicator refers to the technical indicator that makes use of the fractal geometry found in the financial market. Fractal Pattern Scanner is the advanced Fractal Indicator that brings the latest trading technology after the extensive research and development work in the fractal geometry in the financial market. The most important feature in Fractal Pattern Scanner is the ability to measure the turning point probability as well as the trend probabil
PriceActionOracle
Vitalii Zakharuk
The PriceActionOracle indicator greatly simplifies your trading decision-making process by providing accurate signals about market reversals. It is based on a built-in algorithm that not only recognizes possible reversals, but also confirms them at support and resistance levels. This indicator embodies the concept of market cyclicality in a form of technical analysis. PriceActionOracle tracks the market trend with a high degree of reliability, ignoring short-term fluctuations and noise around
CRT Model 1
Yahia Mohamed
5 (2)
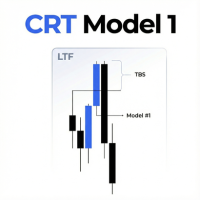
CRT Model 1 EA는 시간 기반 범위 분석, 유동성 스윕(Liquidity Sweeps) 및 되돌림 진입에 중점을 둔 CRT Model 1 전략을 실행하도록 설계된 자동 매매 솔루션입니다. 이 전문가 고문(EA)은 특정 시간 범위를 정의하여 고가 및 저가 참조 지점을 설정합니다. 그런 다음 해당 범위 밖의 가격 움직임을 모니터링하여 터틀 수프(유동성 스윕)를 식별한 후 반전 및 되돌림 진입을 수행합니다. 전략 로직 EA는 다음 로직 순서에 따라 작동합니다: 범위 계산: 범위 시작 시간과 범위 종료 시간 사이의 가격 움직임의 고가(High)와 저가(Low)를 계산합니다. Model #1 진입 패턴: 매도 설정(Sell): EA는 캔들이 CRT 고가 위에서 마감될 때까지 기다립니다. 그 후 후속 캔들이 해당 레벨 아래로 다시 마감될 때까지 기다립니다. 가격이 해당 레벨로 되돌림(retrace)할 때 진입합니다. 매수 설정(Buy): EA는 캔들이 CRT 저가 아래에서 마감될 때까
Profirms Challenge Helper EA
Juan Miguel Salting Patente
$129 is available for only 3 copies. After that, the price will increase to $599. PROFIRMS CHALLENGE HELPER EA Trade With Rules. Protect the Challenge. LOCKERZ — Professional Prop-Firm Objective & Risk Protection for MetaTrader 5 Built for traders who need more than an entry system. LOCKERZ is designed to monitor the critical limits of a prop-firm challenge or funded account and automatically respond before defined risk boundaries are crossed. XAUUSD • MT5 • M5 • Automated Risk Protection BUILT
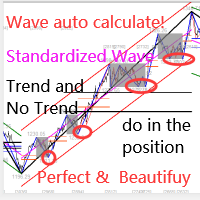
이 지표는 실제 거래에 완벽한 자동 파동 분석 지표입니다! 사례... 참고:   웨이브 그레이딩에 서양식 이름을 사용하는 데 익숙하지 않습니다. Tang Lun(Tang Zhong Shuo Zen)의 명명 규칙의 영향으로 기본 웨이브를   펜   으로 명명하고 2차 웨이브 밴드를   세그먼트   로 명명했습니다. 동시에, 세그먼트에는 추세 방향이 있습니다.   주요 추세 세그먼트에는   이름이 지정되지만(이 이름 지정 방법은 향후 노트에서 사용됩니다. 먼저 말씀드리겠습니다.) 알고리즘은 굴곡 이론과 거의 관련이 없으므로 그렇게 해서는 안 됩니다. 이는 나의 시장 분석을   통해 요약된 끊임없이 변화하고 복잡한 운영 규칙을   반영합니다. 밴드는 더 이상 사람마다 다르지 않도록 표준화되고 정의되었습니다. 인위적인 간섭의 드로잉 방법은 시장 진입을 엄격하게 분석하는 데 핵심적인 역할을 합니다. 이 지표를 사용하는 것은 거래 인터페이스의 미학을 개선하고 원래의 K-line 거래를
CorrelationRadarPRO
Gabriel Balbino De Oliveira
Correlation Radar PRO — Multi-Asset Correlation Dashboard for MetaTrader 5 Short Description: Eliminate market noise and spot price divergences in seconds. Correlation Radar PRO calculates historical, monthly, weekly, and real-time correlations across multiple assets and lets you overlay candles directly on your chart without switching your main symbol. Full Description: Manually switching charts to understand inter-market relationships wastes precious time and leads to missed setups. Correlatio
이 제품의 구매자들이 또한 구매함
Trend Sniper X
Sarvarbek Abduvoxobov
4.9 (42)
Trend Sniper X 는 트레이더가 추세 방향과 잠재적 반전 지점을 명확하고 정확하게 포착할 수 있도록 도와주는 MetaTrader 5용 멀티 타임프레임 추세 추종 지표입니다. MT4용: https://www.mql5.com/en/market/product/193245 가격 정보: 현재 가격은 프로모션 할인가이며, 향후 업데이트 및 새로운 기능이 출시됨에 따라 변동될 수 있습니다. 보너스 혜택: 본 지표 전용 무료 자동매매 Assistant EA를 받으시려면 구매 후 작성자에게 메시지를 보내주시기 바랍니다. Code2Profit 채널 멀티 타임프레임 분석으로 시장을 마스터하세요! Trend Sniper X로 승률을 극대화하는 방법: 핵심 규칙 및 세션 팁 기술 사양 플랫폼 MetaTrader 5 지표 유형 멀티 타임프레임 추세 지표 운용 타임프레임 모든 차트 타임프레임 지원, 독립적으로 선택 가능한 상위 타임프레임(M1–MN1) 주요 상품 외환, 금(XAUUSD) 및 기타 C
Smart Trend Trading System — MetaTrader 5 구매 후 MQL5에서 저에게 메시지를 보내시면 Smart Universal Expert Advisor를 무료로 받으실 수 있으며, 온라인 강좌, PDF 매뉴얼 및 비공개 그룹 이용 권한도 함께 제공됩니다. STTS는 추세 방향, 진입·청산 신호, 반전 구간, 주요 가격 수준을 차트에 모아 보여줍니다. 시스템을 참고해 수동으로 거래하거나, 별도의 호환 EA를 연결하여 선택한 설정에 따라 자동으로 거래를 실행할 수 있습니다. 하나의 시스템, 네 가지 트레이딩 접근법 STTS의 트레이딩 접근법은 크게 네 가지로 나뉩니다. • 스캘핑 — 단기 신호와 시장 움직임을 살펴봅니다. • 추세 매매 — 방향을 평가하고 추세 안에서 기회를 찾습니다. • 반전 매매 — 잠재적인 전환 구간과 방향 변화를 파악합니다. • 거래량 매매 — 거래량 기반 정보로 시장 활동을 평가합니다. 진입·청산 화살표, 추세 정보, 지지·저항 수
M1 Sniper MT5
Oleg Rodin
5 (7)
M1 SNIPER 는 사용하기 쉬운 거래 지표 시스템입니다. M1 시간대에 맞춰 설계된 화살표 지표입니다. 이 지표는 M1 시간대 스캘핑을 위한 단독 시스템으로 사용할 수 있으며, 기존 거래 시스템의 일부로도 사용할 수 있습니다. 이 거래 시스템은 M1 시간대 거래용으로 특별히 설계되었지만, 다른 시간대에도 사용할 수 있습니다. 원래는 XAUUSD와 BTCUSD 거래를 위해 이 방법을 설계했지만, 다른 시장 거래에도 유용하다는 것을 알게 되었습니다. 이 지표의 신호는 추세 방향과 반대로 거래될 수 있습니다. 저는 지표의 신호를 활용하여 양방향으로 거래할 수 있도록 돕는 특별한 거래 기법을 알려드립니다. 이 방법은 특별한 동적 지지선과 저항선 가격 영역을 활용하는 것을 기반으로 합니다. 구매하시면 M1 SNIPER 화살표 지표를 바로 다운로드하실 수 있습니다. 또한, 아래 스크린샷에 표시된 Apollo Dynamic SR 지표는 M1 SNIPER 도구를 사용하는 모든 사용자에게 무료로
Boba Analysis Suite Boba Analysis Suite는 MetaTrader 5용 분석 지표입니다. 시장 구조, 주요 가격 영역, 전반적인 시장 상황을 하나의 차트 화면에 통합하여 표시합니다. 트레이더이자 트레이딩 코치로서의 실무 경험을 바탕으로 개발되었으며, 시장 방향 평가, 주요 가격 수준 식별, 여러 시간대의 종합적인 분석 등 체계적인 분석 과정을 지원합니다. 시장 맥락을 고려한 분석 개별 신호의 의미는 시장 상황에 따라 달라집니다. Boba Analysis Suite는 현재 차트 상황을 더 넓은 시장 구조와 연결하고, 사전에 정한 규칙에 따라 매매 아이디어를 검토할 수 있도록 돕습니다. 주요 분석 기능은 다음과 같습니다. 추세 및 시장 구조: 시장 방향과 관련 구조적 맥락을 평가합니다. 주요 가격 영역 및 수준: 추가 분석이 필요한 중요한 영역을 차트에 시각적으로 표시합니다. 여러 시간대: 서로 다른 시간대의 정보를 통합하여 전반적인 시장 상황을 평가합니다.
Entry Points Pro for MT5
Yury Orlov
4.52 (152)
전설이 돌아왔습니다: Entry Points Pro 10. MQL5 마켓 Top-3 자리를 3년간 지켜온 전설적인 지표의 재출시입니다. 수백 개의 호평 리뷰(두 버전 합산 589개), 매일 이 지표로 거래하는 수천 명의 트레이더, 31,000회 이상의 데모 다운로드   MT4+MT5 . 지난 5년간 여러분이 남긴 리뷰를 하나도 빠짐없이 읽었고, 약속 대신 그 답을 버전 10에 담았습니다. 1999년부터 시장에서 활동하며 정직함과 자신의 평판, 그리고 고객을 소중히 여기는 개발자가 만들었습니다. Entry Points Pro의 진입 시그널은 절대 리페인팅되지 않습니다. 그리고 이번에는 개발자의 말뿐이 아니라 검증 가능한 사실입니다: 확정 시그널은 캔들 종가에서만 표시되며, 자동화 테스트에서 리페인팅 0건 이 확인되었습니다(EURUSD, XAUUSD, BTCUSD에서 2,486,568회의 불변조건 검사 — 위반 0건). 검증 방법은 공개되어 있으니 전략 테스터에서 직접 재현해 보실 수
Auto Optimized SpeedAngle 은 지속적인 워크포워드 최적화(Walk-Forward Optimization, WFO)를 통해 곡선 적합(curve-fitting)을 제거한 기관 수준의 모멘텀 벡터화 시스템입니다. 시장 체제가 바뀔 때 성능이 떨어지는 정적 입력에 의존하는 대신, 이 지표는 표본 외(Out-of-Sample, OOS) 검증을 사용하여 매개변수를 동적으로 재보정하며, 표시되는 신호가 과거의 우연이 아닌 진정한 통계적 우위를 나타내도록 보장합니다. 핵심 기관용 프레임워크 워크포워드 최적화 엔진: 핵심 알고리즘은 수천 가지의 룩백(lookback) 및 임계값 조합을 지속적으로 스캔하며, 데이터를 인샘플(in-sample)과 표본 외(out-of-sample) 세트로 엄격하게 분리합니다. 미지의 데이터 환경에서 수학적 우수성이 증명된 경우에만 새로운 매개변수 구성을 채택합니다. 정량적 목적 함수: 순수한 총이익을 쫓는 대신, 최적화 엔진은 기관 수준의 안정성
Neuro Poseidon MT5
Daria Rezueva
4.75 (52)
Neuro Poseidon is a new indicator by Daria Rezueva. It combines precise trading signals with adaptive TP/SL levels - creating best possible trades as a result! Message me and get  Neuro Poseidon Assistant  as a gift to automize your trading process! What makes it stand out? 1. Proven profitability on all assets and timeframes 2. Only confirmed BUY and SELL signals present on the chart 3. Adaptive TP & SL levels generated by the software for each trade 4. Easy to understand - suitable for al
ARIPoint
Temirlan Kdyrkhan
1 (4)
ARIPoint is a powerful trading companion designed to generate high-probability entry signals with dynamic TP/SL/DP levels based on volatility. Built-in performance tracking shows win/loss stats, PP1/PP2 hits, and success rates all updated live. Key Features: Buy/Sell signals with adaptive volatility bands Real-time TP/SL/DP levels based on ATR Built-in MA Filter with optional ATR/StdDev volatility Performance stats panel (Success, Profit/Loss, PP1/PP2) Alerts via popup, sound, push, or email Cu
Adaptive Price Action Engine 지표를 구매하면 EA(자동매매 프로그램)가 무료 멀티 타임프레임 기반 자기 최적화 추세 & 캔들 패턴 분석 시스템 시장은 끊임없이 변화하며, 모든 Price Action 패턴이 모든 시장 환경에서 동일한 가치를 가지는 것은 아닙니다. Adaptive Price Action Engine 은 변화하는 시장 환경에 적응할 수 있도록 설계되었으며, 추세 구조, 멀티 타임프레임 분석, 캔들 패턴 및 통계적 최적화 를 하나의 분석 프레임워크로 결합합니다. 두 가지 적응형 모드 Dual Alpha Trend Mode 낮은 타임프레임과 높은 타임프레임에서 적합한 Alpha Trend 파라미터를 자동으로 탐색하여, 최근 시장 움직임에 맞춰 추세 분석을 조정합니다. Candlestick + Alpha Mode Alpha Trend를 통한 시장 국면 분석과 22개의 상승 및 하락 캔들 패턴 을 결합합니다. 모든 패턴을 동일하게 취급하는 대신, 다양
Gann Made Easy MT5
Oleg Rodin
5 (12)
Gann Made Easy 는 mr.의 이론을 사용하여 최고의 거래 원칙을 기반으로 하는 전문적이고 사용하기 쉬운 Forex 거래 시스템입니다. W.D. 간. 이 표시기는 Stop Loss 및 Take Profit Levels를 포함하여 정확한 BUY 및 SELL 신호를 제공합니다. PUSH 알림을 사용하여 이동 중에도 거래할 수 있습니다. 구매 후 거래 방법 안내 및 유용한 추가 지표를 무료로 받으시려면 저에게 연락주세요! 아마도 Gann 거래 방법에 대해 이미 여러 번 들었을 것입니다. 일반적으로 Gann의 이론은 초보자 거래자뿐만 아니라 이미 거래 경험이 있는 사람들에게도 매우 복잡한 것입니다. Gann의 거래 방식은 이론적으로 적용하기 쉽지 않기 때문입니다. 나는 그 지식을 연마하고 Forex 지표에 최고의 원칙을 적용하기 위해 몇 년을 보냈습니다. 표시기는 적용하기가 매우 쉽습니다. 차트에 첨부하고 간단한 거래 권장 사항을 따르기만 하면 됩니다. 지표는 지속적으로 시장 분석
Scalper Vault MT5
Oleg Rodin
5 (1)
Scalper Vault는 당일 매매(intraday trading)에서 일관된 성과를 내고자 하는 트레이더를 위해 설계된, 강력하고 모든 기능을 갖춘 트레이딩 시스템입니다. 이 고정밀 지표는 외환(Forex) 및 바이너리 옵션 트레이더 모두에게 기관급 분석을 제공하는 독립적인 종합 트레이딩 시스템 역할을 합니다. 구매 후 저에게 연락해 주시면, 트레이딩 팁과 함께 특별한 보너스를 제공해 드립니다! Scalper Vault는 추측에 의존하거나 복잡한 수동 분석을 할 필요를 없애주며, 사용하기 쉬운 트레이딩 기법을 통해 오직 매매 실행에만 집중할 수 있도록 돕습니다. 정확한 추세 추종 신호: 핵심 알고리즘이 시장 구조를 분석하여, 지배적인 시장 추세 방향과 일치하는 고확률 신호만을 제공함으로써 잘못된 진입을 획기적으로 줄여줍니다. 정밀한 고점 및 저점 탐지: 시장의 움직임이 소진되는 지점을 스캔하여 잠재적인 반전 구간을 식별합니다. 간(Gann) 이론 기반의 매수/매도 구간: 수학적
Entry In The Zone and SMC Multi Timeframe is a real-time market analysis tool based on Smart Money Concepts (SMC), designed to analyze market structure, price direction, and key trading zones. It supports both Single-Timeframe and Multi-Timeframe Analysis, providing a clearer view of overall market structure across multiple timeframes, with real-time BUY / SELL signals designed with a strict focus on No-Repaint principles. The signals are designed to help filter unclear setups and evaluate tradi
FiboSniper Pro
Van Minh Nguyen
5 (3)
FiboSniper Pro – Multi-Filter Fibonacci System with Auto SL/TP and Control Panel FiboSniper Pro는 동적 Fibonacci Envelopes와 여러 확인 필터를 결합하여 선별된 Buy 및 Sell 신호를 생성하는 기술적 지표입니다. Fibonacci 레벨은 Moving Average와 ATR을 기반으로 계산된 후 ADX, EMA, RSI, ATR, Volume, Time 및 Candle 구조를 통해 필터링됩니다. 이 지표는 ATR 기반의 자동 Stop Loss 및 Take Profit 레벨을 차트에 직접 표시하며, 빠른 설정 조정을 위한 인터랙티브 Control Panel을 제공합니다. 구매 후 권장 설정 파일과 자세한 사용 방법을 받으려면 저에게 문의해 주세요. Auto Trader X를 사용하여 FiboSniper Pro 신호를 자동화할 수 있습니다: [Auto Trader X] User Guide 및 Se
Divergence Bomber
Ihor Otkydach
4.89 (94)
이 지표를 구매하신 분께는 다음과 같은 혜택이 무료로 제공됩니다: 각 거래를 자동으로 관리하고, 손절/익절 수준을 설정하며, 전략 규칙에 따라 거래를 종료하는 전용 도우미 툴 "Bomber Utility" 다양한 자산에 맞게 지표를 설정할 수 있는 셋업 파일(Set Files) "최소 위험", "균형 잡힌 위험", "관망 전략" 모드로 설정 가능한 Bomber Utility의 셋업 파일 이 전략을 빠르게 설치, 설정, 시작할 수 있도록 돕는 단계별 영상 매뉴얼 주의: 위의 모든 보너스를 받기 위해서는 MQL5 개인 메시지 시스템을 통해 판매자에게 연락해 주세요. 독창적인 커스텀 지표인 “Divergence Bomber(다이버전스 봄버)”를 소개합니다. 이 지표는 MACD 다이버전스(괴리) 전략을 기반으로 한 올인원(All-in-One) 거래 시스템입니다. 이 기술 지표의 주요 목적은 가격과 MACD 지표 간의 다이버전스를 감지하고, **향후 가격이 어느 방향으로 움직일지를 알려주

PainX GainX Blue Spike Fusion AI Advanced Synthetic Index Spike Detection Indicator for MetaTrader 5 Discover potential spike setups with a clear, organized, and professional trading interface. PainX GainX Blue Spike Fusion AI is a specialized indicator designed for traders who monitor synthetic indices and want a structured way to observe potential price spike opportunities. The indicator combines signal monitoring, market-condition analysis, visual alerts, and event tracking in one convenient
Quantum TrendPulse
Bogdan Ion Puscasu
5 (26)
SuperTrend   ,   RSI   ,   Stochastic   의 힘을 하나의 포괄적인 지표로 결합하여 트레이딩 잠재력을 극대화하는 궁극의 트레이딩 도구   인 Quantum TrendPulse를   소개합니다. 정밀성과 효율성을 추구하는 트레이더를 위해 설계된 이 지표는 시장 추세, 모멘텀 변화, 최적의 진입 및 종료 지점을 자신 있게 식별하는 데 도움이 됩니다. 주요 특징: SuperTrend 통합:   주요 시장 추세를 쉽게 따라가고 수익성의 물결을 타세요. RSI 정밀도:   매수 과다 및 매도 과다 수준을 감지하여 시장 반전 시점을 파악하는 데 적합하며 SuperTrend 필터로 사용 가능 확률적 정확도:   변동성이 큰 시장에서 숨겨진 기회를 찾기 위해 확률적 진동   을 활용하고 SuperTrend의 필터로 사용 다중 시간대 분석:   M5부터 H1 또는 H4까지 다양한 시간대에 걸쳐 시장을 최신 상태로 유지하세요. 맞춤형 알림:   맞춤형 거래 조건이 충족되면
Advanced Supply Demand MT5
Bernhard Schweigert
4.53 (15)
현재 33% 할인! 초보자나 전문 트레이더를 위한 최고의 솔루션! 이 보조지표는 우리가 다수의 독창적 기능과 새로운 공식을 통합한 독특하고 고품질이며 저렴한 거래 도구입니다. 이 업데이트를 통해 이중 시간대를 표시할 수 있습니다. 더 높은 TF를 표시할 수 있을 뿐만 아니라 차트 TF와 더 높은 TF 모두를 표시할 수 있습니다: 중첩 영역 표시. 모든 Supply Demand 트레이더들이 좋아할 것입니다. :) 중요한 정보 공개 Advanced Supply Demand의 잠재력을 극대화하려면 다음을 방문하십시오. https://www.mql5.com/ko/blogs/post/720245   진입 또는 목표의 명확한 트리거 포인트를 정확히 찾아냄으로 해서 거래가 어떻게 개선될지 상상해 보십시오. 새로운 알고리즘을 기반으로 매수자와 매도자 간의 잠재적인 불균형을 훨씬 더 쉽게 분간할 수 있습니다. 왜냐하면 가장 강한 공급영역과 가장 강한 수요 영역과 과거에 어떻게 진행 되었는지를(이전
Btmm state engine pro
Garry James Goodchild
5 (4)
BTMM State Engine Pro by G-Labs — Beat The Market Maker indicator for MetaTrader 5. Asian session range, London and New York kill zones, level progression (L1/L2/L3), peak formation detection (PFH/PFL), entry signals, and a multi-pair scanner from one chart. Stop scanning charts one pair at a time. The State Engine tracks the BTMM daily cycle automatically — Asian box, room boundaries, level blocks, peak formations, and filtered entries — while the scanner dashboard shows level, peak status, d
PZ Divergence Trading MT5
PZ TRADING SLU
3.71 (7)
Unlock hidden profits: accurate divergence trading for all markets Tricky to find and scarce in frequency, divergences are one of the most reliable trading scenarios. This indicator finds and scans for regular and hidden divergences automatically using your favourite oscillator. [ Installation Guide | Update Guide | Troubleshooting | FAQ | All Products  ] Easy to trade Finds regular and hidden divergences Supports many well known oscillators Implements trading signals based on breakouts Displays
DayTrader PRO
Davit Beridze
5 (4)
DayTrader PRO DayTrader PRO는 존 에러스(John Ehlers)의 Laguerre 필터와 강력한 자동 최적화 엔진을 결합한 고급 트레이딩 지표입니다. 고정된 파라미터를 사용하는 대신, 최근 시장 상황을 바탕으로 최적의 설정을 자동으로 검색하므로 지속적인 수동 조정 없이도 변화하는 시장 변동성에 대응할 수 있습니다. 이 지표는 명확한 매수(BUY) 및 매도(SELL) 신호를 생성하며, 현재 시장 변동성을 기준으로 계산된 적응형 손절매(Stop Loss) 및 익절(Take Profit) 레벨을 제공합니다. 내장된 추세, 효율성 지수(Efficiency Ratio), 변동성 및 캔들 필터 기능은 저품질의 진입 신호를 제거하여 신호의 정확도를 높여줍니다. 실시간 성능 대시보드에서는 현재 최적화된 설정값, 수익 요인(Profit Factor), 승률(Win Rate), 최대 낙폭(Drawdown) 및 기타 트레이딩 통계를 확인할 수 있습니다. 또한 DayTrader PR
Gartley Hunter Multi
Siarhei Vashchylka
5 (12)
Gartley Hunter Multi - An indicator for searching for harmonic patterns simultaneously on dozens of trading instruments and on all possible timeframes. Manual (Be sure to read before purchasing) | Version for MT4 Advantages 1. Patterns: Gartley, Butterfly, Shark, Crab. Bat, Alternate Bat, Deep Crab, Cypher 2. Simultaneous search for patterns on dozens of trading instruments and on all possible timeframes 3. Search for patterns of all possible sizes. From the smallest to the largest 4. All fou
Volatility Master for MetaTrader is a real-time dashboard tool that scans up to  50 symbols  to identify high-volatility , trending markets instantly. With bullish/bearish signals, customizable alerts, and a user-friendly interface, it helps you avoid range-bound conditions and focus on high-probability trades. Clarity leads to confidence. Trade confidently and protect your capital effectively with this powerful dashboard. We don't offer free or bonus indicators in exchange of reviews from you.
Advanced Currency Strength28 MT5
Bernhard Schweigert
5 (3)
초보자 또는 전문가 트레이더를 위한 최고의 솔루션! 이 지표는 우리가 독점 기능과 새로운 공식을 통합했기 때문에 독특하고 고품질이며 저렴한 거래 도구입니다. 단 하나의 차트로 28 Forex 쌍의 통화 강도를 읽을 수 있습니다! 새로운 추세 또는 스캘핑 기회의 정확한 트리거 포인트를 정확히 찾아낼 수 있기 때문에 거래가 어떻게 개선될지 상상해 보십시오. 사용 설명서: 여기를 클릭  https://www.mql5.com/en/blogs/post/697384 그것이 첫 번째, 원본입니다! 쓸모없는 지망생 클론을 사지 마십시오. 더 스페셜  강력한 통화 모멘텀을 보여주는 하위 창의 화살표 GAP가 거래를 안내합니다! 기본 또는 호가 통화가 과매도/과매도 영역(외부 시장 피보나치 수준)에 있을 때 개별 차트의 기본 창에 경고 표시가 나타납니다. 통화 강도가 외부 범위에서 떨어질 때 풀백/반전 경고. 교차 패턴의 특별 경고 추세를 빠르게 볼 수 있는 다중 시간 프레임 선택이 가능합
초보자 또는 전문가 트레이더를 위한 최고의 솔루션! 이 지표는 우리가 독점 기능과 비밀 공식을 통합했기 때문에 독특하고 고품질이며 저렴한 거래 도구입니다. 단 하나의 차트로 28개 통화 쌍 모두에 대한 경고를 제공합니다. 새로운 추세 또는 스캘핑 기회의 정확한 트리거 포인트를 정확히 찾아낼 수 있기 때문에 거래가 어떻게 개선될지 상상해 보십시오! 새로운 기본 알고리즘을 기반으로 구축되어 잠재적인 거래를 훨씬 더 쉽게 식별하고 확인할 수 있습니다. 이는 통화의 강세 또는 약세가 가속되는지 여부를 그래픽으로 표시하고 가속 속도를 측정하기 때문입니다. 자동차의 속도계처럼 생각하면 됩니다. 가속화할 때 Forex 시장에서 동일한 일이 분명히 더 빠르게 발생합니다. 즉, 반대 방향으로 가속화되는 통화를 페어링하면 잠재적으로 수익성 있는 거래를 식별한 것입니다. 통화 모멘텀의 수직선과 화살표가 거래를 안내합니다! 역동적인 Market Fibonacci 23 레벨은 경고 트리거로 사용되며
Trend Lines PRO MT5
Roman Podpora
5 (1)
트렌드 라인즈 프로       이 지표는 시장이 실제로 어떤 방향으로 전환되는지 파악하는 데 도움이 됩니다. 실제 추세 반전 지점과 주요 시장 참여자들이 다시 진입하는 지점을 보여줍니다. 보시다시피       BOS 라인       복잡한 설정이나 불필요한 노이즈 없이 더 높은 시간대의 추세 변화와 주요 레벨을 확인할 수 있습니다. 신호는 차트에 다시 그려지지 않고 캔들이 마감된 후에도 계속 표시됩니다. VERSION MT 4   -   RFI LEVELS PRO   표시기   와 결합할 때 최대 잠재력을 발휘합니다. 지표가 보여주는 내용: 실제 변화       추세(BOS 라인) 한 번 신호가 나타나면 그 신호는 계속 유효합니다! 이는 신호를 발생시킨 후 변경될 수 있는 리페인팅 방식의 지표와 중요한 차이점입니다. 리페인팅 방식의 지표는 잠재적으로 자금 손실로 이어질 수 있습니다. 이제 더욱 높은 확률과 정확도로 시장에 진입할 수 있습니다. 또한 화살표가 나타난 후 목표가(익절)
Naked Forex Big Shadow indicator for MT5
Renaud Herve Francois Candel
5 (1)
Naked Forex Big Shadow Indicator Big Shadow Indicator is a pattern recognition indicator for Forex, Stocks, Indices, Futures, Commodities and Cryptos. When you have a Big Shadow on your chart then this is a strong signal meaning that you might be ahead of a reversal. You can take other elements (momentum, trend, volatility, price action, fundamentals) to build a complete strategy and confirm your entries. Beware that you might not make money just following the arrows generated by the pattern re
통화 강도 마법사는 성공적인 거래를 위한 올인원 솔루션을 제공하는 매우 강력한 지표입니다. 표시기는 여러 시간 프레임의 모든 통화 데이터를 사용하여 이 또는 해당 외환 쌍의 힘을 계산합니다. 이 데이터는 특정 통화의 힘을 확인하는 데 사용할 수 있는 사용하기 쉬운 통화 지수 및 통화 전력선의 형태로 표시됩니다. 필요한 것은 거래하려는 차트에 표시기를 부착하는 것뿐입니다. 표시기는 거래하는 통화의 실제 강세를 보여줍니다. 지표는 또한 추세와 거래할 때 유리하게 사용할 수 있는 구매 및 판매 거래량 압력의 극한값을 보여줍니다. 지표는 또한 피보나치에 기반한 가능한 대상을 보여줍니다. 표시기는 PUSH 알림을 포함한 모든 유형의 알림을 제공합니다. 구매 후 연락주세요. 나는 당신과 거래 팁을 공유하고 당신에게 무료로 훌륭한 보너스 지표를 줄 것입니다! 나는 당신에게 행복하고 유익한 거래를 기원합니다!
ICT PO3 (Power of 3) AMD Protocol Framework Indicator True Time & Structure Integration   |  Non-Repainting | Real-Time  | Multi-Asset  | MT4 Version Available Full Setup Guide & Strategy Playbook: https://www.mql5.com/en/blogs/post/768683 The ICT Power of Three (PO3): The Complete Guide to Accumulation, Manipulation, and Distribution https://www.mql5.com/en/blogs/post/771729 MT4 Version: https://www.mql5.com/en/market/product/171742 Indicator Overview The ICT PO3 AMD Protocol Framework i
RelicusRoad Pro MT5
Relicus LLC
4.96 (25)
거래를 더 이상 감으로 하지 마세요. 언제 진입할지, 어디서 청산할지, 시장이 어느 쪽으로 기울어 있는지를 한 차트에서 확인하세요. RelicusRoad Pro는 20개 가까운 도구를 인디케이터 하나에 담았고, 내 매매 방식에 맞는 도구만 켜서 쓰면 됩니다. 명확한 진입. 명확한 청산. 차트마다 확실한 계획. 이런 경험, 익숙하지 않으신가요? 매수하면 1분 뒤 가격이 반대로 돌아섭니다. 너무 일찍 청산하고, 그다음 움직임이 나 없이 이어지는 것을 지켜봅니다. 지표를 5개 띄우면 답도 5가지가 나옵니다. 손절(스톱로스)은 그냥 감입니다. 우리가 이걸 만든 이유 우리는 18년 동안 외환 거래를 해 왔습니다. RelicusRoad는 처음에 우리끼리 쓰려고, 전문 트레이더 모임을 위해 비공개로 만들었습니다. 이유는 개인적이었습니다. 같은 선을 손으로 계속 그리는 일에 지쳤고, 스스로 정한 규칙을 어기고, 차트에서 정말 중요한 한 가지를 놓치곤 했습니다. 우리에게 통한 것은 일관성입니다. 매
CGE Trading Suite
Carl Gustav Johan Ekstrom
5 (2)
Institutional-Grade Analytics for MT5 The full analytical edge of a professional trading desk, built into your MT5 chart. Standard retail platforms lack the depth required for professional market analysis. The CGE Trading Suite bridges this gap, transforming MetaTrader 5 into a comprehensive workspace. By integrating 22 proprietary modules into a single, unified chart interface, the suite eliminates fragmented analysis. It provides definitive clarity across market structure, timing, momentum,
제작자의 제품 더 보기
Orderflow Smart Flip
Jingfeng Luo
5 (1)
Orderflow Smart Flip ( DEMO version,modleling must choose " Every tick based on real ticks") — Insight into Institutional Footprints, Capturing Reversals, Making Every Line Data-Driven. Important notice: Before placing an order, please contact me first, and I will provide you with professional answers and services Product Introduction Say Goodbye to Guesswork. Embrace the Data Truth. [The last two screenshots show scenarios where the OrderFlow Bubbles Pro indicator is used in combination.] Ord
OrderFlow Bubbles Pro  (OFB-Pro)( Order flow main force large order bubble monitoring indicator )  DEMO version,modleling must choose " Every tick based on real ticks" Peer into the Micro-World of Candlesticks Like an Institutional Trader。[The last two screenshots show scenarios where the Orderflow Smart Flip indicator is used in combination with other indicators.] important note: on the strategy tester, when testing the indicator use either of the modes below Every Tick Every tick based on re
FootprintOrderflow
Jingfeng Luo
5 (4)
FOOTPRINTORDERFLOW: The Authoritative Guide ( This indicator is also compatible with economic providers that do not offer DOM data and BID/ASK data, It also supports various foreign exchange transactions, DEMO version,modleling must choose " Every tick based on real ticks"  ) Important notice: Before placing an order, please contact me first, and I will provide you with professional answers and services 1. Overview FOOTPRINTORDERFLOW  is an advanced Order Flow analysis tool designed for MetaTra
ProQuant Probability Map: A Dual-Quant Prediction System to Navigate the Future Say goodbye to blind guessing. Let historical data be your compass. The ProQuant Probability Map is an advanced quantitative tool exclusively designed for MetaTrader 5. Unlike traditional lagging indicators (such as RSI or MACD), it calculates historical price distribution probabilities in real-time, directly projecting a "Heatmap" of potential future price levels onto the right side of your chart. Version 7 introduc
Dom Book HeatMAP Lightning Trading Panel Professional-Grade Microstructure Lightning Trading Panel · User Manual Important notice: Before placing an order, please contact me first, and I will provide you with professional answers and services Major update explanation: On January 10, 2016, automatic trading EA and control panel were added. For detailed parameter configuration, please refer to the latter half of this article. Important Note: 1、As this is a heatmap, footprint map, and DOM tradin
After downloading this service program, it will be used as a service support program for Dom BookHeatMAP Lightning Trading Panel. Dom BookHeatMAP Lightning Trading Panel   download link: https://www.mql5.com/zh/market/product/159414?source=Site+Market+MT5+Search+Rating006%3aDom+BookHeatMAP+Lightning+Trading+Panel Please first drag and drop the downloaded file to the corresponding service folder (` MQL5 \ Services `) in the MT5 data directory, and confirm that the file has been successfully pla
Trade  Risk  Manager Pro (Trade Control Assistant Pro) - User Manual 1. Product Overview & Key Features Trade Risk Manager Pro is an institutional-grade risk management panel developed for the MetaTrader 5 (MT5) platform. Its core philosophy is to decouple "Trade Execution" from "Risk Control." By enforcing hard constraints , it helps traders overcome psychological weaknesses (such as holding losing trades, over-leveraging, or revenge trading) while providing a modern, seamless user experience.
Support Resistance Pro line — Insight into Institutional Footprints, Capturing Reversals, Making Every Line Data-Driven.(This indicator has the same function as the Orderflow Smart Flip indicator, with only the name differing) Product Introduction Say Goodbye to Guesswork. Embrace the Data Truth. Support Resistance Pro line  is not just another drawing tool; it is an institutional behavior analysis system built on   Tick-level microscopic data . Acting like an X-ray for the market, it penetrate
Orderflow Super Candles - Simple Footprint Chart Indicator Platform: MetaTrader 5 (MT5)  (The last screenshot shows the use of the DOM tool in conjunction with the product.) 1. Product Introduction Orderflow Super Candles is a professional charting tool based on underlying Tick data analysis, designed to provide traders with a deep "X-ray" view of the market. By parsing the buy and sell volume distribution within each candlestick, this indicator visualizes the hidden market microstructure. It
Crypto Gold Arbitrage Pro - Product Introduction    [MT5 limit,  DEMO version dont work!] Core Positioning Crypto Gold Arbitrage Pro is a cross-exchange gold arbitrage system designed for the MT5 platform, capturing price discrepancies between MT5 brokers and cryptocurrency exchanges (Binance/OKX) to achieve low-risk, high-efficiency arbitrage trading.  Five Core Advantages 1. Dual-Platform Intelligent Switching Support for Binance and OKX - two major cryptocurrency exchanges Choose single-platf
필터:
v2tokyo
145
v2tokyo 2026.03.17 14:58 

This indicator is truly exciting. I use it to understand market state transitions, and it works great for that purpose. It can also be helpful for identifying reversal points or deciding profit‑taking levels when letting a position run. I recommend it to anyone who feels that ordinary indicators just aren’t enough.

리뷰 답변