Cycle Sniper MT5
- 지표
- 버전: 2.0
- 업데이트됨: 6 8월 2022
- 활성화: 5

Cycle Sniper MT5
Cycle Sniper MT4 Version and definitions : https://www.mql5.com/en/market/product/51950
Important Notes:
- MT5 Version does not include Breakout Mode and Late Entry Mode Features.
- MT5 Version does not include RSI and MFI filter.
**Please contact us after your purchase and we will send you the complimentary indicators to complete the system.**
This indicator does not send any signal without a reason...You can observe and analyze the indicator and the signals it sends
Cycle Sniper is not a holy grail but when you use it in a system which is explained in the videos, you will feel the difference.
We recommend watching the videos about the indiactor and system befoe purchasing.
**Please contact us after your purchase and we will send you the complimentary indicators to complete the system.**
Note: If you close the chart or change the timeframe, you may see some of the markings redrawn.
Please test the indicator on the strategy tester before you rent or purchase it. If you do not feel comfortable, please do not buy it.
""Scanner and Dashboard will be sent complimentary for the users who bought the indicator. ( Not valid for renting).""
""MT5 Version of CS Beta Bands will be sent complimentary for the users who bought the indicator. ( Not valid for renting).""
Videos, settings and descriptions can be found here ( Valid for MT5 as well - Only Extreme Reversal Mode )
The complex algo is based on:
Fibonacci Retracement and Extension level.
Harmonic Waves
Fibonacci Gann
Fibonacci Speed Fan
Murrey Math Calculations
Price Deviations
Moving Averages
Features:
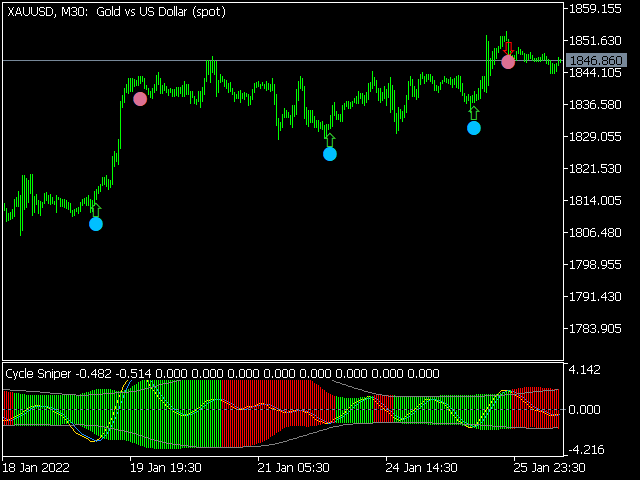
Reversal Mode Only
High Accuracy
Works on every timeframe and every instrument. ( Currencies, Commodities, Indices, Stocks, Cryptos)
Full alerts option and push notifications
Different settings for harmonic cycles will be sent.
7/24 support . Different trading strategies will be explained and shared with the users of the Cycle Sniper.
Advantages:
Trade the signals of the Cycle Sniper ( You can use it as an harmonic indicator )
Combine the signal of Cycle Sniper with your harmonic and/or breakut patterns
Trade Murrey Math lines or other support/resistance lines
Use the indicator to enter to trade or to take profit.
Finds extreme reversal points.
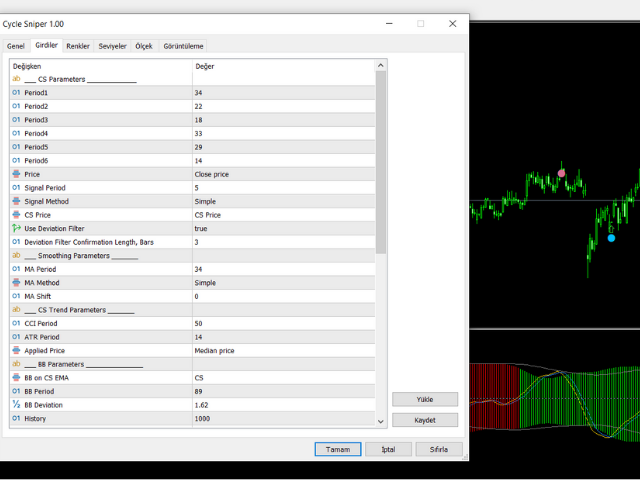
Parameters:
Main Settings
Cycle Snipper Parameters: Periods of Moving Averages
Signal Period: Recommended period between 5-7
Signal Method: Recommended : Simple
CS Cycle Sniper Price : Current Price / CS Trend Price
BB Paramenters: Use to calculate Depth / Deviation of the cycle
Deviation Filter is added on the v03
If deviation filter is true: dot+arrows = signal with deviation filter confirmation and dots= signal without deviation filter confirmation
Important Notes:
Different settings for different signal modes will be sent to you after the purchase of the product.
You can use your own settings for each instrument or for some certain timeframes.
You can use the indicator with different settings (ie: Bigger Cycles vs Smaller Fibo Retracements ) on the same chart to see the bigger picture.
Due to the nature of the indicator,it may not give 100% proper results on the strategy tester.
7/24 support .Different trading strategies will be explained and shared with the users of the Cycle Sniper.
If you need further information, please do not hesistate to contact us via PM.


사용자가 평가에 대한 코멘트를 남기지 않았습니다