Pro Support Resistance MT5
- 지표
-
Suvashish Halder
 💧 PRO TIP - Don't Open Orders Where You See, Open Them Where Others Can't!
📈 Decoding Market Phases Like Never Before – The SuvashishFx Revolution! - 버전: 1.0
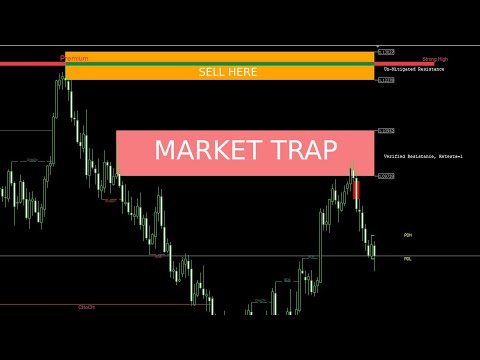
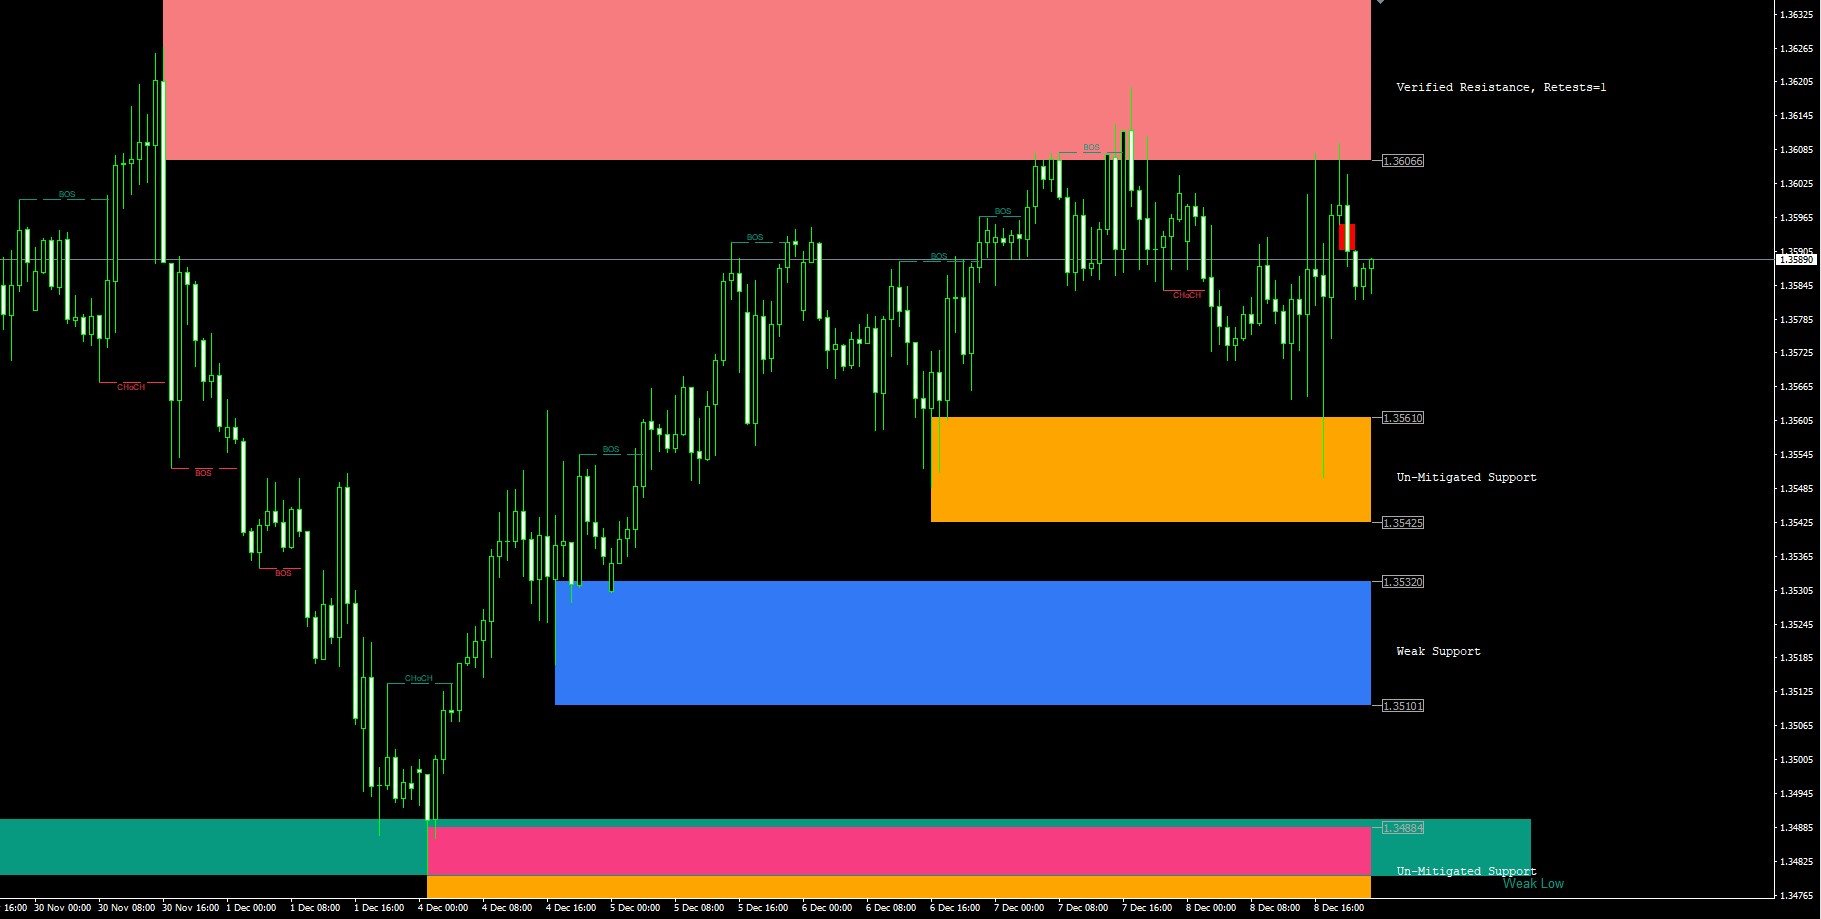
This is the best Support and Resistance Indicator on the market, and it shows both confirmed Support and Resistance as well as Retests.
Support & Resistance: Support marks where buying demand halts price declines, acting as a safety net. Resistance caps price surges, driven by selling pressure. Traders leverage these levels to predict reversals, plan entries, exits, and manage risks, making them trading's fundamental guideposts.
Join To Learn Market Depth - https://www.mql5.com/en/channels/suvashishfx
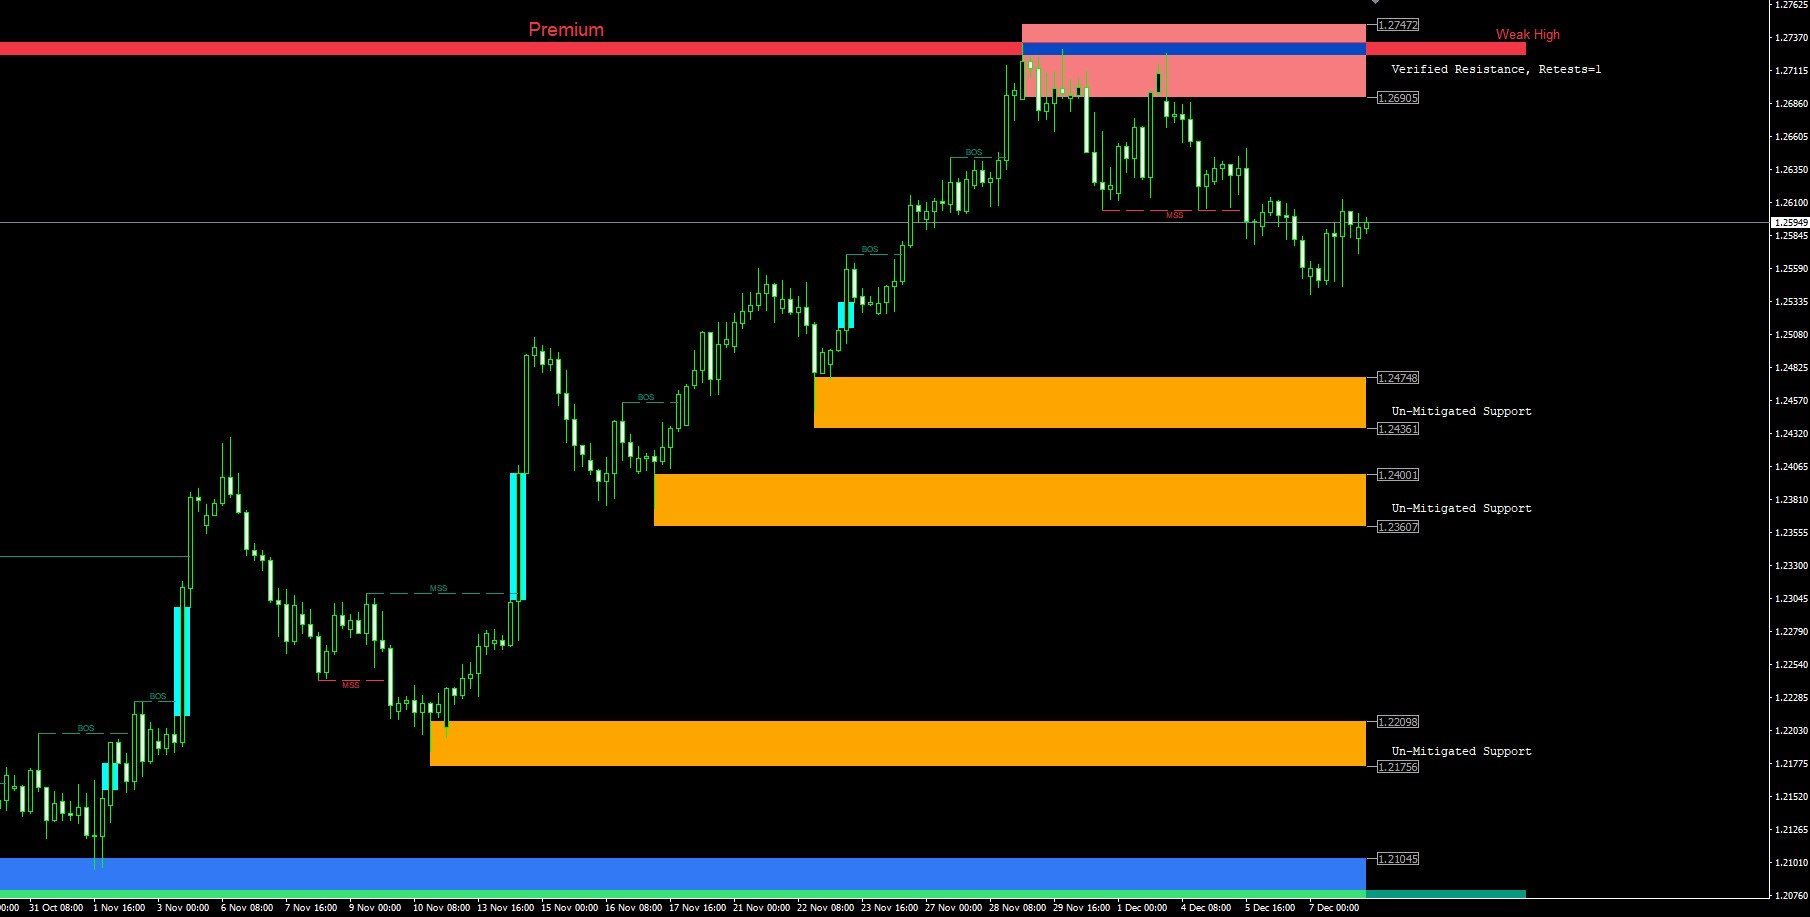
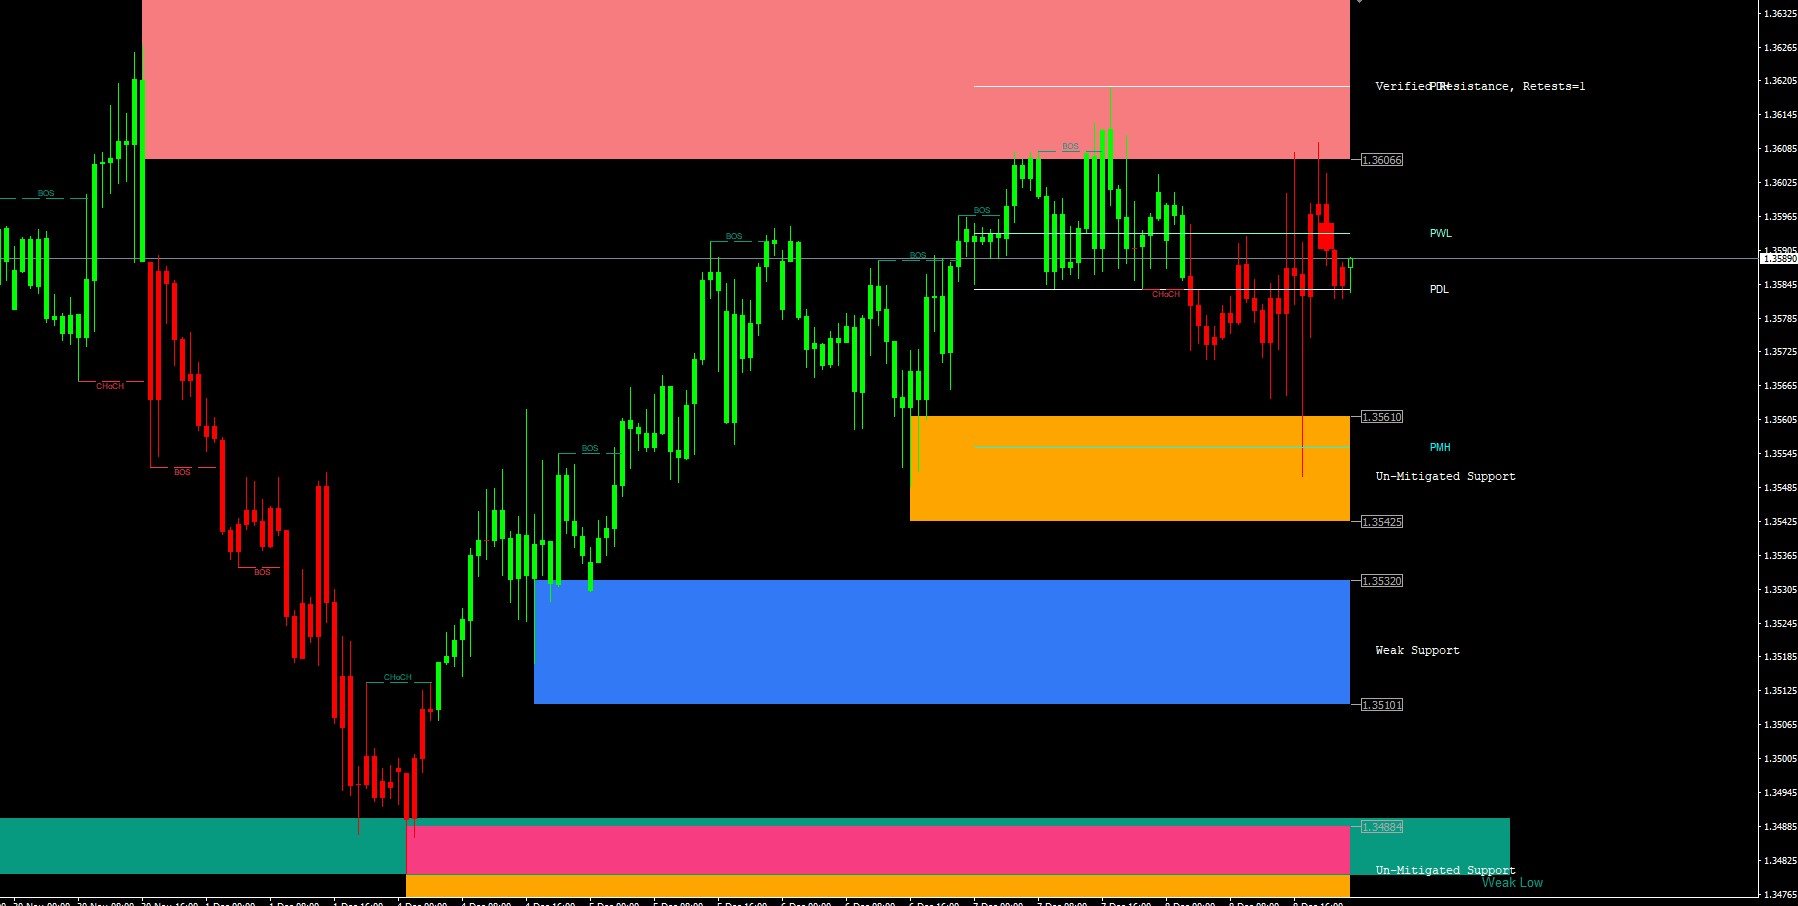
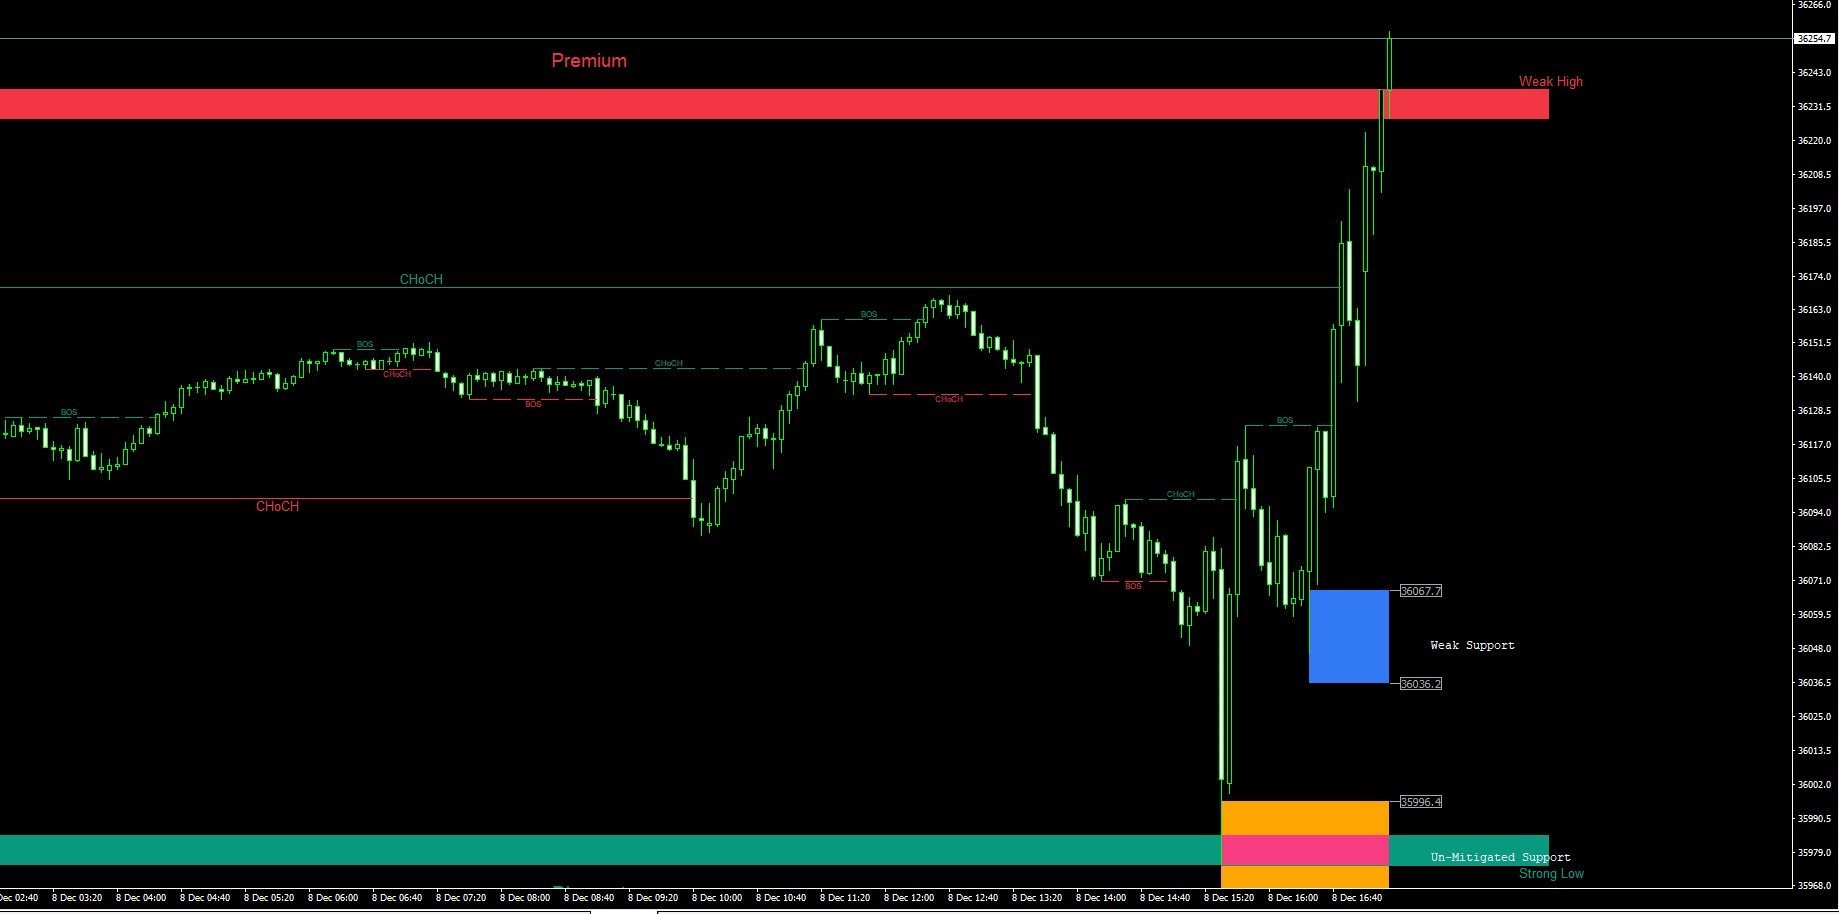
You can also find Premium and Discount Levels, Strong High/Low, Weak High/Low, Change of Character (CHoCH) and Break of Structure (BOS).
You can also find Fair Value Gap (FVG), Daily/Weekly/Monthly High/Low.
There are also alerts that go off when prices enter or break the zone.
You can use this tool to help you trade better.
Wish you the best and have happy trading.
===================Revolutionize Your Trades: Master the Art of Next-Level Profitability! ===================
SMART LIQUIDITY LEVELS - https://www.mql5.com/en/market/product/106020
SMART LIQUIDITY PROFILE - https://www.mql5.com/en/market/product/109841
BREAKOUT POTENTIAL - https://www.mql5.com/en/market/product/108937


SuperB Indicator