Blahtech Better Volume

3

Was: $49  Now: $33  

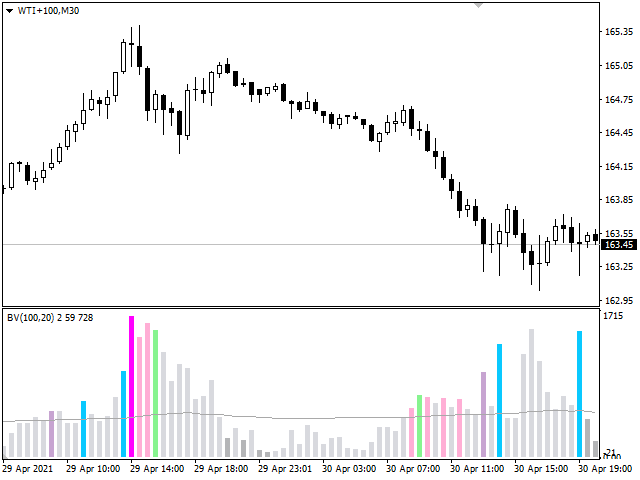
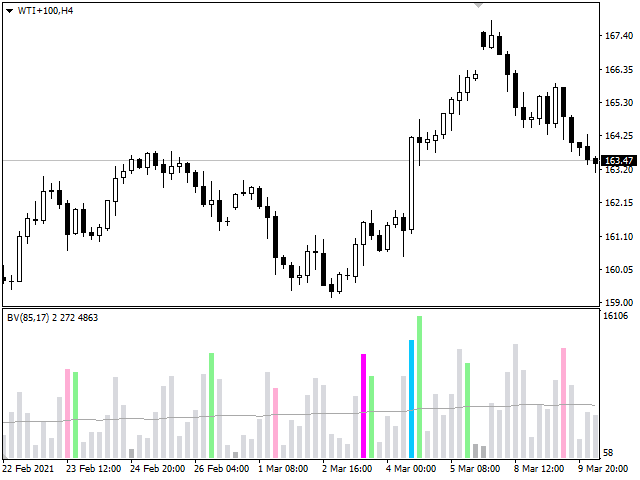
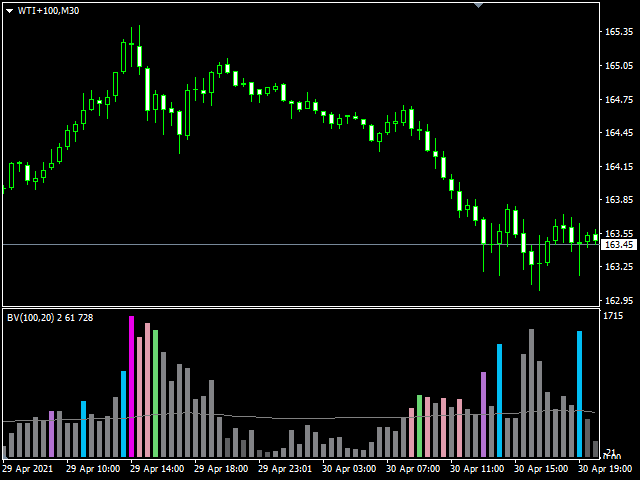
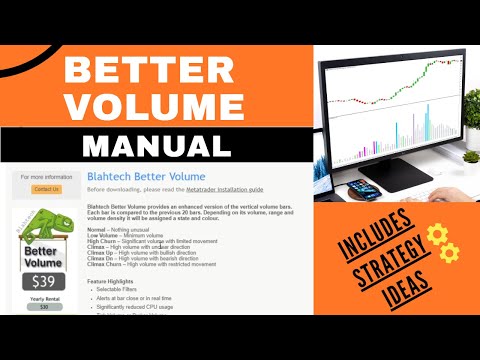
Blahtech Better Volume provides an enhanced version of the vertical volume bars. Each bar is compared to the previous 20 bars. Depending on its volume, range and volume density it will be assigned a state and colour.

  • Low Volume – Minimum volume
  • High Churn – Significant volume with limited movement
  • Climax Neutral – High volume with unclear direction
  • Climax Up – High volume with bullish direction
  • Climax Dn – High volume with bearish direction
  • Climax Churn – High volume with restricted movement

Links [ Install | Update | Documentation & Training ]

Exclusive Features
  • Selectable Filters
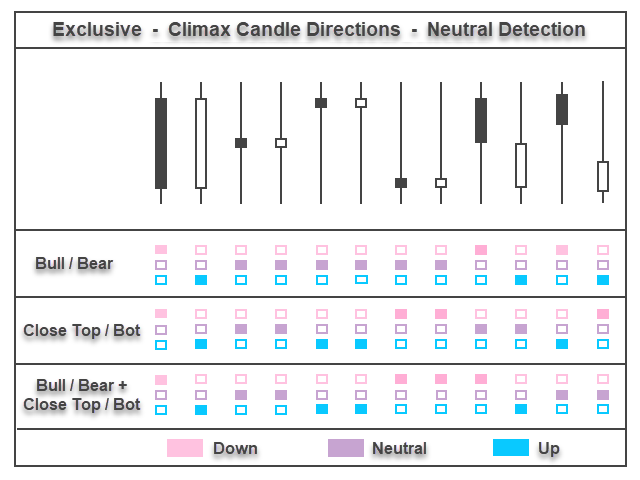
  • Neutral direction detection
  • Alerts at bar close or in real time 
  • Significantly reduced CPU usage
  • Tick Volume or Broker Volume
  • Default colours adjust for black background
  • Periods and Look Backs adjust automatically when switching timeframes
Input Parameters
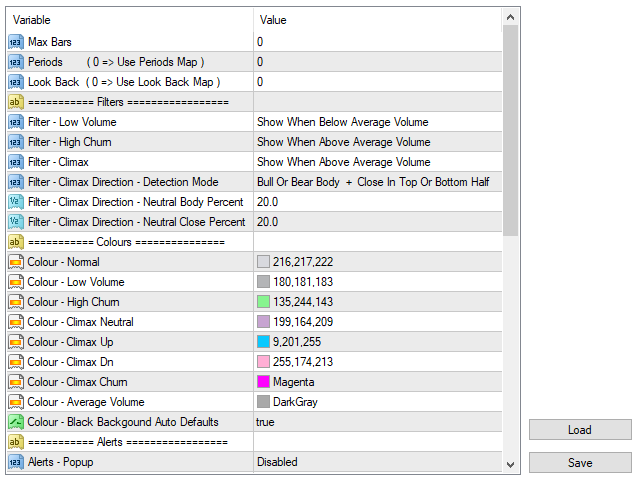
  • Max Bars - Restrict number bars back to plot (0 = All bars)
  • Periods - Bars to use for the Volume Moving Average (0 = Use Period map)
  • Look Back - Bars to search for max and min volumes (0 = Use Lookback map)
Filters

  • Filter – Low Volume - Only highlight bars with less volume than average
  • Filter – High Churn - Only highlight bars with more volume than average
  • Filter – Climax - Only highlight bars with more volume than average
  • Filter – Climax Direction - Detection Mode - Choose the method for deciding the direction of the candle
  • Filter – Climax Direction - Neutral Body Percent - Define when a small candle body is considered to be unclear direction
  • Filter – Climax Direction - Neutral Close Percent - Define size of zone in middle of the candle where the closing price shows no clear direction

Colours

  • Set to taste

Alerts

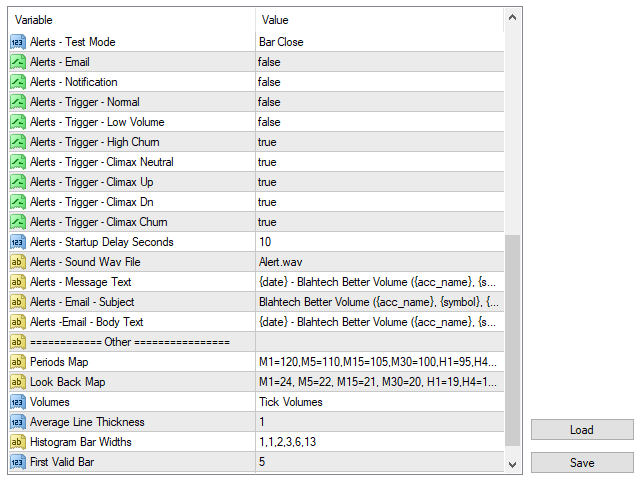
  • Popup - Enable/Disable sound and/or popup dialog for active alerts
  • Test Mode - Select when the indicator checks for alert triggers
  • Email - Enable/disable email for alerts
  • Notification - Enable/disable notifications for alerts

    리뷰 2
    efecetinel
    126
    efecetinel 2021.05.20 22:47 
     

    Perfect. Thank you James.

    추천 제품
    TITAN AI Volume Profile PRO MT4 is an advanced technical indicator designed for professional market analysis, volume profile distribution, and graphical data visualization in MetaTrader 4. Key Features: - Dynamic Volume Profile calculation based on price action and tick volume. - Automatic High Value Area (VAH), Low Value Area (VAL), and Point of Control (POC) detection. - High Volume Nodes (HVN) and Low Volume Nodes (LVN) highlighting. - Integrated Economic Calendar with news alerts. - Built-
    UPD1 Profile Levels
    Vitaliy Kuznetsov
    5 (7)
    표시기는 지정된 막대 수에 대한 작업 히스토그램에서 최대 및 최소 가격 볼륨(시장 프로필)의 수준을 찾습니다.   복합 프로파일. 히스토그램의 높이는 완전 자동이며 모든 기기 및 기간에 맞게 조정됩니다. 저자의 알고리즘이 사용되며 잘 알려진 아날로그를 반복하지 않습니다. 두 히스토그램의 높이는 촛불의 평균 높이와 거의 같습니다. 스마트 경고는 볼륨 레벨에 관한 가격에 대해 알려 도움이 될 것입니다. 개념Smart Money. Low Volume - Imbalance. ,좋은 시장 상황을 찾아 시장의 구조를 결정하고 바이너리 옵션에 대한 필터로 사용됩니다. 그것은 가격에 대한 자석입니다. High Volume - Liquidity. 는 시험을 위해 축적을 나갈 때 사용됩니다. 입력 매개 변수. 기본. Bars Count - 계산 및 표시 할 막대 수. Signal Fractal = 5 (색상 신호 레벨). 수준은 다음과 같은 조건에서 신호가 될 것입니다:그것을 초과하지 않는 상
    BoxChart MT4
    Evgeny Shevtsov
    4.4 (5)
    The market is unfair if only because 10% of participants manage 90% of funds. An ordinary trader has slim changes to stand against these "vultures". This problem can be solved. You just need to be among these 10%, learn to predict their intentions and move with them. Volume is the only preemptive factor that faultlessly works on any timeframe and symbol. First, the volume appears and is accumulated, and only then the price moves. The price moves from one volume to another. Areas of volume accumu
    Paid release: Delta Volume Profile Zones MT4 is a paid MetaCoderStore indicator. Use the product comments for setup questions, feature requests, and feedback for future updates. Delta Volume Profile Zones is a compact volume-profile indicator for traders who want price-level context without turning the chart into a crowded footprint screen. It builds a rolling profile from recent candles and marks the key zones traders usually watch: Point of Control, Value Area High, Value Area Low, high-volume
    RiveR Scope
    Ruslan Losin
    RiverScope automatically determines the nearest most important price levels and support and resistance zones in history, it also identifies a large number of price action patterns (30+). The support and resistance levels are determined based on an algorithm that calculates and filters the historical values of the price, its movement character, volumes, etc. It displays the current situation, therefore the nearest levels change in real time depending on the current price. Advantages flexible cus
    Market Dynamics
    Thomas Bradley Butler
    Market Dynamics는 추세 스캘핑을 위한 것입니다. 파란색이 매수, 빨간색이 매도입니다. 라인은 가격 통합 영역이며 일반 막대 캔들은 결정되지 않았습니다. 가격은 지지선과 저항선 사이에서 통합된 다음 해당 영역에서 가격 움직임이 발생합니다. 두피 위 또는 아래에 그림 영역을 그리고 두피에 대한 주요 트렌드 또는 데이 트레이드를 따르십시오. Market Dynamics는 추세 스캘핑을 위한 것입니다. 파란색이 매수, 빨간색이 매도입니다. 라인은 가격 통합 영역이며 일반 막대 캔들은 결정되지 않았습니다. 가격은 지지선과 저항선 사이에서 통합된 다음 해당 영역에서 가격 움직임이 발생합니다. 두피 위 또는 아래에 그림 영역을 그리고 두피에 대한 주요 트렌드 또는 데이 트레이드를 따르십시오.
    기본 설명 Binary Adaptive Trend Cross 는 이동 평균 교차와 트렌드 필터링을 기반으로 정확한 진입 시점을 판단하는 지표입니다. 구매 신호( 파란색 화살표)와 판매 신호( 빨간색 화살표)를 표시하며, 알림 기능도 지원합니다.   주요 특징 시장 조건에 따른 자동 최적화 거짓 신호를 줄이는 트렌드 필터 유연한 신호 생성 설정 알림 및 푸시 알림 기능 수동 및 알고리즘 트레이딩 호환   설정 옵션   기본 설정 파라미터 설명 기본값 LevelEn 첫 번째 SMMA(평활 이동 평균, 종가 기준) 기간 3 TradeTer 두 번째 SMMA(평활 이동 평균, 시가 기준) 기간 3 SignalOn 신호 생성 타이밍: 0   – 현재 캔들 1   – 다음 캔들 0   알림 설정 파라미터 설명 EnableAlerts 알림 활성화 EnableSound 소리 알림 EnableNotifications 푸시 알림   트렌
    History Pattern Search
    Yevhenii Levchenko
    표시기는 현재 시세를 작성하여 과거 시세와 비교할 수 있으며 이를 바탕으로 가격 변동을 예측합니다. 표시기에는 원하는 날짜로 빠르게 이동할 수 있는 텍스트 필드가 있습니다. 옵션: 기호 - 표시기가 표시할 기호 선택. SymbolPeriod - 지표가 데이터를 가져올 기간 선택. IndicatorColor - 표시기 색상. HorisontalShift - 지시자가 그린 따옴표를 지정된 막대 수만큼 이동합니다. Inverse - true는 인용 부호를 반대로, false - 원래 보기를 반전합니다. ChartVerticalShiftStep - 차트를 수직으로 이동합니다(키보드의 위/아래 화살표). 다음은 날짜를 입력할 수 있는 텍스트 필드의 설정으로, '엔터'를 누르면 즉시 이동할 수 있습니다.
    CumulativeDeltaBars
    Stanislav Korotky
    This indicator is a conventional analytical tool for tick volumes changes. It calculates tick volumes for buys and sells separately, and their delta on every bar, and displays volumes by price clusters (cells) within a specified bar (usually the latest one). The algorithm used internally is the same as in the indicator VolumeDelta , but results are shown as cumulative volume delta bars (candlesticks). Analogous indicator for MetaTrader 5 exists - VolumeDeltaBars . This is a limited substitution
    볼륨 프로파일 스나이퍼 11.1 은 포괄적 인 시장 분석 도구입니다 거래에 대한 전문적인 접근 방식 볼륨 프로파일 스나이퍼 11.1 은 시장 상황의 포괄적 인 평가를 기반으로 명확한 신호를 제공,하나의 지표에 15 개 이상의 키 필터를 결합합니다. 주요 특징 볼륨 불균형 분석-알고리즘은 각 촛불에서 구매자와 판매자의 점유율을 계산하여 당사자 중 한 사람의 우위를 나타냅니다(구성 가능한 임계 값은 50%에서 90%까지). 다단계 신호 필터링-표시기가 고려됩니다: 2015 년 11 월 1 일 과매수/과매도 영역을 제외한 캔들 패턴(핀 바,흡수,망치) 지원/저항 레벨(자동 감지) 주요 플레이어의 활동을 식별하는 볼륨 스파이크 고전적이고 증폭 된 발산 변동성 평가 트렌드 강도를 결정하기 위한 애드엑스 가격 조치(내부 및 외부 막대) 다중 기간 확인 시장 구조(높은 최고/낮은 최저) 세션 필터(아시아,런던,뉴욕 세션) 뉴스 배출으로부터 보호 유연한 구성 시스템-
    Volume Compair
    Thiago Pereira Pinho
    5 (1)
    Professional Cumulative Delta & Volume Median Indicator Track   real buying/selling pressure   with this powerful volume analysis tool. The   Volume Compare Indicator   combines   Cumulative Delta   and   Volume Medians   to help you identify institutional activity, imbalances, and potential reversals. Key Features: Cumulative Delta Histogram   – Visualizes net buying vs. selling volume in real-time. Buy/Sell Volume Medians   – Horizontal lines showing average buy & sell volume levels. Smart Vo
    Apollo SR Master
    Oleg Rodin
    5 (3)
    Apollo SR Master는 지지/저항 구간에서의 거래를 더욱 쉽고 안정적으로 만들어 주는 특수 기능을 갖춘 지지/저항 지표입니다. 이 지표는 지역 가격의 고점과 저점을 감지하여 시간 지연 없이 실시간으로 지지/저항 구간을 계산합니다. 새롭게 형성된 저항 구간을 확인하기 위해 지표는 해당 저항 구간을 실제 매도 또는 매수 신호로 활용할 수 있음을 나타내는 특수 신호를 표시합니다. 이 경우, 저항 구간의 강도가 높아지고, 따라서 저항 구간에서의 성공적인 거래 가능성도 높아집니다. 이것이 바로 이 지표의 핵심 아이디어입니다. SR 존은 손절매와 이익실현을 더욱 쉽게 할 수 있도록 해줍니다. 신호 방향에 따라 SR 존 위 또는 아래 공간을 손절매로 활용할 수 있습니다. 또한, 반대쪽 SR 존은 잠재적 이익실현 영역으로 활용할 수 있습니다. 또한 Apollo SR Master 지표를 사용하는 모든 사용자에게 "Apollo Price Action System" 지표를 무료로 제공합니다.
    AQ XFifteen Pro
    HIT HYPERTECH INNOVATIONS LTD
    Χ15 indicator is a MetaTrader 4 tool that allows you to  BUILD & BACKTEST ON REAL TIME  your own strategies quickly, easily and efficiently. It contains  15 of the most popular technical analysis indicators  that you can use, each one in a different way. Choose the indicators that you want to use, select how you will use them and you will see on the chart BUY (green) and SELL (red) arrows implementing your strategy. Choose Take Profit and Stop Loss and you will see the results of your strategy w
    Profit Factor
    Dmitriy Moshnin
    The Profit Factor indicator calculates one of the three parameters: 1 - market entry level (in the 'Calculate the' parameter - Market Open Trade), 2 - the Stop Loss level (Calculate the - Market Price Loss), 3 - the Take Profit level (Calculate the - Market Price Profit) - with a desired profit/loss ratio (Profit Factor), as well as the lot size (trade volume) according to the value of the risk percentage of available funds specified in the settings (a simpler analog is the Lot Calculation indic
    AQ XFifteen
    HIT HYPERTECH INNOVATIONS LTD
    4 (7)
    Χ15 indicator is a MetaTrader 4 tool that allows you to BUILD & BACKTEST ON REAL TIME your own strategies quickly, easily and efficiently. It contains 15 of the most popular technical analysis indicators that you can use, each one in a different way. Choose the indicators that you want to use, select how you will use them and you will see on the chart BUY (green) and SELL (red) arrows implementing your strategy. Choose Take Profit and Stop Loss and you will see the results of your strategy with
    FREE
    Aspara111
    Gesang Pangestu
    This indicator allows you to trade binary options and specially programmed to get the momentum to follow the trend that is happening in the live market. This indicator is based on trend strength, price correction and advanced technical analysis,this is 100% NO REPAINT. This indicators specifically for manual trading, I suggest using a platform that uses an expiration time    Timeframe : M1 or M5 Expired Time : 1 Candle Pair   : Any ( even better in the CAD market ) Time Session : Europe and NewY
    Simply The Best Pro
    Szymon Palczynski
    5 (1)
    This indicator displays the histogram and arrows on chart. When Simple The Best Pro are placed on a chart, they identify the trend.  The color of may be blue or red. The blue color stands for upside moves and the red color stands for downside trends. The indicator offers to set Stop Loss (SL) and  Take Profit (TP)  setting. The default value is ATR. Indicator has automatic optimization. The STB is a unique indicator that shows the tendency (button Bars) of a particular signals. The STB tells us
    A technical indicator that calculates its readings on trading volumes. In the form of a histogram, it shows the accumulation of the strength of the movement of the trading instrument. It has independent calculation systems for bullish and bearish directions. Works on any trading instruments and time frames. Can complement any trading system. The indicator does not redraw its values, the signals appear on the current candle. It is easy to use and does not load the chart, does not require addition
    Blahtech Market Profile
    Blahtech Limited
    4.53 (15)
    Was: $249  Now: $99   Market Profile defines a number of day types that can help the trader to determine market behaviour. A key feature is the Value Area, representing the range of price action where 70% of trading took place. Understanding the Value Area can give traders valuable insight into market direction and establish the higher odds trade. It is an excellent addition to any system you may be using. Blahtech Limited presents their Market Profile indicator for the MetaTrader community. Ins
    MarketProfile EForex
    Veridiana Adorno Kendrick
    Market Profile Shows where the price has spent more time, highlighting important levels that can be used in trading. It is a powerful tool which is designed to take the fundamental components which comprise every market; price/volume/time, and visually display their relationship in real-time as the market develops for a pre-determined time period. Very powerful tool!
    Time Bubble
    Ahmed Mohamed
    Time Bubble ***Specialized for GBPJPY 1H time frame*** (tested for two years with success rates about 82%) Time Circle's smart algorithm detects the price circles with time . give strong signals at the right time as result of combine the price and time. our team spent months to develop this indicator specially for GBPJPY ..with high success rates about 82% win trades over two years .tested from December 2016 to November 2018. *** in last two years total signals 1012 with 829 Wins and 183 Lo
    Donchian Time Sync Analyzer는   기존 Donchian 채널 분석에 강력한   다중 시간대   기능을 추가하여 트레이더가 다섯 가지 차트 기간에 걸쳐   추세 강도   와 잠재적   반전 신호를   동시에 모니터링할 수 있도록 합니다. 이 고급 지표는 선택한 시간대의 최고가와 최저가를 계산하여 여러 시간대에 걸쳐 추세 방향의 수렴을 파악하는 데 도움이 되는   명확한 시각적 신호를   생성합니다. 분 단위부터 시간 단위까지 통합된 분석을 제공함으로써 단일 시간대 도구보다 더 심층적인 시장 통찰력을 제공하여 트레이더가   중요한 돌파를 확인   하고 시간대 확인을 통해   잘못된 신호를 피할 수 있도록   지원합니다. 핵심 기능 이 정교한 도구는 검증된   돈키안 채널 전략을   여러 시간대에 걸쳐 동시에 적용하여 단기 가격 변동이 장기 추세와 일치하는지 여부를 보여주는 동기화된 신호를 표시합니다. 이 시스템은 선택한 시간대에서 가격이 중요한 지지선 또는 저항선
    Volume Delta Scanner MT4
    Mariusz Franciszek Szczepanczyk
    볼륨 델타 스캐너 MT4 Volume Delta Scanner는 MetaTrader 4용 실시간 시장 분석 지표로, 단일 패널에서 여러 종목과 시간대를 동시에 모니터링합니다. 차트를 수동으로 전환할 필요 없이, 관심 종목 전체의 매수 및 매도 압력을 한눈에 즉시 파악할 수 있습니다. 이 지표는 거래량 차이(Volume Delta) 논리를 기반으로 구축되었으며, 캔들 구조와 틱 거래량을 바탕으로 매수 압력과 매도 압력의 차이를 계산하여 사용자가 모니터링하고자 하는 모든 종목과 시간대에 대한 시장 지배력을 직접적이고 필터링 없이 보여줍니다. 패널에 보이는 내용 패널에는 심볼이 행별로 나열된 깔끔한 표가 표시됩니다. 각 행에는 심볼 이름과 두 개의 신호 열, 그리고 다섯 개의 시간 프레임 열이 있습니다. 각 셀은 세 가지 상태 중 하나를 나타냅니다. 녹색 삼각형 — 매수 압력이 우세한 빨간색 삼각형 — 매도 압력이 지배적입니다 — 중립적 — 뚜렷한 지배력 없음, 시장은
    Master Volume profile
    Israr Hussain Shah
    Money Flow Profile MT5 HERE   Here   our more valuable tools SMC Trend Trading   ,  Easy SMC Trading  ,  Institutional SMC Architect Volume Analysis Tools  ,  Volume flow Profile  ,  Market volume profile  , FVG with Volume  , Liquidity Heatmap Profile  ,  Volume Spread Analysis This Master Edition is engineered for clarity and speed, featuring a unique Auto-Theme Sync system that instantly beautifies your chart layout upon loading. Key Features: True Money Flow Calculation: Goes beyond stand
    MR Volume Profile 4
    Sergey Khramchenkov
    The "MR Volume Profile 4" indicator is a charting tool that displays trading volume at different price levels rather than time intervals. A key concept in volume profile is the point of control (POC)—the price level with the highest volume traded during the session or time range. While tools like VWAP or OBV provide volume trends, the "MR Volume Profile 4" indicator offers granular detail about where the most market activity occurs at specific price levels. This makes it a more precise tool for
    VR Grid
    Vladimir Pastushak
    5 (3)
    VR 그리드 표시기는 사용자 정의 설정으로 그래픽 그리드를 생성하도록 설계 되었습니다. 표준 그리드 와 달리 VR 그리드는 원형 레벨 을 구축하는 데 사용됩니다. 사용자의 선택에 따라 라운드 수준 사이의 단계는 임의적일 수 있습니다. 또한 VR Grid는 다른 인디케이터나 유틸리티와는 달리 기간이 바뀌거나 단말기를 재부팅해도 그리드의 위치 를 유지합니다. 설정, 세트 파일, 데모 버전, 지침, 문제 해결 등은 다음에서 얻을 수 있습니다. [블로그] 다음에서 리뷰를 읽거나 작성할 수 있습니다. [링크] 버전 [MetaTrader 5] 수직 수준 은 실제 시간 간격을 기준으로 하며 누락 또는 존재하지 않는 기간은 무시 합니다. 따라서 레벨 사이의 단계는 사용자가 선택한 값과 엄격하게 일치합니다. VR 그리드 표시기를 사용할 때 트레이더는 모든 수준에서 스타일 , 수직선 및 수평선의 색상 및 두께를 변경할 수 있습니다. 이를 통해 금융 상품의 라운드 수준 을 제어할 수 있습니다. 라운
    FREE
    The Super Arrow Indicator provides non-repainting buy and sell signals with exceptional accuracy. Key Features No repainting – confirmed signals remain fixed Clear visual arrows: green for buy, red for sell Real-time alerts via pop-up, sound, and optional email Clean chart view with no unnecessary clutter Works on all markets: Forex, gold, oil, indices, crypto Adjustable Parameters TimeFrame Default: "current time frame" Function: Sets the time frame for indicator calculation Options: Can be set
    BarsOldTimeframes
    Victor Krupinskiy
    The BarsOldTimeFrame indicator is designed to analyze bar formation on a higher timeframe, projecting bars from it onto the current timeframe. The indicator draws higher timeframe bars on the current chart as rectangles with filled candlestick bodies and transparent shadows. The higher timeframe and fill colors for bullish and bearish bar bodies are selected in the settings.
    Binary sixty scalping
    Roman Lomaev
    4 (3)
    Binary Sixty Scalping – MT4용 바이너리 옵션 지표 Binary Sixty Scalping은 MT4 플랫폼용으로 특별히 설계된 바이너리 옵션 거래 지표입니다. 모든 시간 프레임에서 사용할 수 있지만 더 높은 정확도를 위해 M5 이상의 시간 프레임을 사용하는 것이 좋습니다. 모든 통화쌍과 호환되며 다양한 시장에 적응할 수 있습니다. 주요 특징: 기본 만료 시간 – 1 캔들 (설정에서 조정 가능); 추세 기반 거래 : 지표가 추세 방향을 분석하고 최적의 진입점을 찾아 신호를 제공합니다; 캔들 마감 전에 정확한 신호 : 차트에 화살표를 표시하며, 파란색은 매수, 빨간색은 매도를 나타냅니다; 신호 통계 : 신호의 성공률 통계를 표시하여 지표의 효과를 평가하는 데 도움이 됩니다; 리페인트 없음 : 신뢰할 수 있고 안정적인 신호를 제공합니다. 설치 가이드: 정상적인 작동을 위해 "MQL5" 폴더를 터미널의 루트 폴더에 복사하십시오. 파일 다운로드: Yandex Disk .
    Super IA Sniper Volume PRO
    Antonio Augusto Mello Couto
    SUPER IA SNIPER – VOLUME PRO (MT4) Super IA Sniper – Volume PRO is an advanced volume and price-behavior analysis indicator , designed to identify high-probability short-term reversal conditions based on qualified volume events , using closed candles only (NO REPAINT) . It was built for traders who demand precision, transparency, and real statistical validation , eliminating random signals and purely subjective market interpretations. WHAT THE INDICATOR ANALYZES The indicator continuously
    이 제품의 구매자들이 또한 구매함
    Trend SniperX MT4
    Sarvarbek Abduvoxobov
    5 (3)
    Trend Sniper X 는 트레이더가 명확하고 정확하게 트렌드 방향과 잠재적 반전 지점을 포착할 수 있도록 돕는 MetaTrader 5 전용 멀티 타임프레임 추세 추종 지표입니다. MT5 버전 링크: https://www.mql5.com/en/market/product/181101 가격 안내: 현재 가격은 프로모션 할인가이며, 향후 업데이트 및 새 기능 출시 시 인상될 수 있습니다. Code2Profit 채널 멀티 타임프레임 분석으로 시장을 정복하세요! Trend Sniper X로 승률을 극대화하는 방법: 핵심 규칙 및 세션 팁 기술 사양 플랫폼 MetaTrader 5 지표 유형 멀티 타임프레임 추세 지표 작동 타임프레임 모든 차트 타임프레임 (상위 타임프레임 M1–MN1 독립 선택 가능) 주요 종목 외환(Forex), 골드(XAUUSD) 및 기타 CFD 추천 계좌 모든 계좌 유형 시각화 컬러 추세 캔들 (매수/매도/약세/변화) + 매수/매도 화살표 추가 모듈 세션 마켓 박스 (
    Miraculous Indicator Binary & Forex v3 StrategySafe Miraculous Indicator Binary & Forex v3 StrategySafe 는 명확한 신호, 강력한 확인 도구, 그리고 Binary 및 Forex 시장에서 사용할 수 있는 체계적인 거래 방식을 원하는 트레이더를 위한 전문 지표입니다. v3 버전에는 MIR Dashboard, Miraculous Confirmation Dashboard, GANN Law, Square of 9 레벨, GANN 각도, 그리고 더욱 강화된 Forex 모드가 포함되어 있습니다. 주요 기능 Binary 모드와 Forex 모드를 하나의 지표에서 지원. MIR Dashboard로 빠른 시장 흐름 확인. Miraculous Confirmation Dashboard로 진입 신호 확인. Forex 분석을 위한 GANN Law drawing lines. Square of 9 라인, 레벨, 방향 표시. 1x1 G
    Zoryk Gold mt4
    Reda El Koutbane
    5 (2)
    ZORYK — MetaTrader 4용 XAUUSD 전문 신호 및 트레이드 플래닝 시스템 이런 경험이 있을 것입니다. 골드를 분석하고 진입을 기다린 뒤 마침내 포지션을 열었지만 가격이 곧바로 반대 방향으로 움직입니다. 너무 일찍 청산하거나 Stop Loss를 옮기거나 몇 초 동안 망설입니다. 그 후 시장은 내가 없이도 처음 예상했던 목표까지 정확히 움직입니다. 문제는 항상 방향이 아니었습니다. 진짜 문제는 불확실성이었습니다. 정확한 진입 위치를 몰랐습니다. 어느 지점에서 원래의 트레이드 아이디어가 무효가 되는지 몰랐습니다. 가까운 수익을 확보해야 할지 더 큰 움직임을 기다려야 할지 판단하기 어려웠습니다. 현재 setup이 정말 강한지 아니면 단지 새로운 거래를 억지로 찾고 있는지도 확신하기 어려웠습니다. 골드는 매우 빠르게 움직입니다. 명확한 계획이 없다면 좋은 분석도 몇 초 만에 나쁜 결정으로 바뀔 수 있습니다. ZORYK는 이 문제를 해결하기 위해 개발되었습니다.
    SR Liquidity
    Oleg Rodin
    5 (2)
    SR Liquidity 는 시장 유동성이 집중되고 가격이 가장 강력하게 반응하는 숨겨진 구간을 포착하도록 설계된 트레이딩 지표입니다. 이러한 특수 유동성 구간은 강력한 지지 및 저항선 역할을 하며, 시장 반전 가능성이 가장 높은 지점을 명확하게 보여주는 지도가 되어 줍니다. SR Liquidity는 일반적인 지지 및 저항선을 단순히 그리는 대신, 실제 가격 움직임을 분석하여 매수 및 매도 압력이 집중되는 구간을 포착합니다. 이러한 구간은 실질적인 시장의 흐름을 주도하는 유동성 풀(liquidity pools)에 해당합니다. 이 지표는 해당 구간을 차트에 직접 시각화하여, 가격 반응이 실제로 나타나기 전에 이를 미리 예측할 수 있도록 돕습니다. 즉, 가격 추세가 전환될 가능성을 사전에 파악하게 해주는 것입니다. 결과적으로 이 지표는 가공되지 않은 가격 움직임(price action)을 시장의 핵심 가격대, 다시 말해 추세 전환점이 될 수 있는 지점들을 보여주는 명확하고 실용적인 로드맵
    Gann Made Easy
    Oleg Rodin
    4.84 (172)
    Gann Made Easy 는 mr.의 이론을 사용하여 최고의 거래 원칙을 기반으로 하는 전문적이고 사용하기 쉬운 Forex 거래 시스템입니다. W.D. 간. 이 표시기는 Stop Loss 및 Take Profit Levels를 포함하여 정확한 BUY 및 SELL 신호를 제공합니다. PUSH 알림을 사용하여 이동 중에도 거래할 수 있습니다. 구매 후 거래 방법 안내 및 유용한 추가 지표를 무료로 받으시려면 저에게 연락주세요! 아마도 Gann 거래 방법에 대해 이미 여러 번 들었을 것입니다. 일반적으로 Gann의 이론은 초보자 거래자뿐만 아니라 이미 거래 경험이 있는 사람들에게도 매우 복잡한 것입니다. Gann의 거래 방식은 이론적으로 적용하기 쉽지 않기 때문입니다. 나는 그 지식을 연마하고 Forex 지표에 최고의 원칙을 적용하기 위해 몇 년을 보냈습니다. 표시기는 적용하기가 매우 쉽습니다. 차트에 첨부하고 간단한 거래 권장 사항을 따르기만 하면 됩니다. 지표는 지속적으로 시장 분석
    PTS Precision Index Oscillator V2
    PrecisionTradingSystems
    5 (1)
    프리시전 트레이딩 시스템의 로저 메드칼프에 의한 프리시전 인덱스 오실레이터 (Pi-Osc) 버전 2는 차트에 신속하게 로드되도록 주의 깊게 다시 코딩되었으며 경험을 향상시키기 위해 몇 가지 다른 기술적 개선 사항이 통합되었습니다. Pi-Osc는 정확한 거래 타이밍 신호를 제공하도록 개발되었으며 시장이 모든 사람의 스톱을 청산하기 위해 가야 하는 극도의 고갈 지점을 찾는 데 목적이 있습니다. 이 제품은 극단적인 지점이 어디에 있는지 알고 있는 고전적인 문제를 해결하며 트레이더로서의 삶을 훨씬 간단하게 만듭니다. 이것은 업계 표준 오실레이터와는 상당히 다른 강력한 차이점을 가지고 있는 고도로 복잡한 합의 지표입니다. 사용하는 기능 중 일부는 수요 지수, 자금 흐름, RSI, 스토캐스틱, 패턴 인식, 거래량 분석, 표준 편차 극단점 및 다양한 길이에서 위와 유사한 변형을 갖습니다. 미숙한 눈에는 다른 오실레이터와 비슷해 보일 수 있지만 RSI 또는 모멘텀과 같은 다른 오실레이
    Tokyo mt4 Indicator
    Vasiliy Strukov
    5 (2)
    Tokyo Indicator는 추세 방향, 잠재적 거래 신호 및 시장 상황을 명확하고 시각적으로 보여줍니다. 색상으로 구분된 계단식 추세선은 강세 구간(파란색)과 약세 구간(자홍색)을 명확히 구별해 줍니다. 추세가 전환될 때 나타나는 방향성 화살표는 잠재적인 매수 및 매도 기회를 강조하여 보여줍니다. 통합 대시보드는 현재 신호, 시장 성향(bias), 모멘텀, 변동성, 신호 품질 등의 정보를 한눈에 파악할 수 있도록 구성되어 있습니다. 이를 통해 트레이더는 별도의 패널을 오갈 필요 없이 가격 움직임(price action)과 지표의 데이터를 동시에 분석할 수 있습니다. 깔끔한 차트 화면과 간결한 시장 개요를 제공하는 Tokyo Indicator는 체계적인 추세 분석과 거래 결정을 지원합니다. 모든 시간대와 다양한 자산(특히 금)에서 활용할 수 있습니다. 추세 방향, 잠재적 거래 신호 및 시장 상황을 명확하고 시각적으로 보여줍니다. 색상으로 구분된 계단식 추세선은 강세 구간(파란색)
    DayTrader PRO MT4
    Davit Beridze
    4.6 (10)
    DayTrader PRO MT5:  https://www.mql5.com/en/market/product/186222 DayTrader PRO는 존 에러스(John Ehlers)의 Laguerre 필터와 강력한 자동 최적화 엔진을 결합한 고급 트레이딩 지표입니다. 고정된 파라미터를 사용하는 대신, 최근 시장 상황을 바탕으로 최적의 설정을 자동으로 검색하므로 지속적인 수동 조정 없이도 변화하는 시장 변동성에 대응할 수 있습니다. 이 지표는 명확한 매수(BUY) 및 매도(SELL) 신호를 생성하며, 현재 시장 변동성을 기준으로 계산된 적응형 손절매(Stop Loss) 및 익절(Take Profit) 레벨을 제공합니다. 내장된 추세, 효율성 지수(Efficiency Ratio), 변동성 및 캔들 필터 기능은 저품질의 진입 신호를 제거하여 신호의 정확도를 높여줍니다. 실시간 성능 대시보드에서는 현재 최적화된 설정값, 수익 요인(Profit Factor), 승률(Win Rate), 최대 낙폭
    Currency Strength Wizard
    Oleg Rodin
    4.85 (61)
    통화 강도 마법사는 성공적인 거래를 위한 올인원 솔루션을 제공하는 매우 강력한 지표입니다. 표시기는 여러 시간 프레임의 모든 통화 데이터를 사용하여 이 또는 해당 외환 쌍의 힘을 계산합니다. 이 데이터는 특정 통화의 힘을 확인하는 데 사용할 수 있는 사용하기 쉬운 통화 지수 및 통화 전력선의 형태로 표시됩니다. 필요한 것은 거래하려는 차트에 표시기를 부착하는 것뿐입니다. 표시기는 거래하는 통화의 실제 강세를 보여줍니다. 지표는 또한 추세와 거래할 때 유리하게 사용할 수 있는 구매 및 판매 거래량 압력의 극한값을 보여줍니다. 지표는 또한 피보나치에 기반한 가능한 대상을 보여줍니다. 표시기는 PUSH 알림을 포함한 모든 유형의 알림을 제공합니다. 구매 후 연락주세요. 나는 당신과 거래 팁을 공유하고 당신에게 무료로 훌륭한 보너스 지표를 줄 것입니다! 나는 당신에게 행복하고 유익한 거래를 기원합니다!
    CRT Candle Range Theory HTF MT4 - Ultimate CRT Indicator: 고급 ICT 개념 및 Malaysian SnR 트레이딩 시스템 가장 진보된 Candle Range Theory 지표로 마켓 메이커의 발자취를 마스터하십시오. Ultimate CRT Indicator를 사용하여 Smart Money Concepts(SMC)의 진정한 힘을 발휘하고 기관처럼 정확하게 거래하십시오. 진지한 트레이더를 위해 독점적으로 제작된 이 지표는 ICT Concepts(Inner Circle Trader)의 핵심 기둥인 매우 효과적인 Candle Range Theory(CRT)를 자동화하고 Malaysian Support and Resistance(SnR) 진입 방법과 FVG(Imbalance) 영역의 치명적인 정밀도로 이를 강화합니다. MT4 또는 MT5에서 Forex, Crypto 또는 지수를 거래하든 이 알고리즘은 시장 소음을 제거하고 가짜 돌파(fakeout)
    M1 Sniper
    Oleg Rodin
    4.97 (30)
    M1 SNIPER 는 사용하기 쉬운 거래 지표 시스템입니다. M1 시간대에 맞춰 설계된 화살표 지표입니다. 이 지표는 M1 시간대 스캘핑을 위한 단독 시스템으로 사용할 수 있으며, 기존 거래 시스템의 일부로도 사용할 수 있습니다. 이 거래 시스템은 M1 시간대 거래용으로 특별히 설계되었지만, 다른 시간대에도 사용할 수 있습니다. 원래는 XAUUSD와 BTCUSD 거래를 위해 이 방법을 설계했지만, 다른 시장 거래에도 유용하다는 것을 알게 되었습니다. 이 지표의 신호는 추세 방향과 반대로 거래될 수 있습니다. 저는 지표의 신호를 활용하여 양방향으로 거래할 수 있도록 돕는 특별한 거래 기법을 알려드립니다. 이 방법은 특별한 동적 지지선과 저항선 가격 영역을 활용하는 것을 기반으로 합니다. 구매하시면 M1 SNIPER 화살표 지표를 바로 다운로드하실 수 있습니다. 또한, 아래 스크린샷에 표시된 Apollo Dynamic SR 지표는 M1 SNIPER 도구를 사용하는 모든 사용자에게 무료로
    PRO Renko System
    Oleg Rodin
    5 (31)
    PRO Renko System 은 RENKO 차트 거래를 위해 특별히 고안된 매우 정확한 거래 시스템입니다. 이것은 다양한 거래 상품에 적용될 수있는 보편적 인 시스템입니다. 체계는 효과적으로 당신에게 정확한 반전 신호에 접근을 주는 소위 시장 소음을 중화합니다. 이 표시기는 사용하기가 매우 쉽고 신호 생성을 담당하는 매개 변수가 하나만 있습니다. 당신은 쉽게 당신의 선택의 어떤 무역 계기에 공구를 적응시킬 수 있고 renko 막대기의 크기. 나는 항상 당신이 내 소프트웨어로 수익성있게 거래 할 수 있도록 추가 지원을 제공 할 준비가되어 있습니다! 나는 당신에게 행복하고 수익성있는 거래를 기원합니다! 구매 후 저에게 연락하십시오! 내 렌코 차트 생성기를 보내드립니다. 또한 내 개인 권장 사항 및 시스템의 다른 모듈을 무료로 공유 할 것입니다!
    PZ Swing Trading
    PZ TRADING SLU
    5 (3)
    Protect against whipsaws: revolutionize your swing trading approach Swing Trading is the first indicator designed to detect swings in the direction of the trend and possible reversal swings. It uses the baseline swing trading approach, widely described in trading literature. The indicator studies several price and time vectors to track the aggregate trend direction and detects situations in which the market is oversold or overbought and ready to correct. [ Installation Guide | Update Guide | Tro
    This is a professional chart indicator designed for traders focused on stability and clear price action. It helps filter market noise and provides clear visual entry and exit zones for your trading decisions. Core Features: Strictly Non-Repainting: The system is built with strict non-repaint logic. What you see on the chart is the true historical performance. Confirmed Signals: Signals are triggered and confirmed only after the candle closes . Once a trading arrow appears on a closed candle, it
    Trend Catcher ind
    Ramil Minniakhmetov
    5 (11)
    트렌드 캐처 인디케이터 트렌드 캐처 인디케이터는 개발자가 자체 개발한 맞춤형 적응형 트렌드 분석 지표들을 조합하여 시장 가격 움직임을 분석합니다. 단기적인 노이즈를 제거하고 근본적인 모멘텀 강도, 변동성 확대, 가격 구조 움직임에 집중하여 진정한 시장 방향을 파악합니다. 또한 이동 평균, RSI, 변동성 필터와 같은 맞춤형 지표들을 활용하여 가격을 평활화하고 트렌드를 필터링합니다. 실제 운영 모니터링 및 기타 제품은 다음 링크에서 확인하실 수 있습니다: https://www.mql5.com/en/users/mechanic/seller 텔레그램에서는 EA나 설정 파일을 판매하지 않습니다. 사기이니 주의하세요. 모든 설정 파일은 블로그에서 무료로 제공됩니다. 중요! 구매 후 즉시 연락 주시면 사용 방법 및 보너스를 드립니다!
    Smart Trend Trading System
    Issam Kassas
    4.8 (10)
    이 제품은 2026년 시장에 맞게 업데이트되었으며 최신 MT5 빌드에 최적화되었습니다. 가격 업데이트 안내: Smart Trend Trading System은 현재 $99 에 제공됩니다. 다음 30회 구매 후 가격은 $199 로 인상됩니다. 특별 혜택: Smart Trend Trading System 구매 후 저에게 개인 메시지를 보내시면 Smart Universal EA를 무료 로 받을 수 있으며, Smart Trend 신호를 자동 거래로 전환할 수 있습니다. Smart Trend Trading System은 리페인트 없음, 재그리기 없음, 지연 없음의 완전한 트레이딩 시스템으로, 더 깨끗한 신호, 더 나은 추세 방향, 그리고 더 체계적인 시장 거래 방식을 원하는 트레이더를 위해 제작되었습니다. Online course , manual and [download presets] . 이 시스템은 추세 감지, 반전 구간, Smart Cloud, 트레일링 스톱 로직, 지지와 저항, 캔들
    Quantum Naked SMC Prime is a streamlined Smart Money Concepts indicator designed for traders who prefer a clean chart, structured market analysis and clear visual trade setups without unnecessary complexity. The indicator combines market structure, liquidity behavior, institutional zones and confirmation logic into a compact analytical framework. Instead of flooding the chart with technical indicators, Quantum Naked SMC Prime focuses on the core elements of price action and Smart Money Concepts.
    Advanced Currency IMPULSE with ALERT
    Bernhard Schweigert
    4.9 (491)
    현재 40% 할인!! 초보자 또는 전문가 트레이더를 위한 최고의 솔루션! 이 지표는 우리가 독점 기능과 비밀 공식을 통합했기 때문에 독특하고 고품질이며 저렴한 거래 도구입니다. 단 하나의 차트로 28개 통화 쌍 모두에 대한 경고를 제공합니다. 새로운 추세 또는 스캘핑 기회의 정확한 트리거 포인트를 정확히 찾아낼 수 있기 때문에 거래가 어떻게 개선될지 상상해 보십시오! 새로운 기본 알고리즘을 기반으로 구축되어 잠재적인 거래를 훨씬 더 쉽게 식별하고 확인할 수 있습니다. 이는 통화의 강세 또는 약세가 가속되는지 여부를 그래픽으로 표시하고 가속 속도를 측정하기 때문입니다. 자동차의 속도계처럼 생각하면 됩니다. 가속화할 때 Forex 시장에서 동일한 일이 분명히 더 빠르게 발생합니다. 즉, 반대 방향으로 가속화되는 통화를 페어링하면 잠재적으로 수익성 있는 거래를 식별한 것입니다. 통화 모멘텀의 수직선과 화살표가 거래를 안내합니다! 역동적인 Market Fibonacci 23 레벨은
    KURAMA GOLD SIGNAL PRO (MT4) — 7중 필터 · 자동 TP/SL · 품질 점수 · 시그널 기록 저장 | XAUUSD 완전 트레이딩 시스템 실시간 리페인트 없음. 시그널이 나타나는 순간 화살표, 진입, TP, SL이 그 자리에 고정되어 이후 절대 움직이지 않습니다. 여러분이 거래하는 것은 바로 이 실시간 시그널입니다. 그리고 v7.20에서는 실제로 발신된 모든 시그널이 자동 저장되어 재시작 후에도 정확히 복원됩니다. 구매자 전용 보너스 평생 라이선스를 구매하시면 AI Zone Radar($59 상당) + 완전 PDF 매뉴얼을 무료로 드립니다. 제품 가격에 더해 $59 상당의 보너스가 따라옵니다. 구매 후 MQL5로 메시지를 보내주세요. AI Zone Radar: https://www.mql5.com/en/market/product/175834 골드 트레이더 커뮤니티에서 실제로 사용되며 정확성과
    Quantum Breakout Indicator PRO
    Bogdan Ion Puscasu
    4.96 (26)
    소개       Quantum Breakout PRO   , 브레이크아웃 존 거래 방식을 변화시키는 획기적인 MQL5 지표! 13년 이상의 거래 경험을 가진 숙련된 트레이더 팀이 개발한   Quantum Breakout PRO는   혁신적이고 역동적인 브레이크아웃 영역 전략으로 거래 여정을 새로운 차원으로 끌어올리도록 설계되었습니다. Quantum Breakout Indicator는 5개의 이익 목표 영역이 있는 브레이크아웃 영역의 신호 화살표와 브레이크아웃 상자를 기반으로 한 손절 제안을 제공합니다. 초보자 거래자와 전문 거래자 모두에게 적합합니다. Quantum EA 채널:       여기를 클릭하세요 MT5 버전 :   여기를 클릭하세요 중요한! 구매 후 설치 매뉴얼을 받으려면 개인 메시지를 보내주십시오. 추천: 기간: M15 통화쌍: GBPJPY, EURJPY, USDJPY,NZDUSD, XAUUSD 계정 유형: 스프레드가 매우 낮은 ECN, Raw 또는 Razo
    ARTEMIS 서브 윈도우 리버설 시스템 은 리페인트가 없는 강력한 외환(Forex) 지표로, Smart Money Concepts(스마트 머니 개념)와 스토캐스틱 모멘텀 분석을 결합하여 고확률의 반전 거래를 식별하도록 설계되었습니다. 정확한 진입을 원하는 트레이더를 위해 개발된 이 인디케이터는 유동성 스윕 탐지, 시장 구조 변화, 모멘텀 확인을 하나의 깔끔하고 전문적인 트레이딩 도구로 통합합니다. 이 인디케이터가 돋보이는 이유 대부분의 인디케이터는 무작위 신호를 제공합니다. 하지만 ARTEMIS는 실제 시장 움직임에 집중합니다: 유동성 스윕(스탑 헌팅) 감지 구조 변화(ChoCH) 확인 K/D 크로스를 통한 타이밍 결정 명확한 매수/매도 화살표 제공 리페인트 없는 로직 구조 이로 인해 불필요한 가짜 신호가 줄고, 더 높은 품질의 매매 기회가 생성됩니다. 완벽한 매수 신호 시스템 (핵심 강점) 이 인디케이터는 특히 매수 진입에서 강력합니다: 1단계: 약한 하락 모멘텀 스토캐스틱 K와
    Introducing the POWER TRADE Indicator Created by a small group of experienced traders with years of profitable experience in the financial markets, the Power Trade Indicator is a plug-and-play trading tool designed to help traders spot high-quality setups with ease and confidence. What It Does: It provides powerful entry signals, profit-taking zones, and rebound areas — giving you a complete view of where price action is most likely to move next. The indicator reacts in real time, al
    Volume Break Oscillator는 가격 움직임을 오실레이터 형태로 볼륨 추세와 일치시키는 지표입니다. 저는 볼륨 분석을 제 전략에 통합하고 싶었지만 OBV, Money Flow Index, A/D, Volume Weighted Macd 및 기타 여러 지표와 같은 대부분의 볼륨 지표에 항상 실망했습니다. 그래서 저는 이 지표를 직접 작성했고, 얼마나 유용한지 만족스러워서 시장에 공개하기로 결정했습니다. 주요 기능: 가격이 볼륨 증가(브레이크)로 지원되는 방향으로 움직이는 단계를 강조합니다. 볼륨 증가가 멈추고 시장이 수축되는 단계를 강조합니다. 특히 시간 프레임(<=15분)이 있는 일중 거래에서 가격이나 볼륨이 움직이지 않아 시장이 향후 상승에 대비하는 단계를 강조합니다. 볼륨 증가로 지원되지 않는 다른 전문가 자문가의 거짓 신호를 걸러냅니다. 추세와 범위 단계를 시각화하는 것이 매우 쉽습니다. 입력 매개변수: 계산 설정: 계산 유형: FAST, NORMAL, S
    Scalper Inside PRO
    Alexey Minkov
    4.74 (69)
    Scalper Inside PRO helps you read the intraday trend and plan a trade before you enter the market. It is built around three exclusive strategies for a sharper read of the market. The moment a signal appears, the indicator evaluates market direction and calculates the key levels, so you see the potential entry, the expected stop-loss and several profit-taking levels in advance. Detailed performance statistics show how different instruments and strategies performed in history and help you pick ass
    UPD1 Volume BOX
    Vitaliy Kuznetsov
    4.94 (16)
    표시기는 지정된 영역(BOX)의 수평 볼륨 프로파일과 최대 볼륨(POC)을 표시합니다. 제품 특징. 1. 틱 또는 가격만 사용할 수 있습니다. 2. 적응 그리드 간격(M1-MN). 3. 상자 크기에 따른 적응형 대용량(중앙값) 검색 단계. 4. 상자 라인과 버튼의 자동 카멜레온 색상. 5. 생성 및 삭제가 용이한 다중 상자. 6. 70% 볼륨 영역(설정에서 활성화됨). 7. 최대 수평 볼륨 라인(POC) 터치에 대한 경고가 있습니다. 8. VWAP. 9. 제어 패널. 볼륨 프로필 표시기로 시장을 탐색하십시오. 나는 그것을 위해 그것을 했지만 이제 당신도 사용할 수 있습니다. 주요 설정. Calc Histo Mode – 히스토그램 계산 방법 (Market Profile – 가격으로 계산, Tick Volume Profile – 틱으로 계산). Mode Step In Pips – 핍으로 중앙선 계산. Vertical Step – 히스토그램의 수직 단계(줄 사이의 거리(핍)). Da
    PZ Trend Trading
    PZ TRADING SLU
    4.8 (5)
    Capture every opportunity: your go-to indicator for profitable trend trading Trend Trading is an indicator designed to profit as much as possible from trends taking place in the market, by timing pullbacks and breakouts. It finds trading opportunities by analyzing what the price is doing during established trends. [ Installation Guide | Update Guide | Troubleshooting | FAQ | All Products ] Trade financial markets with confidence and efficiency Profit from established trends without getting whips
    대칭 삼각형 패턴 대시보드를 사용하면 여기에서 사용할 수 있는 대칭 삼각형 패턴 표시기로 그리는 대칭 삼각형 패턴에 대해 여러 시장과 기간을 한 번에 모니터링할 수 있습니다. https://www.mql5.com/en/market/product/68709/ 위의 지표를 방문하여 대칭 삼각형 패턴이 어떻게 형성되고 거래 전략을 따라야 하는지에 대해 자세히 알아보세요. 대시보드는 독립 실행형 제품이며 표시기가 작동할 필요가 없습니다. 패턴을 모니터링하고 패턴이 형성될 때 경고를 발행하므로 차트에서 패턴을 실제로 보려면 대칭 삼각형 패턴 표시기도 필요합니다. 대칭 삼각형 차트 패턴은 가격이 강제로 상승 또는 붕괴되기 전에 수축 및 통합 기간을 나타냅니다. 하단 추세선에서의 분석은 새로운 약세 추세의 시작을 나타내고 상단 추세선의 이탈은 새로운 강세 추세의 시작을 나타냅니다. 이 대시보드는 이러한 패턴을 식별하고 4가지 핵심 포인트가 형성되고 가격이 다시 삼각형으로 되돌아갔을 때 경
    캔들의 종가를 예측하는 지표입니다. 지표는 주로 D1 차트에서 사용하기 위한 것이. 이 지표는 전통적인 외환 거래와 바이너리 옵션 거래 모두에 적합합니다. 지표는 독립형 거래 시스템으로 사용하거나 기존 거래 시스템에 추가로 사용할 수 있습니다. 이 표시기는 현재 양초를 분석하여 양초 본체 내부의 특정 강도 요인과 이전 양초의 매개변수를 계산합니다. 따라서 지표는 시장 움직임의 추가 방향과 현재 양초의 종가를 예측합니다. 이 방법 덕분에 지표는 단기 및 중장기 거래 모두에 적합합니다. 지표를 사용하면 시장 상황을 분석하는 동안 지표가 생성할 잠재적 신호의 수를 설정할 수 있습니다. 표시기 설정에는 이를 위한 특별한 매개변수가 있습니다. 또한 인디케이터는 새로운 신호에 대해 차트의 메시지 형태, 이메일 및 PUSH 알림 형태로 알릴 수 있습니다. 구매 후 저에게 꼭 써주세요! 나는 당신에게 지표와 거래에 대한 나의 추천을 줄 것입니다! 또한 보너스를 받으세요!
    Prop Firm Sniper
    Mohamed Hassan
    4.33 (6)
    Prop Firm Sniper MT4  is a professional market structure indicator that automatically identifies high-probability BUY and SELL opportunities using BOS and CHoCH analysis. Recommended Timeframes: For backtesting, use the indicator on   M5 or M15   for Gold (XAUUSD), and   M15 or H1   for more volatile Forex pairs such as   GBPUSD, USDJPY, EURGBP , and similar markets. CONTACT ME AFTER PURCHASE TO CLAIM YOUR FREE BONUSES! Prop Firm Sniper  is a professional market structure indicator designed t
    PREMIUM SUPPLY AND DEMAND ZONES WITH ALERTS Premium Supply and Demand Zones with Alerts 는 스마트 머니(Smart Money) 트레이딩 지표 로, 기관급 공급 및 수요 구간 과 멀티 타임프레임 트렌드 히스토그램 을 결합하여 고신뢰 반전(리젝션) 진입 신호 를 제공합니다. 이 지표는 메인 차트에서 프리미엄 공급/수요 구간 을 자동으로 식별하며, 강력한 캔들 윅(꼬리) 리젝션 로직 으로 진입을 확인합니다. 신호는 우세 트렌드 방향에서만 발생 하며, 해당 트렌드는 공급/수요 히스토그램 에 의해 명확하게 결정됩니다. 핵심 강점 히스토그램은 트렌드 필터입니다. 고타임프레임에서 수요가 우세한지 공급이 우세한지 를 시각적으로 보여주며, 항상 시장 힘에 맞는 트레이딩 을 가능하게 합니다. 구간 품질 제어 (트레이더의 우위) SwingDepth 파라미터 를 조정하면 트레이더가 프리미엄 구간 을 정확하게 정의할 수 있습니다: Sw
    제작자의 제품 더 보기
    Blahtech Candle Timer MT5
    Blahtech Limited
    4.85 (147)
    Over 100,000 users on MT4 and MT5 Blahtech Candle Timer displays the remaining time before the current bar closes and a new bar forms. It can be used for time management Links [  Install  |  Update  |  Training  ] Feature Highlights The only candle timer on MT5 with no stutter and no lag S electable Location Tracks server time not local time Multiple colour Schemes Configurable Text Customisable alerts and messages Optimised to reduce CPU usage Input Parameters Text Location - Beside / Upper Le

    FREE
    Blahtech Market Profile MT5
    Blahtech Limited
    5 (10)
    Was: $249  Now: $99   Market Profile defines a number of day types that can help the trader to determine market behaviour. A key feature is the Value Area, representing the range of price action where 70% of trading took place. Understanding the Value Area can give traders valuable insight into market direction and establish the higher odds trade. It is an excellent addition to any system you may be using. Inspired by Jim Dalton’s book “Mind Over Markets”, this indicator is designed to suit the
    Blahtech Supply Demand
    Blahtech Limited
    4.58 (36)
    Was: $299  Now: $99   Supply Demand uses previous price action to identify potential imbalances between buyers and sellers. The key is to identify the better odds zones, not just the untouched ones. Blahtech Supply Demand indicator delivers functionality previously unavailable on any trading platform. This 4-in-1 indicator not only highlights the higher probability zones using a multi-criteria strength engine, but also combines it with multi-timeframe trend analysis, previously confirmed swings
    Blahtech Supply Demand MT5
    Blahtech Limited
    4.57 (14)
    Was: $299  Now: $99  Supply Demand uses previous price action to identify potential imbalances between buyers and sellers. The key is to identify the better odds zones, not just the untouched ones. Blahtech Supply Demand indicator delivers functionality previously unavailable on any trading platform. This 4-in-1 indicator not only highlights the higher probability zones using a multi-criteria strength engine, but also combines it with multi-timeframe trend analysis, previously confirmed swings a
    Blahtech Candle Timer
    Blahtech Limited
    4.83 (94)
    Over 100,000 users on MT4 and MT5 Blahtech Candle Timer displays the remaining time before the current bar closes and a new bar forms. It can be used for time management Links [  Install  |  Update  |  Training  ] Feature Highlights The only candle timer on MT4 with no stutter and no lag S electable Location Tracks server time not local time Multiple colour Schemes Configurable Text Customisable alerts and messages Optimised to reduce CPU usage Input Parameters Text Location   - Beside / Upper

    FREE
    Blahtech Daily Range MT5
    Blahtech Limited
    5 (2)
    Was: $99  Now: $49  Blahtech Daily Range indicator displays the average daily range alongside the individual session ranges. Using the daily open price as a reference the indicator shows fixed range and dynamic range targets as lines on the charts. These lines clearly show when the average range has been exhausted. Daily and session ranges can be useful for confirming entries or setting targets and is an excellent odds enhancer for many trading systems. Links [  Documentation   |   Install  |  U
    Blahtech Fisher Transform
    Blahtech Limited
    5 (1)
    Blahtech Fisher Transform indicator is an oscillator that displays overbought and oversold locations on the chart. The Fisher Transform algorithm transforms prices with any distribution shape into a normal distribution. The end result is a curve with sharp turning points that may help to identify bullish or bearish trends. Fisher Transform values exceeding 1.66 on the daily chart are considered to be good areas for reversal trades. Links [  Install  |  Update  |  Training   |  All Products  ] F
    Blahtech VWAP MT5
    Blahtech Limited
    5 (1)
    Was: $69  Now: $49   Blahtech VWAP - Volume Weighted Average Price (VWAP) is the ratio of price to total volume. It provides an average price over a specified time interval.  Links [  Install  |  Update  |  Documentation   ] Feature Highlights Configurable VWAP Line Sessions, intervals, anchored or continuous Previous day settlement line Standard Deviation bands Alerts at bar close or real time Automatic Broker or Tick volumes Significantly reduced CPU usage Input Parameters Expert Advisor Mo

    Was: $49    Now: $33   Blahtech Better Volume provides an enhanced version of the vertical volume bars. Each bar is compared to the previous 20 bars. Depending on its volume, range and volume density it will be assigned a state and colour. Low Volume – Minimum volume High Churn   – Significant volume with limited movement Climax Neutral –   High volume with unclear direction Climax Up   – High volume with bullish direction Climax Dn   – High volume with bearish direction Climax Churn – High vol
    Blahtech Moving Average MT5
    Blahtech Limited
    5 (3)
    Blahtech Moving Average indicator is a multitimeframe version of the standard Moving Average indicator. It is also enhanced with customisable alerts, period breaks and other configuration options. The 50 day and 200 day moving averages are widely followed by investors and traders, with breaks above and below the MA lines considered to be signals of interest. Links [  Install  |  Update  |   Training   |   All Products  ] Feature Highlights Up to three timeframes Configurable calculation variabl
    FREE
    Blahtech Fisher Transform indicator is an oscillator that displays overbought and oversold locations on the chart. The Fisher Transform algorithm transforms prices with any distribution shape into a normal distribution. The end result is a curve with sharp turning points that may help to identify bullish or bearish trends. Fisher Transform values exceeding 1.66 on the daily chart are considered to be good areas for reversal trades. Links [  Install  |  Update  |  Training   |  All Products  ] F
    Blahtech VWAP
    Blahtech Limited
    5 (3)
    Was: $69    Now: $49   Blahtech VWAP - Volume Weighted Average Price (VWAP) is the ratio of price to total volume. It provides an average price over a specified time interval.  Links [  Install  |  Update  |  Documentation   ] Feature Highlights Configurable VWAP Line Sessions, intervals, anchored or continuous Previous day settlement line Standard Deviation bands Alerts at bar close or real time Automatic Broker or Tick volumes Significantly reduced CPU usage Input Parameters Expert Advisor
    Blahtech Market Profile
    Blahtech Limited
    4.53 (15)
    Was: $249  Now: $99   Market Profile defines a number of day types that can help the trader to determine market behaviour. A key feature is the Value Area, representing the range of price action where 70% of trading took place. Understanding the Value Area can give traders valuable insight into market direction and establish the higher odds trade. It is an excellent addition to any system you may be using. Blahtech Limited presents their Market Profile indicator for the MetaTrader community. Ins

    Blahtech Moving Average
    Blahtech Limited
    5 (5)
    Blahtech Moving Average indicator is a multitimeframe version of the standard Moving Average indicator. It is also enhanced with customisable alerts, period breaks and other configuration options. The 50 day and 200 day moving averages are widely followed by investors and traders, with breaks above and below the MA lines considered to be signals of interest. Links [  Install  |  Update  |   Training   |   All Products  ] Feature Highlights Up to three timeframes Configurable calculation variabl
    FREE
    Blahtech Daily Range
    Blahtech Limited
    4.8 (5)
    Was: $99    Now: $49   Blahtech Daily Range indicator displays the average daily range alongside the individual session ranges. Using the daily open price as a reference the indicator shows fixed range and dynamic range targets as lines on the charts. These lines clearly show when the average range has been exhausted. Daily and session ranges can be useful for confirming entries or setting targets and is an excellent odds enhancer for many trading systems. Links [  Documentation   |   Install  
    필터:
    svetlana888
    89
    svetlana888 2023.12.27 15:37 
     

    I purchased the Blahtech Better Volume indicator, the support service does not work, they constantly write, either weekends, then holidays, then Christmas, terrible support, there is no desire to even answer, just to sell! I asked a question about how to use the indicator! Almost a week later they told me that there was no training! I don't need training, I asked how to use the indicator! In general, wasted money and nerves! I absolutely do not recommend it! They are unfriendly, just to sell, they don’t answer my questions! If I had known that there was no such customer support, I would not have bought the indicator, it’s just terrible, they answer rudely and just unsubscribe! No customer help! Now about the indicator, I don’t advise you to buy, the indicator draws sense, just wasted money! I wrote to the support service again, I hope they will answer next year! Colors (draws) candles in the very last seconds! Guys, don’t be fooled by the picture, the indicator is completely zero, wasted money and time and nerves! It loads the computer a lot! A terrible indicator, it draws volume at the very end of the candle (meaningless information for analysis) and disgusting support service.

    I contacted the support service for the Blahtech Better Volume indicator, which draws candles on December 21, 2023, before the holidays and Christmas! They receive money from clients very well, at this moment they don’t have holidays, and they don’t want to support clients, the main thing for them is money; their holidays start right away! After my review, they again sent me a link to the YouTube training, nothing is clear there and it draws candles, don’t buy this indicator, it’s a waste of money and nerves!

    Today 01/09/2024, the Blahtech Better Volume indicator does not give signals, alerts, I asked the support service of the Blahtech Better Volume indicator this question, there is no answer, they have holidays or Christmas again! Why can’t I answer questions from the client who bought the indicator!? This indicator is crude, how can you sell such indicators when they are not ready for trading, do not work and are also redrawn!? I’ll wait, maybe they’ll answer my question in February!!!

    today is 01/12/2024, the support service for this indicator does not answer questions, it gets personal, and this is unacceptable, a complaint has already been filed with the MQL5 support service about actions that are unacceptable in our MQL5 society, I want more people to know about how this user is cheating and lies about his indicator, which gives signals in the last seconds of the candle, for this useless indicator he asks for 34 dollars, people, don’t be fooled by this, save your money and nerves! To my legal demand to answer the question, they did not answer even then, and now they are replying “It’s working hours, there is no Christmas and holidays, answer the questions” in the support service of the Blahtech Better Volume indicator, they write that this is rudeness and an insult and not politely, they didn’t answer on Christmas Day and are now unsubscribing, just not to answer my questions, they received the money, but they don’t want to answer, why is the indicator drawing, constantly changing colors and this happens in the last seconds of the candle. They will create their own indicators and fool people with beautiful advertising!

    Blahtech Limited
    219964
    개발자의 답변 James Cater 2024.01.13 07:03
    After receiving many messages over the holidays, we answered some of your questions. You didn't like one of our responses, became enraged, then responded with angry messages and prejudiced reviews
    You then asked more questions and demanded the following "It's working hours and there are no Christmas or holidays, answer the questions".
    That is no way to talk to anyone
    Blahtech have a company policy not to respond to rude or abusive customers.
    If you want a response from us then ask politely.
    13 Jan 2024 - Your behaviour was reported and not surprisingly, you've been handed a week long communication cooldown by the MQL5 support staff
    efecetinel
    126
    efecetinel 2021.05.20 22:47 
     

    Perfect. Thank you James.

    리뷰 답변