BlueDigitsFx OBV Divergence

4.84
  • 지표
  • Ziggy Janssen
    Ziggy Janssen
    BlueDigitsFx는 전문 MetaTrader 트레이더를 위해 주문 실행, 워크플로우 효율성, 시장 구조 분석 및 리스크 관리에 중점을 둔 MT4 및 MT5 전문 트레이딩 인프라를 개발합니다.
    생태계 구성:
    • 트레이딩 대시보드
    • 주문 실행 도구
    • 시장 구조 시스템
    • 워크플로우 유틸리티
    • 리스크 관리 도구
    • 거래 관리 솔루션
  • 버전: 1.11
  • 업데이트됨: 29 12월 2025
  • 활성화: 6

BlueDigitsFx 공식 생태계 액세스

인프라 업데이트, 트레이딩 리소스, 제품 출시 정보 및 BlueDigitsFx 공식 생태계에 대한 액세스를 받아보세요.

Telegram 생태계
웹사이트
MT5 버전


BlueDigitsFx OBV Divergence MT4 — 시장 반전을 식별하기 위한 거래량 다이버전스 지표

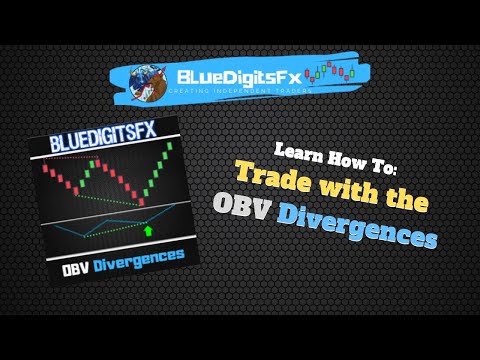
BlueDigitsFx OBV Divergence는 가격 움직임과 On-Balance Volume(OBV) 지표 간의 강세 및 약세 다이버전스를 식별하도록 설계된 MT4 지표입니다.

가격 움직임과 거래량 행동을 비교함으로써 이 지표는 다양한 시장 환경에서 잠재적인 추세 소진, 반전 조건 및 모멘텀 변화를 식별하는 데 도움을 줍니다.

이 지표는 차트에 다이버전스 패턴을 직접 표시하여 거래량 기반의 추가 확인과 함께 시장 구조를 분석할 수 있도록 지원합니다.


주요 기능

  • 자동 다이버전스 감지 — 차트에서 강세 및 약세 OBV 다이버전스를 자동으로 식별합니다.
  • 거래량 및 가격 비교 — 가격 움직임과 On-Balance Volume의 행동을 비교 분석합니다.
  • 멀티 타임프레임 지원 — MT4의 모든 지원 시간대에서 작동합니다.
  • 사용자 지정 알림 — 팝업, 이메일 및 푸시 알림을 지원합니다.
  • 명확한 시각적 신호 — 다이버전스 영역을 시각적으로 표시하여 해석을 쉽게 합니다.
  • 경량 MT4 유틸리티 — 안정적인 MetaTrader 4 성능을 위해 최적화되었습니다.

트레이더들이 사용하는 이유

거래량 다이버전스는 가격 모멘텀과 실제 거래량 흐름이 더 이상 일치하지 않는 상황을 식별하는 데 도움이 될 수 있습니다.

OBV Divergence는 추세 분석, 시장 구조 분석, 지지·저항 구간 또는 모멘텀 기반 전략과 함께 사용하는 추가 확인 도구로 활용될 수 있습니다.

거래량 분석과 기술적 시장 구조 분석을 결합하고자 하는 트레이더에게 적합합니다.


트레이딩 워크플로우 예시

반전 분석

지지 구간 근처의 강세 다이버전스 또는 저항 구간 근처의 약세 다이버전스를 활용하여 잠재적인 시장 반전 조건을 식별할 수 있습니다.

진입 전에는 가격 움직임 또는 추세 구조를 통한 추가 확인이 권장됩니다.


추세 지속 분석

OBV Divergence는 가격 움직임과 거래량 행동을 비교하여 더 큰 추세 내에서 약해지는 조정을 식별하는 데에도 도움이 될 수 있습니다.

이는 활성 추세 중 추세 지속 기회를 찾는 트레이더에게 유용할 수 있습니다.


멀티 타임프레임 분석

상위 시간대의 다이버전스 구간을 하위 시간대의 진입 모델과 결합하여 추가적인 시장 맥락을 얻을 수 있습니다.

많은 트레이더들은 거래량 다이버전스 분석을 시장 구조 시스템 및 모멘텀 전략과 함께 사용합니다.


사용 방법

  1. BlueDigitsFx OBV Divergence를 MT4 차트에 추가합니다.
  2. 차트에 표시되는 강세 및 약세 다이버전스 신호를 모니터링합니다.
  3. 시장 구조, 추세 방향 또는 지지·저항 수준과 같은 추가 확인 방법과 함께 다이버전스 신호를 활용합니다.

추천 인프라 조합

BlueDigitsFx OBV Divergence는 시장 구조 분석과 거래량 기반 다이버전스 확인을 결합하고자 하는 트레이더에게 BlueDigitsFx Easy 123 System과 함께 사용할 때 특히 효과적입니다.

Easy 123은 구조 돌파, 반전 감지, 브레이크아웃 분석 및 지지·저항 구간에 초점을 맞추고 있으며, OBV Divergence는 거래량 행동을 통해 추가 확인을 제공합니다.

BlueDigitsFx Easy 123 System:
https://www.mql5.com/en/market/product/43555


BlueDigitsFx 인프라 생태계의 일부

BlueDigitsFx OBV Divergence는 MT4 및 MT5용 BlueDigitsFx 트레이딩 인프라 생태계의 일부로, 시장 구조 도구, 워크플로우 유틸리티, 트레이딩 대시보드, 거래량 분석 및 전문 MetaTrader 사용자를 위한 포지션 관리 지원에 중점을 두고 있습니다.
리뷰 37
611214
159
611214 2022.09.13 17:23 

Great indicator , Great service , Great results in my challenge account (eurusd, audusd,us30 ,ger30,BTC,Gold and Usdcad), thank you very much Ziggy, God bless you .

diligentnfree
65
diligentnfree 2021.09.22 12:35 

Simply amazing..its all about being patient and allowing this tool to instruct you.. Divergence made simple..

mygb
419
mygb 2020.11.30 11:58 

Easy to use tool, great support group

추천 제품
Moving Average Trend Scanner is a multi symbol multi timeframe triple MA crossover dashboard that helps traders to monitor, and identify potential market trends from one chart. This panel scans 3 moving averages in up to 28 configurable instruments and 9 timeframes for triple moving average alignment and moving average crossover  with a deep scan feature to scan all market watch symbols (up to 1000 instruments!). Download Demo here  (Scans only M1 and W1) Settings description here MT5 version
EMA Dashboard
Chantal Sala
1 (1)
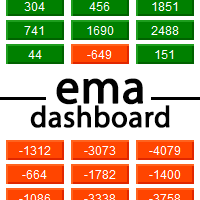
Ema Dashboard is an innovative dashboard that allows you to monitor Moving Average on multiples symbols and different timeframes. This dashboard allows you to analyze information on 28 pairs on an unique chart. Its functionality includes analysis of All Time Frames. This configuration allows you to identify the Long Term Trend with extreme ease. This panel allows you to take very important directional movements. A click on button opens a new chart (symbol and timeframe). Graphic Object Symbol l
Quantum Falcon Signal Free is a smart visual trading indicator for MetaTrader 4 designed for Forex and Gold traders. The indicator combines: • Trend analysis • RSI momentum confirmation • MACD momentum filtering • ATR volatility filtering • Higher timeframe confirmation • Smart exit signal detection Main Features: • Smart Buy and Sell signals • Exit Buy / Exit Sell alerts • Real-time dashboard on chart • Professional candle arrows • Multi-timeframe trend confirmation • ATR market volatility filt
FREE
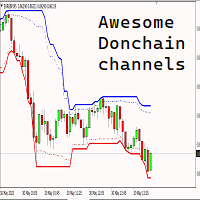
Introducing the Donchian Channels indicator for MQL4, a powerful technical analysis tool designed to boost your trading success. This indicator consists of four lines that represent the upper and lower boundaries of price movement over a specified period. With the Donchian Channels indicator, you can easily identify potential breakouts and reversals in the market. The upper line shows the highest high of the specified period, while the lower line represents the lowest low. The space between thes
Currency StrengtT
Hafis Mohamed Yacine
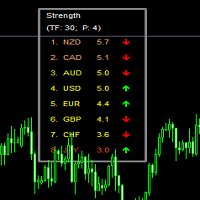
What Is Currency StrengtT Indicator? A currency strengthT indicator is a graphical tool that shows the strength of a currency. Common indicators usually show the strength of a currency in relation to another currency, however, with some calculations it is possible to find the absolute strength of each individual currency. Therefore, a currency strength matrix indicator (or meter) is a tool that tries to express the absolute strength of a currency, so that you can compare this strength with the
R Var 이동 평균 지표는 완고한 추세 추종자를 위해 설계된 추세 추종 지표입니다. 그것은 주식 거래자뿐만 아니라 상품 거래자 사이에서 꽤 인기있는 외환 거래 지표이며 그 인기는 사용자에게 진정한 돈 버는 신호를 전달하는 능력에서 비롯됩니다. 표시기는 시에나 라인에 배치된 녹색 및 빨간색 점으로 구성됩니다. 녹색 점은 강세 신호를 가리키고 빨간색 점은 약세 신호를 나타냅니다. 기본 거래 신호 매수 신호: 지표의 시에나 선에 있는 점이 녹색으로 바뀌면 매수하세요. 매도 신호: 지표의 시에나 선에 있는 점이 빨간색으로 바뀌면 매도하십시오. 매수 거래 종료: 강세 추세가 진행되는 동안 표시기의 시에나 라인에 빨간색 점이 나타나면 모든 매수 주문을 닫습니다. 매도 거래 종료: 약세 추세가 진행되는 동안 R Var 이동 평균 지표의 시에나 선에 녹색 점이 표시되면 모든 매도 주문을 마감합니다. 팁 R Var 이동 평균 지표를 사용할 때 잘못된 신호를 방지하기 위해 적당한 손절매를
FREE
Binary Option Signal
Yaroslav Varankin
Indicator for binary options arrow is easy to use and does not require configuration works on all currency pairs, cryptocurrencies buy signal blue up arrow sell signal red down arrow tips do not trade during news and 15-30 minutes before their release, as the market is too volatile and there is a lot of noise it is worth entering trades one or two candles from the current period (recommended for 1 candle) timeframe up to m 15 recommended money management fixed lot or fixed percentage of the depo
Market Trend Strength Heatmap  Smart Structure Heatmap is a multi-timeframe trend analysis indicator designed to help traders quickly identify market direction and overall trend strength based on real time. The indicator combines several technical filters into a simple heatmap dashboard, allowing traders to view trend conditions across multiple timeframes in one place. Trend direction is displayed using color signals: Green Uptrend (buy) Red Downtrend (sell) Yellow Sideways  S
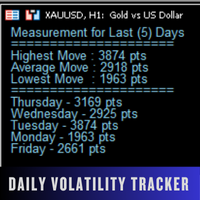
Daily Volatility Tracker is a practical and lightweight indicator designed to help traders monitor and analyze market volatility based on historical daily price movements. Whether you're a day trader, swing trader, or scalper, understanding how much a market moves per day is critical for: Choosing the right pairs to trade Setting accurate stop-loss and take-profit levels Adapting to changing market conditions MT5 Version -  https://www.mql5.com/en/market/product/134960/ Join To Learn Market Dept
FREE
Gold Session Trap Distance Map Gold Session Trap Distance Map is a clean intraday liquidity-mapping indicator designed for XAUUSD traders who want to track where price still has unfinished business from major trading sessions. Instead of filling the chart with random support and resistance, this indicator focuses on one simple idea: unbroken session trap zones can act like future liquidity magnets. The indicator tracks key session trap areas from the major trading periods and displays live dista
Gann Box MT4
Frederic Jacques Collomb
5 (1)
Gann Box 지표는 트레이더가 시장의 핵심 수준을 식별하고 활용할 수 있도록 설계된 강력하고 다재다능한 도구입니다. 이 지표는 차트에 직사각형을 그릴 수 있게 해주며, 자동으로 전략적 수준인 0, 0.25, 0.50, 0.75, 1 로 여러 영역으로 나뉩니다. 가격이 이 중 하나의 수준에 도달하면 경고가 활성화되어 거래 결정을 내리는 데 귀중한 도움을 제공합니다. 그리신 영역에 대한 시장의 변화를 즉시 알 수 있습니다. 영역을 그리려면 간단한 직사각형을 그리고 이름을 GannBox 로 바꾸기만 하면 됩니다. 이 지표는 지지 및 저항 , 공급 및 수요 개념을 사용하는 트레이더, ICT 기술을 사용하는 트레이더, 또는 공정 가치 갭 (FVG) 전문가 등 모든 유형의 트레이더를 위해 설계되었습니다. 일일 거래자, 스윙 거래자 또는 포지션 거래자이든, Gann Box 는 시장의 움직임을 더 잘 이해하고 예측하는 데 도움을 주어 반응성과 성과를 향상시킵니다. MT5 버전 Gann Box
Trend Oracle
Nadiya Mirosh
Trend Oracle trend indicator, shows entry signals. Displays both entry points and the trend itself. Shows statistically calculated moments for entering the market with arrows. When using the indicator, it is possible to optimally distribute the risk coefficient. The indicator can be used for both short-term pipsing and long-term trading. Uses all one parameter for settings. Length - the number of bars to calculate the indicator. When choosing a parameter, it is necessary to visually similarize s
MTF Currency Strength Panel MT4
Narayanan Mohanan Mohanan Krishnan
MTF Currency Strength Panel for MetaTrader 4 멀티 타임프레임 통화 강도 지표: 28개 주요 통화쌍 전체를 하나의 차트에서. 이 통화 강도 패널은 주요 8개 통화가 현재 어디에 있는지, 그리고 28개 주요 통화쌍이 M1부터 MN1까지 아홉 개 시간프레임에서 어떻게 움직였는지를 함께 보여줍니다. 두 정보가 하나의 차트에 표시되며 타이머로 갱신됩니다. 쌍의 순위를 매기는 것 자체는 오해의 소지가 있습니다. 단일 통화가 이동하면 이를 포함하는 모든 쌍이 함께 이동하므로 쌍 순위의 상위는 동일한 통화가 7번 반복되는 경우가 많습니다. 이 패널은 전체 매트릭스를 개별 통화 강도로 분해하여 드라이버를 중복 항목과 분리합니다. 분해 작동 방식 8개 통화는 각각 28개 쌍 중 7개로 나타납니다. 그 강도는 7개 수치의 평균이며, 표시 통화 위치는 반전되어 있습니다. AUDJPY 하락은 엔화 약세가 아니라 엔화 강세를 의미합니다. 모든 쌍은 정확하게 두 가지 통화에

FREE
The indicator is the main part of Michael Huddleston's ICT (Inner Circle Trader) trading strategy. His legendary trading strategy is based on the concept of "Smart Money". To analyze the medium -term trend , the  ICT offers an analysis based on  twenty -day levels . The indicator builds levels , while showing the turning points with arrows . An important feature of the indicator is the automatic display of levels for different periods . You do not have to change the indicator settings when chang
VR Cub
Vladimir Pastushak
VR Cub 은 고품질 진입점을 얻는 지표입니다. 이 지표는 수학적 계산을 용이하게 하고 포지션 진입점 검색을 단순화하기 위해 개발되었습니다. 지표가 작성된 거래 전략은 수년 동안 그 효율성을 입증해 왔습니다. 거래 전략의 단순성은 초보 거래자라도 성공적으로 거래할 수 있다는 큰 장점입니다. VR Cub은 포지션 개시 지점과 이익 실현 및 손절매 목표 수준을 계산하여 효율성과 사용 편의성을 크게 높입니다. 간단한 거래 규칙을 이해하려면 아래 전략을 사용한 거래 스크린샷을 살펴보세요. 설정, 세트 파일, 데모 버전, 지침, 문제 해결 등은 다음에서 얻을 수 있습니다. [블로그] 다음에서 리뷰를 읽거나 작성할 수 있습니다. [링크] 버전 [MetaTrader 5] 진입점 계산 규칙 포지션 개설 진입점을 계산하려면 VR Cub 도구를 마지막 최고점에서 마지막 최저점까지 늘려야 합니다. 첫 번째 지점이 두 번째 지점보다 빠른 경우, 거래자는 막대가 중간선 위에서 마감될 때까지 기다립니다
Fibonacci CSM
Emir Revolledo
Fibonacci Currency Strength Meter (FCSM) Early Access Sale!! This new product is still in the process of adding new features and settings. For early bird buyers. The Price will be 50% Sale. In a few weeks, the product will be done. Go Grab your copy while it's still cheap. More details will be added soon. Things to be added. Alert Levels Mobile and Email Alert From it's name, Fibonacci Currency Strength Meter is a combination of Fibonacci levels and Currency Strength Meter. The plot of Fibona
Binary Options Assistant (BOA) ICE Signals Indicator provides signals based on gkNextLevel Binary Options Strategy.  Indicators: 2 Bollinger Bands & Stochastic Stop missing trades, stop jumping from chart to chart looking for trade set-ups and get all the signals on 1 chart! U se any of the BOA Signals Indicator with the  Binary Options Assistant (BOA) Multi Currency Dashboard .   All BOA Signal Indicator settings are adjustable to give you more strategy combinations. The signals can be seen
FREE
Introducing the Austin Trend Scanner: Your Ultimate Tool for Timely Trend Identification. The Austin Trend Scanner is a groundbreaking MetaTrader 4 indicator meticulously engineered to provide traders with precise trend reversal signals across multiple timeframes. Built upon advanced algorithms and non-repainting technology, this indicator offers unparalleled accuracy in identifying profitable trading opportunities. Key Features: 1. Non-Repainting Signals: The Austin Trend Scanner delivers non
Smart Phase Box (SPB) — Indicator Description Smart Phase Box automatically locates consolidation zones (bases, flats) on the chart and analyzes the candle microstructure inside each zone — wicks, tick volume, body-to-range ratio, and where price closes relative to the zone — to estimate whether the zone looks more like accumulation (buyers absorbing supply) or distribution (sellers absorbing demand), based on classic Wyckoff / Smart Money concepts. MT5-version:  https://www.mql5.com/en/market/p
Chart Analyzer
Innovicient Limited
The Chart Analyzer is an MT4 indicator that provides visual arrow signals without redrawing them. In addition, we have included trendlines to validate your entries. This indicator has been fine-tuned to work with all timeframes and instruments.  The Chart Analyzer has a number of advantages Does not fade or remove arrows when drawn Sends both email and phone alerts. It is light on computer resources Easy to install. Default setting works just fine.  If price opens above the trendline, open bu
KFX Trade Manager
Joe Christopher Ramirez
Introducing the "KFX Trade Manager" expert advisor for MetaTrader 4 (MT4), a comprehensive solution for advanced trade management and risk control. This powerful tool is designed to enhance your trading experience by automating various aspects of order handling, profit optimization, and alert notifications. With the "KFX Trade Manager," you can take your trading to the next level and streamline your operations for improved efficiency and better risk management. Key Features: Trade Management Set
AZ AI Trend Core Pro
Shahrull Hissham Bin Saad
AZ AI Core Pro Indicator Overview AZ AI Core Pro Indicator is a smart trading analysis tool designed to help traders identify potential market opportunities through trend analysis, multi-timeframe confirmation, support and resistance zones, AI-based filtering, and early signal detection. The indicator combines multiple analytical layers into a single visual system, allowing traders to identify BUY and SELL opportunities with greater confidence while reducing unnecessary market noise. Suitable fo
Niubility Trend  Niubility Trend displays the trend direction for all time frames in real time. You'll see at a glance at which direction the trends are running, how long they last and how powerful they are. All this makes it an easy-to-use trend trading system for beginners, advanced and professional traders. Features Easy to trade Customizable colors and sizes It is non-repainting and non-backpainting It is fantastic as a trailing stop method It implements alerts of all kinds
Email Drawdown Alert
Roman Starostin
5 (12)
Free informative Indicator-helper. It'll be usefull for traders who trade many symbols or using grid systems (Averaging or Martingale). Indicator counts drawdown as percent and currency separate. It has a number of settings: Count deposite drawdown according equity value and send e-mail or notifications to user if DD more than set; Sending e-mail when max open orders reached; Shows price and remaining pips amount before MarginCall on current chart and Account generally; Display summary trade lot
FREE
FTR Multi Timeframe
Akaashi Videsh Reedoy
The FTR Multi-Timeframe indicator is a versatile tool that can add great value to your trading arsenal. This indicator is intended to be used to add confluence to your already existing trading strategy, such as, breakout & retest, supply and demand, patterns or continuation trading. FTR Multi-Timeframe  is a continuation indicator. Rules  are attached as a screenshot. Settings for Demo/Strategy Tester: Set Server_Time_Filter to false in indicator settings ( IMPORTANT! ). Tick 'Show object descr
Paid release: Silver Bullet Session FVG MT4 is a paid MetaCoderStore indicator. Use the product comments for setup questions, feature requests, and feedback for future updates. FVG Pro bundle offer: This indicator is included in Fair Value Gap Pro MT4 . The bundle combines Classic FVG, Inversion FVG, Opening Range FVG, Silver Bullet FVG, Price Action FVG, and automatic dominant-cycle logic. The five individual FVG indicators cost 150 USD separately; FVG Pro is 49 USD, saving 101 USD. Paid indivi
NAM Divergences
NAM TECH GROUP, CORP.
5 (1)
MT4 Multi-timeframe Divergence and Overbougt/Oversold detection indicator. Features - Fully customizable on chart control panel, provides complete interaction. - Hide and show control panel wherever you want. - Real time information about non-capitalized divergences. - Real time information about overbougt / oversold situations. - Real time information about regular divergences. - Real time information about hidden divergences. - Oscillators available for divergences detection: AO, RSI, CCI, MA
RBCI hist
Sergey Zhukov
The RBCI hist indicator is an adaptive trend histogram, that eliminates noise using a Low-pass filter, which passes the lower frequencies and cuts off hight frequencies of the price fluctuations. The signal (depending on the strategy chosen by trader) is the intersection of the zero line by the indicator, as well as the change in the histogram color. The change in the histogram color serves as an early signal for opening positions towards the trend. The position of the indicator relative to the
The new update makes this indicator a complete tool for studying, analyzing and operating probabilistic patterns. It includes: On-chart Multi-asset percentage monitor. Configurable martingales. Twenty-one pre-configured patterns , including Mhi patterns and C3. An advanced pattern editor to store up to 5 custom patterns. Backtest mode to test results with loss reports. Trend filter. Hit operational filter. Martingale Cycles option. Various types of strategies and alerts. Confluence between patte
Currency Strength Gauge incicator The currency strength gauge is an indicator to measure of the strength or weakness of currencies in the Forex market. Comparing the strength of currencies in a graphic representation will lead to a good overview of the market and its future trends. You will see in a graphic chart both the strength of the currencies and their correlation, and this will help you in your decisions to get better trades.   -To easy detection of over Overbought and Oversold points,
이 제품의 구매자들이 또한 구매함
Trend SniperX MT4
Sarvarbek Abduvoxobov
5 (5)
Trend Sniper X 는 트레이더가 명확하고 정확하게 트렌드 방향과 잠재적 반전 지점을 포착할 수 있도록 돕는 MetaTrader 5 전용 멀티 타임프레임 추세 추종 지표입니다. MT5 버전 링크: https://www.mql5.com/en/market/product/181101 가격 안내: 현재 가격은 프로모션 할인가이며, 향후 업데이트 및 새 기능 출시 시 인상될 수 있습니다. Code2Profit 채널 멀티 타임프레임 분석으로 시장을 정복하세요! Trend Sniper X로 승률을 극대화하는 방법: 핵심 규칙 및 세션 팁 기술 사양 플랫폼 MetaTrader 5 지표 유형 멀티 타임프레임 추세 지표 작동 타임프레임 모든 차트 타임프레임 (상위 타임프레임 M1–MN1 독립 선택 가능) 주요 종목 외환(Forex), 골드(XAUUSD) 및 기타 CFD 추천 계좌 모든 계좌 유형 시각화 컬러 추세 캔들 (매수/매도/약세/변화) + 매수/매도 화살표 추가 모듈 세션 마켓 박스 (
SR Liquidity
Oleg Rodin
5 (2)
SR Liquidity 는 시장 유동성이 집중되고 가격이 가장 강력하게 반응하는 숨겨진 구간을 포착하도록 설계된 트레이딩 지표입니다. 이러한 특수 유동성 구간은 강력한 지지 및 저항선 역할을 하며, 시장 반전 가능성이 가장 높은 지점을 명확하게 보여주는 지도가 되어 줍니다. SR Liquidity는 일반적인 지지 및 저항선을 단순히 그리는 대신, 실제 가격 움직임을 분석하여 매수 및 매도 압력이 집중되는 구간을 포착합니다. 이러한 구간은 실질적인 시장의 흐름을 주도하는 유동성 풀(liquidity pools)에 해당합니다. 이 지표는 해당 구간을 차트에 직접 시각화하여, 가격 반응이 실제로 나타나기 전에 이를 미리 예측할 수 있도록 돕습니다. 즉, 가격 추세가 전환될 가능성을 사전에 파악하게 해주는 것입니다. 결과적으로 이 지표는 가공되지 않은 가격 움직임(price action)을 시장의 핵심 가격대, 다시 말해 추세 전환점이 될 수 있는 지점들을 보여주는 명확하고 실용적인 로드맵
AW Prime Oscillator
AW Trading Software Limited
5 (1)
두 개의 오실레이터의 조합. 첫 번째 항목은 진입점을 표시하고 두 번째 항목은 현재 추세를 표시합니다. 표시기는 두 가지 모드의 화살표로 오실레이터 신호를 표시할 수 있습니다. 모든 빠른 오실레이터 신호 또는 현재 추세 방향의 신호만 표시할 수 있습니다. 다중 시간대 패널과 세 가지 유형의 신호 알림이 있습니다. 이익: 일일 및 스캘핑 거래에 적합 추세 필터링 간단하고 민감한 설정 다중 시간대 패널 Advisor에 통합하는 데 적합합니다. 모든 기호 및 기간에서 작동합니다. 세 가지 유형의 알림 MT5 version ->  HERE  / Problem solving ->  HERE 지표 전략 표시기는 두 개의 서로 다른 오실레이터로 구성됩니다. 느린 추세선(두꺼움) - 지표의 고수준이 위에서 아래로 교차하면 하락세 지표이고, 낮은 수평 수준(지표의 낮은 수준)이 아래에서 위로 교차하면 하락 추세 지표입니다. 상승 경향. 또한, 하단 영역에서 느린 선을 발견하면 현재 추세가 하락세임을
Atomic Analyst
Issam Kassas
5 (14)
Atomic Analyst — MetaTrader 4 제품 문의, 설정 안내 또는 기술 지원이 필요하면 MQL5에서 직접 메시지를 보내 주세요. 이 인디케이터는 복잡한 시장 계산을 단순한 시각적 신호, 색상 표시 캔들, 추세 판독, 손절 레벨 및 여러 익절 구간으로 변환하여 트레이더가 빠르게 이해하고 실제 시장 상황에서 사용할 수 있게 합니다. 주요 거래 용도: 스캘핑 및 인트라데이 거래: 빠른 의사결정, 명확한 화살표, 알림, 캔들 색상 및 구조화된 진입/청산 구간을 위해 설계되었습니다. 데이 트레이딩 및 스윙 트레이딩: 추세 방향, 강도, 모멘텀 및 다중 시간대 분석을 사용하여 더 큰 시장 움직임을 따라갈 수 있도록 돕습니다. 주요 기능: • Price Action, 강도 및 모멘텀 분석 • 다중 시간대 추세 스캐너 • 전체 추세 비율 계산 • 매수 및 매도 화살표 • 손절 및 여러 익절 레벨 • 최대 5개의 피보나치 기반 익절 레벨 • 트레일링 스톱 로직 • 추세 및 모멘텀
Smart Trend Trading System
Issam Kassas
4.8 (10)
Smart Trend Trading System은 추세 정보, 진입·청산 신호, 가격 수준을 하나의 차트에 표시하는 MetaTrader 4용 지표입니다. 이 시스템은 추세 감지, 반전 구간, Smart Cloud, 트레일링 스톱 로직, 지지와 저항, 캔들 색상 표시, 알림, 다중 시간대 분석 등 10개 이상의 트레이딩 도구 를 하나의 시스템으로 결합합니다. 이 시스템은 다양한 시장 상황에서 거래를 돕도록 설계되었습니다: 추세장: 주요 추세를 식별하고, 되돌림을 감지하며, 모멘텀을 따라가고, 손절 가이드와 트레일링 스톱 옵션을 사용해 더 깔끔한 진입 지점을 찾습니다. 횡보장: 박스권 시장 상황을 감지하고, 반응 구간을 식별하며, 가격이 중요한 레벨에서 반응할 때 더 명확한 신호를 받을 수 있습니다. 스캘핑 및 인트라데이 거래: 빠른 신호, 캔들 색상, 알림, 다중 시간대 확인을 사용하여 단기 거래 결정을 지원합니다. 주요 기능: • 10개 이상의 인디케이터를 하나의 트레이딩 시스
Currency Strength Wizard
Oleg Rodin
4.85 (61)
통화 강도 마법사는 성공적인 거래를 위한 올인원 솔루션을 제공하는 매우 강력한 지표입니다. 표시기는 여러 시간 프레임의 모든 통화 데이터를 사용하여 이 또는 해당 외환 쌍의 힘을 계산합니다. 이 데이터는 특정 통화의 힘을 확인하는 데 사용할 수 있는 사용하기 쉬운 통화 지수 및 통화 전력선의 형태로 표시됩니다. 필요한 것은 거래하려는 차트에 표시기를 부착하는 것뿐입니다. 표시기는 거래하는 통화의 실제 강세를 보여줍니다. 지표는 또한 추세와 거래할 때 유리하게 사용할 수 있는 구매 및 판매 거래량 압력의 극한값을 보여줍니다. 지표는 또한 피보나치에 기반한 가능한 대상을 보여줍니다. 표시기는 PUSH 알림을 포함한 모든 유형의 알림을 제공합니다. 구매 후 연락주세요. 나는 당신과 거래 팁을 공유하고 당신에게 무료로 훌륭한 보너스 지표를 줄 것입니다! 나는 당신에게 행복하고 유익한 거래를 기원합니다!
M1 Sniper
Oleg Rodin
4.97 (30)
M1 SNIPER 는 사용하기 쉬운 거래 지표 시스템입니다. M1 시간대에 맞춰 설계된 화살표 지표입니다. 이 지표는 M1 시간대 스캘핑을 위한 단독 시스템으로 사용할 수 있으며, 기존 거래 시스템의 일부로도 사용할 수 있습니다. 이 거래 시스템은 M1 시간대 거래용으로 특별히 설계되었지만, 다른 시간대에도 사용할 수 있습니다. 원래는 XAUUSD와 BTCUSD 거래를 위해 이 방법을 설계했지만, 다른 시장 거래에도 유용하다는 것을 알게 되었습니다. 이 지표의 신호는 추세 방향과 반대로 거래될 수 있습니다. 저는 지표의 신호를 활용하여 양방향으로 거래할 수 있도록 돕는 특별한 거래 기법을 알려드립니다. 이 방법은 특별한 동적 지지선과 저항선 가격 영역을 활용하는 것을 기반으로 합니다. 구매하시면 M1 SNIPER 화살표 지표를 바로 다운로드하실 수 있습니다. 또한, 아래 스크린샷에 표시된 Apollo Dynamic SR 지표는 M1 SNIPER 도구를 사용하는 모든 사용자에게 무료로
Trend Lines PRO
Roman Podpora
5 (1)
트렌드 라인즈 프로       이 지표는 시장이 실제로 어떤 방향으로 전환되는지 파악하는 데 도움이 됩니다. 실제 추세 반전 지점과 주요 시장 참여자들이 다시 진입하는 지점을 보여줍니다. 보시다시피       BOS 라인       복잡한 설정이나 불필요한 노이즈 없이 더 높은 시간대의 추세 변화와 주요 레벨을 확인할 수 있습니다. 신호는 차트에 다시 그려지지 않고 캔들이 마감된 후에도 계속 표시됩니다. VERSION MT 5   -   RFI LEVELS PRO   표시기   와 결합할 때 최대 잠재력을 발휘합니다. 지표가 보여주는 내용: 실제 변화       추세(BOS 라인) 한 번 신호가 나타나면 그 신호는 계속 유효합니다! 이는 신호를 발생시킨 후 변경될 수 있는 리페인팅 방식의 지표와 중요한 차이점입니다. 리페인팅 방식의 지표는 잠재적으로 자금 손실로 이어질 수 있습니다. 이제 더욱 높은 확률과 정확도로 시장에 진입할 수 있습니다. 또한 화살표가 나타난 후 목표가(익절)
PRO Renko System
Oleg Rodin
5 (31)
PRO Renko System 은 RENKO 차트 거래를 위해 특별히 고안된 매우 정확한 거래 시스템입니다. 이것은 다양한 거래 상품에 적용될 수있는 보편적 인 시스템입니다. 체계는 효과적으로 당신에게 정확한 반전 신호에 접근을 주는 소위 시장 소음을 중화합니다. 이 표시기는 사용하기가 매우 쉽고 신호 생성을 담당하는 매개 변수가 하나만 있습니다. 당신은 쉽게 당신의 선택의 어떤 무역 계기에 공구를 적응시킬 수 있고 renko 막대기의 크기. 나는 항상 당신이 내 소프트웨어로 수익성있게 거래 할 수 있도록 추가 지원을 제공 할 준비가되어 있습니다! 나는 당신에게 행복하고 수익성있는 거래를 기원합니다! 구매 후 저에게 연락하십시오! 내 렌코 차트 생성기를 보내드립니다. 또한 내 개인 권장 사항 및 시스템의 다른 모듈을 무료로 공유 할 것입니다!
Advanced Currency Strength28 Indicator
Bernhard Schweigert
4.91 (659)
현재 40% 할인 초보자 또는 전문가 트레이더를 위한 최고의 솔루션! 이 지표는 우리가 독점 기능과 새로운 공식을 통합했기 때문에 독특하고 고품질이며 저렴한 거래 도구입니다. 단 하나의 차트로 28 Forex 쌍의 통화 강도를 읽을 수 있습니다! 새로운 추세 또는 스캘핑 기회의 정확한 트리거 포인트를 정확히 찾아낼 수 있기 때문에 거래가 어떻게 개선될지 상상해 보십시오. 사용 설명서: 여기를 클릭  https://www.mql5.com/en/blogs/post/697384 그것이 첫 번째, 원본입니다! 쓸모없는 지망생 클론을 사지 마십시오. 더 스페셜  강력한 통화 모멘텀을 보여주는 하위 창의 화살표 GAP가 거래를 안내합니다! 기본 또는 호가 통화가 과매도/과매도 영역(외부 시장 피보나치 수준)에 있을 때 개별 차트의 기본 창에 경고 표시가 나타납니다. 통화 강도가 외부 범위에서 떨어질 때 풀백/반전 경고. 교차 패턴의 특별 경고 추세를 빠르게 볼 수 있는 다중 시간
Neuro Poseidon MT4
Daria Rezueva
4.74 (46)
Neuro Poseidon is a new indicator by Daria Rezueva. It combines precise trading signals with adaptive TP/SL levels - creating best possible trades as a result! Message me and get  Neuro Poseidon Assistant  as a gift to automize your trading process! What makes it stand out? 1. Proven profitability on all assets and timeframes 2. Only confirmed BUY and SELL signals present on the chart 3. Adaptive TP & SL levels generated by the software for each trade 4. Easy to understand - suitable for all
Scalper Vault
Oleg Rodin
5 (39)
Scalper Vault는 당일 매매(intraday trading)에서 일관된 성과를 내고자 하는 트레이더를 위해 설계된, 강력하고 모든 기능을 갖춘 트레이딩 시스템입니다. 이 고정밀 지표는 외환(Forex) 및 바이너리 옵션 트레이더 모두에게 기관급 분석을 제공하는 독립적인 종합 트레이딩 시스템 역할을 합니다. 구매 후 저에게 연락해 주시면, 트레이딩 팁과 함께 특별한 보너스를 제공해 드립니다! Scalper Vault는 추측에 의존하거나 복잡한 수동 분석을 할 필요를 없애주며, 사용하기 쉬운 트레이딩 기법을 통해 오직 매매 실행에만 집중할 수 있도록 돕습니다. 정확한 추세 추종 신호: 핵심 알고리즘이 시장 구조를 분석하여, 지배적인 시장 추세 방향과 일치하는 고확률 신호만을 제공함으로써 잘못된 진입을 획기적으로 줄여줍니다. 정밀한 고점 및 저점 탐지: 시장의 움직임이 소진되는 지점을 스캔하여 잠재적인 반전 구간을 식별합니다. 간(Gann) 이론 기반의 매수/매도 구간: 수학적
Break and Retest Hunter MT4 is a powerful MetaTrader 5 indicator designed to automatically identify support and resistance levels, breakout structures, and potential retest opportunities in real time. Bonus Indicator: After purchasing Break and Retest Hunter , contact me to receive Trade Indicator Assistant EA completely free as a bonus utility. $65 for the next 10 copies . Next price is $120.  Combining adaptive market analysis, clear BUY/SELL signals, Fibonacci-based profit targets, and a pre
Scalper Inside PRO
Alexey Minkov
4.74 (69)
Scalper Inside PRO helps you read the intraday trend and plan a trade before you enter the market. It is built around three exclusive strategies for a sharper read of the market. The moment a signal appears, the indicator evaluates market direction and calculates the key levels, so you see the potential entry, the expected stop-loss and several profit-taking levels in advance. Detailed performance statistics show how different instruments and strategies performed in history and help you pick ass
Liquidity Scalper System
Stanislav Konin
5 (1)
Liquidity Scalper System: 인디케이터 형식의 유동성 기반 트레이딩 시스템입니다. 대부분의 인디케이터는 화살표만 보여주고, 손절을 어디에 둘지, 목표가 어디인지, 신호를 믿어도 되는지는 트레이더가 스스로 판단해야 합니다. Liquidity Scalper System은 거래의 전체 주기를 다룹니다. 유동성 풀을 찾고, 돌파 시 신호를 주며, Entry, Stop Loss와 세 개의 목표를 즉시 계산하고, 패널에 통계와 새로운 데이터에 대한 검증 결과를 표시합니다. 설정은 시스템이 스스로 선택하고 매일 업데이트합니다. 작동 방식 1. 시스템이 유동성 풀을 찾습니다. 시장 참여자들의 스톱 주문이 쌓여 있는 레벨입니다. 2. 가격이 풀을 돌파하고 그 돌파가 움직임의 강도(필요 시 거래량)로 확인되면 차트에 BUY 또는 SELL 화살표가 나타납니다. 3. Entry, Stop Loss, TP1, TP2, TP3 레벨이 영역 채우기와 함께 즉시 그려집니다. 4. 오른쪽에 유
Currency Strength Exotics
Bernhard Schweigert
4.88 (33)
현재 20% 할인! 초보자 또는 전문가 트레이더를 위한 최고의 솔루션! 이 표시기는 Exotic Pairs Commodities, Indexes 또는 Futures와 같은 기호에 대한 통화 강도를 표시하는 데 특화되어 있습니다. 금, 은, 석유, DAX, US30, MXN, TRY, CNH 등의 진정한 통화 강도를 보여주기 위해 9번째 줄에 모든 기호를 추가할 수 있습니다. 이것은 독특하고 고품질이며 저렴한 거래 도구입니다. 우리는 많은 독점 기능과 새로운 공식을 통합했습니다. 새로운 추세 또는 스캘핑 기회의 정확한 트리거 포인트를 정확히 찾아낼 수 있기 때문에 거래가 어떻게 개선될지 상상해 보십시오. 사용 설명서: 여기를 클릭 https://www.mql5.com/en/blogs/post/708876 모든 시간대에 작동합니다. TREND를 빠르게 확인할 수 있습니다! 새로운 기본 알고리즘을 기반으로 설계되어 잠재적인 거래를 더욱 쉽게 식별하고 확인할 수 있습니다. 8개의
Trend Catcher ind
Ramil Minniakhmetov
5 (11)
트렌드 캐처 인디케이터 트렌드 캐처 인디케이터는 개발자가 자체 개발한 맞춤형 적응형 트렌드 분석 지표들을 조합하여 시장 가격 움직임을 분석합니다. 단기적인 노이즈를 제거하고 근본적인 모멘텀 강도, 변동성 확대, 가격 구조 움직임에 집중하여 진정한 시장 방향을 파악합니다. 또한 이동 평균, RSI, 변동성 필터와 같은 맞춤형 지표들을 활용하여 가격을 평활화하고 트렌드를 필터링합니다. 실제 운영 모니터링 및 기타 제품은 다음 링크에서 확인하실 수 있습니다: https://www.mql5.com/en/users/mechanic/seller 텔레그램에서는 EA나 설정 파일을 판매하지 않습니다. 사기이니 주의하세요. 모든 설정 파일은 블로그에서 무료로 제공됩니다. 중요! 구매 후 즉시 연락 주시면 사용 방법 및 보너스를 드립니다!
Miraculous Indicator Binary & Forex v3 StrategySafe Miraculous Indicator Binary & Forex v3 StrategySafe 는 명확한 신호, 강력한 확인 도구, 그리고 Binary 및 Forex 시장에서 사용할 수 있는 체계적인 거래 방식을 원하는 트레이더를 위한 전문 지표입니다. v3 버전에는 MIR Dashboard, Miraculous Confirmation Dashboard, GANN Law, Square of 9 레벨, GANN 각도, 그리고 더욱 강화된 Forex 모드가 포함되어 있습니다. 주요 기능 Binary 모드와 Forex 모드를 하나의 지표에서 지원. MIR Dashboard로 빠른 시장 흐름 확인. Miraculous Confirmation Dashboard로 진입 신호 확인. Forex 분석을 위한 GANN Law drawing lines. Square of 9 라인, 레벨, 방향 표시. 1x1 G
ICT Pro 4
Robby Suhendrawan
MT4용 Ultimate AIO ICT Concept Indicator: Smart Money Concepts 자동 마스터 매일 수동으로 차트를 작성하는 데 몇 시간씩 보내는 것에 지치셨습니까? AIO ICT Concept 지표는 Smart Money Concepts를 마스터하기 위한 완벽한 올인원 솔루션입니다. 수동 기술 분석의 추측과 감정적 피로를 없애기 위해 설계된 이 강력한 알고리즘 도구는 가장 중요한 가격 행동 요소를 차트에 자동으로 표시합니다. 시장 방향 및 상위 시간 프레임 편향 (High Timeframe Bias) 마스터: 시장이 어디로 가고 있는지 아는 것이 절반의 성공입니다. 당사의 고급 Market Structure 매핑 및 Change in State of Delivery (CISD) 감지를 통해 진정한 시장 추세를 즉시 파악할 수 있습니다. 일일 및 주간 방향 편향을 한눈에 쉽게 확인할 수 있습니다. 스윙 및 일중 트레이더의 경우 이 지표는 H4, H1 및
Volume Orderflow Profile
Suvashish Halder
5 (2)
Introducing Volume Orderflow Profile , a versatile tool designed to help traders visualize and understand the dynamics of buying and selling pressure within a specified lookback period. Perfect for those looking to gain deeper insights into volume-based market behavior! MT5 Version -  https://www.mql5.com/en/market/product/122657 The indicator gathers data on high and low prices, along with buy and sell volumes, over a user-defined period. It calculates the maximum and minimum prices during this
"The Squeeze indicator attempts to identify periods of consolidation in a market. In general the market is either in a period of quiet consolidation or vertical price discovery. By identifying these calm periods, we have a better opportunity of getting into trades with the potential for larger moves. Once a market enters into a "squeeze," we watch the overall market momentum to help forecast the market direction and await a release of market energy." Modified TTM Squeeze Indicator is a modifica
This is a professional chart indicator designed for traders focused on stability and clear price action. It helps filter market noise and provides clear visual entry and exit zones for your trading decisions. Core Features: Strictly Non-Repainting: The system is built with strict non-repaint logic. What you see on the chart is the true historical performance. Confirmed Signals: Signals are triggered and confirmed only after the candle closes . Once a trading arrow appears on a closed candle, it
Currency Pulse — MetaTrader 4용 통화 강약 순위 패널 용도 Currency Pulse는 차트 위의 하나의 콤팩트한 패널에서 지금 어떤 통화가 강하고 어떤 통화가 약한지를 여러 시간대에 걸쳐 동시에 보여 줍니다. 이 순위를 바탕으로 통화 간 괴리가 가장 큰 통화쌍을 알려 줍니다. 강한 통화를 매수하고 약한 통화를 매도하는 방식입니다. 인디케이터는 적용된 차트의 종목과 무관하게 작동합니다. MT5 -version:  https://www.mql5.com/en/market/product/200977 작동 방식 선택한 통화들은 활성화한 각 시간대에서 서로 비교되어 강한 순서대로 정렬됩니다. 색상 막대는 움직임의 크기를 나타냅니다. Total 열은 모든 시간대를 각 통화의 하나의 종합 점수로 합칩니다. Open chart 열은 순위에서 가장 유망한 통화쌍(강한 통화 대 약한 통화)을 골라 방향(buy 또는 sell)을 표시합니다. 행을 클릭하면 차트가 열립니다. 사용
Gann Made Easy
Oleg Rodin
4.84 (172)
Gann Made Easy 는 mr.의 이론을 사용하여 최고의 거래 원칙을 기반으로 하는 전문적이고 사용하기 쉬운 Forex 거래 시스템입니다. W.D. 간. 이 표시기는 Stop Loss 및 Take Profit Levels를 포함하여 정확한 BUY 및 SELL 신호를 제공합니다. PUSH 알림을 사용하여 이동 중에도 거래할 수 있습니다. 구매 후 거래 방법 안내 및 유용한 추가 지표를 무료로 받으시려면 저에게 연락주세요! 아마도 Gann 거래 방법에 대해 이미 여러 번 들었을 것입니다. 일반적으로 Gann의 이론은 초보자 거래자뿐만 아니라 이미 거래 경험이 있는 사람들에게도 매우 복잡한 것입니다. Gann의 거래 방식은 이론적으로 적용하기 쉽지 않기 때문입니다. 나는 그 지식을 연마하고 Forex 지표에 최고의 원칙을 적용하기 위해 몇 년을 보냈습니다. 표시기는 적용하기가 매우 쉽습니다. 차트에 첨부하고 간단한 거래 권장 사항을 따르기만 하면 됩니다. 지표는 지속적으로 시장 분석
ZONEFUSION PRO INSTITUTIONAL CLUSTER SYSTEM ZoneFusion Pro는 정밀성, 구조, 일관성을 중요하게 생각하는 트레이더를 위해 설계된 전문 외환(Forex) 트레이딩 시스템입니다. 이 시스템은 실제 기관 투자자 로직을 기반으로 구축되었습니다. 본 시스템은 진지한 트레이더, 프로프 펌 챌린지 트레이더, SMC 트레이더를 위해 만들어졌으며, 불확실한 판단을 제거하고 명확한 규칙 기반 실행 구조를 제공합니다. 다중 타임프레임 시장 구조, 수요 및 공급 존, 이동평균선 컨플루언스를 하나의 강력한 트레이딩 엔진으로 통합하여 고확률 진입을 식별합니다. 핵심 기능 멀티 타임프레임 시장 구조 D1 및 H4에서 기관급 수요 및 공급 존 자동 감지 가격이 반응할 가능성이 높은 주요 유동성 영역 표시 시장 구조 변화에 따라 존이 동적으로 업데이트됨 듀얼 이동평균 시스템 빠른 이동평균과 느린 이동평균을 사용하여 추세 방향 정의 약한 신호 및 역추세 거래 필터링 기관
Quantum Trend Sniper MT4
Ian Andrew Nicholson
5 (1)
Quantum Trend Sniper PRO for MetaTrader 4 Quantum Trend Sniper PRO is a professional-grade MT4 indicator built for traders who want selective entries, clear trade structure, and live on-chart decision support . This is not a basic buy/sell arrow tool. It is a complete trading workflow that helps you identify higher-quality setups, project the full trade structure, monitor progression through multiple profit targets, and review trade behavior directly on the chart. Designed for traders who value
Indicator plots price cycle blocks and sends signals with smart volume confirmation. Price cycles and fractals are combined to determine the demand/supply blocks. The indicator can be used alone or combined with other Cycle Indicators Inputs: Period: Recommended value is between 35 and 55( Which are Set 1 and Set 2 periods of cycle sniper ) Engulfing: If true, you will be able to see the engulfing bar confirmation. Volume Filter: True (The  arrow comes with volume confirmation ) Videos with dif
GoldRush Trend Arrow Signal
Kirk Lee Holloway
5 (2)
GoldRush 트렌드 화살표 신호 GoldRush 트렌드 화살표 신호 지표는 XAU/USD 시장에서 고속 단기 스캘핑 트레이더를 위해 설계된 정밀한 실시간 트렌드 분석을 제공합니다. 1분 시간대에 특화되어 설계된 이 도구는 명확한 진입점을 표시하는 방향성 화살표를 제공하여 스캘퍼들이 변동성이 높은 시장 환경에서도 자신 있게 거래할 수 있도록 합니다. 이 지표는 PRIMARY 및 SECONDARY 경고 화살표로 구성됩니다. PRIMARY 신호는 추세 방향의 변화를 나타내는 흰색과 검은색 방향성 화살표이며, SECONDARY 신호는 PRIMARY 화살표가 지시하는 방향을 확인하고 잠재적인 거래 진입점을 표시하는 파란색과 빨간색 화살표입니다. 참고: 추세 방향이 변경된 후 PRIMARY 경고 화살표가 단 하나만 표시될 경우, 다수의 SECONDARY 파란색/빨간색 화살표가 표시될 수 있음을 유의해야 합니다. SECONDARY 신호는 신호 기준을 충족하는 어떤 캔들 이후에도 표시
Top Bottom Tracker MT4
Rodrigo Arana Garcia
탑 바텀 트래커는 시장 추세를 분석하고 추세의 고점과 저점을 감지할 수 있는 정교한 알고리즘을 기반으로 하는 지표입니다 / MT5 버전 . 가격은 500$에 도달할 때까지 점진적으로 상승합니다. 다음 가격 --> $99 특징 다시 칠하지 않음 이 표시기는 새 데이터가 도착해도 값을 변경하지 않습니다 거래 쌍 모든 외환 쌍 기간 모든 기간 파라미터 ==== 인디케이터 구성 ==== 구성 매개 변수 // 40 (값이 높을수록 신호가 적지만 더 정확한 신호가 제공됩니다) 상위 레벨 값 // 80 (상단 수평선의 값) 하단 레벨 값 // 20 (하단 수평선 값) 인디케이터 계산 막대 수 // 3000 (인디케이터를 계산할 막대 수). 값 0은 모든 막대에 대해 인디케이터를 계산합니다) ==== 알람 구성 ==== 팝업 알림 // 참(터미널에서 알람) 이메일 알림 // 참(이메일로 알람 전송) 알람 시간 간격 // 10 (분 단위의 알람 간격) 경고
DayTrader PRO MT4
Davit Beridze
4.6 (10)
DayTrader PRO MT5:  https://www.mql5.com/en/market/product/186222 DayTrader PRO는 존 에러스(John Ehlers)의 Laguerre 필터와 강력한 자동 최적화 엔진을 결합한 고급 트레이딩 지표입니다. 고정된 파라미터를 사용하는 대신, 최근 시장 상황을 바탕으로 최적의 설정을 자동으로 검색하므로 지속적인 수동 조정 없이도 변화하는 시장 변동성에 대응할 수 있습니다. 이 지표는 명확한 매수(BUY) 및 매도(SELL) 신호를 생성하며, 현재 시장 변동성을 기준으로 계산된 적응형 손절매(Stop Loss) 및 익절(Take Profit) 레벨을 제공합니다. 내장된 추세, 효율성 지수(Efficiency Ratio), 변동성 및 캔들 필터 기능은 저품질의 진입 신호를 제거하여 신호의 정확도를 높여줍니다. 실시간 성능 대시보드에서는 현재 최적화된 설정값, 수익 요인(Profit Factor), 승률(Win Rate), 최대 낙폭
제작자의 제품 더 보기
BlueDigitsFx 공식 에코시스템 접근 공식 BlueDigitsFx 에코시스템을 통해 인프라 업데이트, 워크플로우 리소스, 제품 출시 및 에코시스템 접근 권한을 받으세요. Telegram 에코시스템 웹사이트 BlueDigitsFx Precision Order Flow MT5 — MetaTrader 5 완전한 오더플로우 분석 스위트 밸류 에어리어, Point of Control, 경매 컨텍스트, 구조화된 의사결정 지원을 결합한 진지한 MT5 트레이더를 위한 전문적인 세션 기반 시장 구조 프레임워크. 가치가 위치한 곳을 파악하세요 VAH, POC, VAL을 자동으로 모니터링하세요 London 및 New York 세션 구조를 이해하세요 구조화된 시장 컨텍스트로 의사결정 피로를 줄이세요 MetaTrader 5 트레이더를 위해 특별히 설계되었습니다 개발자의 메시지 저는 MetaTrader 5 내에서 세션 구조를 더 명확하게 읽고 싶어서 Precision Order Flow를 개발했습
BlueDigitsFx 공식 생태계 액세스 인프라 업데이트, 트레이딩 리소스, 제품 출시 정보 및 BlueDigitsFx 공식 생태계에 대한 액세스를 받아보세요. Telegram 생태계 웹사이트 MT4 버전 BlueDigitsFx Easy 123 System MT5 — MT5용 강력한 반전 및 돌파 감지 시스템 시장 반전과 돌파를 포착하기 위한 올인원 비재도색(Non-Repaint) 시스템 — 구조적 분석, 명확성 및 확인 기반 트레이딩을 중요하게 생각하는 트레이더를 위해 설계되었습니다. BlueDigitsFx Easy 123 System은 시장 구조 변화, 돌파 및 추세 반전을 쉽고 명확하게 식별할 수 있도록 도와주는 MT5용 시각적 지표 및 알림 시스템입니다. 이 지표는 구조화된 "123" 패턴을 기반으로 작동합니다. 1단계 : 잠재적인 추세 소진 구간에서 큰 화살표(Big Arrow)를 표시하여 새로운 고점 또는 저점을 식별합니다. 2단계 : 시장 구조 돌파를 감지하여 잠
BlueDigitsFx Easy 1 2 3 System
Ziggy Janssen
4.87 (299)
BlueDigitsFx 공식 생태계 액세스 인프라 업데이트, 트레이딩 리소스, 제품 출시 정보 및 BlueDigitsFx 공식 생태계에 대한 액세스를 받아보세요. Telegram 생태계 웹사이트 MT5 버전 BlueDigitsFx Easy 123 System — MT4용 강력한 반전 및 돌파 감지 시스템 시장 반전과 돌파를 포착하기 위한 올인원 비재도색(Non-Repaint) 시스템 — 구조적 분석, 명확성 및 확인 기반 트레이딩을 중요하게 생각하는 트레이더를 위해 설계되었습니다. BlueDigitsFx Easy 123 System은 시장 구조 변화, 돌파 및 추세 반전을 쉽고 명확하게 식별할 수 있도록 도와주는 MT4용 시각적 지표 및 알림 시스템입니다. 이 지표는 구조화된 "123" 패턴을 기반으로 작동합니다. 1단계 : 잠재적인 추세 소진 구간에서 큰 화살표(Big Arrow)를 표시하여 새로운 고점 또는 저점을 식별합니다. 2단계 : 시장 구조 돌파를 감지하여 잠재적인
BlueDigitsFx 공식 생태계 액세스 인프라 업데이트, 트레이딩 리소스, 제품 출시 정보 및 BlueDigitsFx 공식 생태계에 대한 액세스를 받아보세요. Telegram 생태계 웹사이트 MT5 버전 BlueDigitsFx Spike And Strike Reversal MT4 — 시장 반전 및 모멘텀 분석을 위한 복합 오실레이터 BlueDigitsFx Spike And Strike Reversal 은 여러 지표 신호를 결합한 복합 오실레이터로, 트레이더가 잠재적인 시장 반전, 모멘텀 변화 및 추세 소진 상태를 식별할 수 있도록 돕습니다. 이 지표는 오실레이터 기반 확인 기능을 포함한 여러 분석 요소를 통합하며, 차트에 직접 시각적 신호를 표시하여 구조적인 반전 분석을 지원합니다. Spike And Strike는 다양한 시장 환경에서 반전, 되돌림 및 모멘텀 전환 구간에서 추가적인 확인을 원하는 트레이더를 위해 설계되었습니다. 주요 기능 오실레이터 기반의 시각적 반전
BlueDigitsFx 공식 생태계 액세스 인프라 업데이트, 트레이딩 리소스, 제품 출시 정보 및 BlueDigitsFx 공식 생태계에 대한 액세스를 받아보세요. Telegram 생태계 웹사이트 MT4 버전 BlueDigitsFx Spike And Strike Reversal MT5 — 시장 반전 및 모멘텀 분석을 위한 복합 오실레이터 BlueDigitsFx Spike And Strike Reversal 은 여러 지표 신호를 결합한 복합 오실레이터로, 트레이더가 잠재적인 시장 반전, 모멘텀 변화 및 추세 소진 상태를 식별할 수 있도록 돕습니다. 이 지표는 오실레이터 기반 확인 기능을 포함한 여러 분석 요소를 통합하며, 차트에 직접 시각적 신호를 표시하여 구조적인 반전 분석을 지원합니다. Spike And Strike는 다양한 시장 환경에서 반전, 되돌림 및 모멘텀 전환 구간에서 추가적인 확인을 원하는 트레이더를 위해 설계되었습니다. 주요 기능 오실레이터 기반의 시각적 반전
BlueDigitsFx Open Trades MT5
Ziggy Janssen
4.25 (8)
무료 BlueDigitsFx 도구 + 생태계 액세스 이 무료 도구는 BlueDigitsFx 트레이딩 인프라 생태계의 일부입니다. BlueDigitsFx 봇을 통해 업데이트, 워크플로우 리소스, 제품 출시 정보 및 공식 생태계 액세스를 받아보세요. Telegram 생태계 웹사이트 MT4 버전 BlueDigitsFx Open Trades MT5 — 능동적인 포지션 관리를 위한 실시간 핍 모니터 BlueDigitsFx Open Trades는 모든 열린 거래의 총 핍 결과를 실시간으로 차트에 직접 표시하는 무료 MT5 유틸리티입니다. 이 도구는 색상으로 구분된 깔끔한 표시 방식을 사용하여 활성 거래와 통화쌍 전반에서 수익 및 손실 포지션을 빠르게 파악할 수 있도록 도와줍니다. 여러 창을 계속 전환하지 않고도 거래 상태를 보다 명확하게 파악하고, 포지션을 빠르게 관리하며, 활성 거래 세션을 효율적으로 모니터링하고자 하는 트레이더를 위해 설계되었습니다. 열린 거래의 전체 성과를 차트에
FREE
Official BlueDigitsFx Ecosystem Access Get infrastructure updates, workflow resources, product releases, and ecosystem access through the official BlueDigitsFx ecosystem. Telegram Ecosystem Website MT4 Version BlueDigitsFx Command Center — MT5 Trading Dashboard for Execution, Risk Management & Market Analysis BlueDigitsFx Command Center is a professional MT5 execution and workflow dashboard designed to help traders manage entries, risk, market direction, momentum, and session awareness from
BlueDigitsFx Open Trades
Ziggy Janssen
4.89 (27)
무료 BlueDigitsFx 도구 + 생태계 액세스 이 무료 도구는 BlueDigitsFx 트레이딩 인프라 생태계의 일부입니다. BlueDigitsFx 봇을 통해 업데이트, 워크플로우 리소스, 제품 출시 정보 및 공식 생태계 액세스를 받아보세요. Telegram 생태계 웹사이트 MT5 버전 BlueDigitsFx Open Trades MT4 — 능동적인 포지션 관리를 위한 실시간 핍 모니터 BlueDigitsFx Open Trades는 모든 열린 거래의 총 핍 결과를 실시간으로 차트에 직접 표시하는 무료 MT4 유틸리티입니다. 이 도구는 색상으로 구분된 깔끔한 표시 방식을 사용하여 활성 거래와 통화쌍 전반에서 수익 및 손실 포지션을 빠르게 파악할 수 있도록 도와줍니다. 여러 창을 계속 전환하지 않고도 거래 상태를 보다 명확하게 파악하고, 포지션을 빠르게 관리하며, 활성 거래 세션을 효율적으로 모니터링하고자 하는 트레이더를 위해 설계되었습니다. 열린 거래의 전체 성과를 차트에
FREE
BlueDigitsFx Symbol Changer
Ziggy Janssen
4.85 (13)
무료 BlueDigitsFx 도구 + 생태계 액세스 이 무료 도구는 BlueDigitsFx 트레이딩 인프라 생태계의 일부입니다. BlueDigitsFx 봇을 통해 업데이트, 워크플로우 리소스, 제품 출시 정보 및 공식 생태계 액세스를 받아보세요. Telegram 생태계 웹사이트 BlueDigitsFx Symbol Changer MT4 — MetaTrader 4 분석 효율성을 높여주는 원클릭 심볼 전환 도구 BlueDigitsFx Symbol Changer는 기존 차트의 심볼을 빠르게 변경하면서도 지표, 객체, 템플릿 및 차트 설정을 그대로 유지할 수 있는 가벼운 MT4 유틸리티입니다. 여러 금융상품을 분석하는 MetaTrader 4 트레이더를 위해 설계되었으며, 새로운 차트를 열거나 작업 환경을 다시 구성하지 않고도 시장 간 전환을 더욱 빠르게 수행할 수 있습니다. 심볼을 변경하더라도 동일한 차트 레이아웃을 유지할 수 있어 시장 스캔 속도를 높이고, 여러 종목을 효율적으로 비교
FREE
*Non-Repainting Indicator Arrow Indicator with Push Notification based on the Synthethic Savages strategy for synthethic indices on binary broker. Signals will only fire when the Synthethic Savages Strategy Criteria is met BUT MUST be filtered. Best Signals on Fresh Alerts after our Savage EMA's Cross. Synthethic Savage Alerts is an indicator that shows entry signals with the trend. A great tool to add to any chart.  Best Signals occur on Fresh Alerts after our Savage EMA's Cross + Signals on
BlueDigitsFx 공식 생태계 액세스 인프라 업데이트, 트레이딩 리소스, 제품 출시 정보 및 BlueDigitsFx 공식 생태계에 대한 액세스를 받아보세요. Telegram 생태계 웹사이트 BlueDigitsFx Command Center — MT4 실행, 리스크 관리 및 시장 분석 대시보드 BlueDigitsFx Command Center는 트레이더가 진입, 리스크, 시장 방향, 모멘텀 및 세션 개요를 하나의 중앙 집중식 환경에서 관리할 수 있도록 설계된 전문 MT4 실행 및 워크플로우 대시보드입니다. BlueDigitsFx 트레이딩 인프라 생태계의 일부인 Command Center는 주문 실행 도구, 고급 로트 계산, 브레이크이븐 관리, 트레일링 스톱 제어, 캔들 방향 분석, 모멘텀 분석, 멀티 타임프레임 추세 개요 및 통화 강도 모니터링 기능을 통합합니다. 다양한 종목, 시간대 및 트레이딩 스타일에서 더 깔끔한 실행, 더 빠른 포지션 관리 및 더 체계적인 워크플로우를
BlueDigitsFx 공식 생태계 액세스 인프라 업데이트, 트레이딩 리소스, 제품 출시 정보 및 BlueDigitsFx 공식 생태계에 대한 액세스를 받아보세요. Telegram 생태계 웹사이트 MT4 버전 BlueDigitsFx OBV Divergence MT5 — 시장 반전을 식별하기 위한 거래량 다이버전스 지표 BlueDigitsFx OBV Divergence는 가격 움직임과 On-Balance Volume(OBV) 지표 간의 강세 및 약세 다이버전스를 식별하도록 설계된 MT5 지표입니다. 가격 움직임과 거래량 행동을 비교함으로써 이 지표는 다양한 시장 환경에서 잠재적인 추세 소진, 반전 조건 및 모멘텀 변화를 식별하는 데 도움을 줍니다. 이 지표는 차트에 다이버전스 패턴을 직접 표시하여 거래량 기반의 추가 확인과 함께 시장 구조를 분석할 수 있도록 지원합니다. 주요 기능 자동 다이버전스 감지 — 차트에서 강세 및 약세 OBV 다이버전스를 자동으로 식별합니다. 거래량
필터:
611214
159
611214 2022.09.13 17:23 

Great indicator , Great service , Great results in my challenge account (eurusd, audusd,us30 ,ger30,BTC,Gold and Usdcad), thank you very much Ziggy, God bless you .

Tyrone71
44
Tyrone71 2021.11.11 15:26 

Love the divergence indicator with alerts. Thanks BlueDigitsFX!!

diligentnfree
65
diligentnfree 2021.09.22 12:35 

Simply amazing..its all about being patient and allowing this tool to instruct you.. Divergence made simple..

Tevita Finau
330
Tevita Finau 2021.09.16 09:23 

arrow appear 2 candle back. no good

Ziggy Janssen
62844
개발자의 답변 Ziggy Janssen 2021.09.16 09:46
Else you would get repainting / fake divergence alerts Please reconsider your review, thanks
bryna
79
bryna 2021.03.07 21:58 

Very positive experience especially with the owner who was very helpful. I will be looking at this to improve my consistency and some clearer judgement!

Ziggy Janssen
62844
개발자의 답변 Ziggy Janssen 2021.09.16 09:46
Thanks for the lovely review! Will you be so kind to also give a star rating? :)
mygb
419
mygb 2020.11.30 11:58 

Easy to use tool, great support group

Neeks26
79
Neeks26 2020.11.30 02:08 

This will my first time using blue digitz products and i look forward to a great trading experience. Its worth following the Telegram group where everything is transparent. You can also trade in the free group and see the results. I think its amazing along with their dynamic team. Looking forward to amazing results.

iadde30
61
iadde30 2020.11.02 09:51 

Probably the only indicator I need! Started using OVB about a year ago but since I purchased this it has saved me time analysing mutiple pairs, finding deviation and market direction. Absolutely worth the money.

Nodrog
65
Nodrog 2020.10.16 17:23 

Good indicator, this is a good group to help bring trading success

96645392
75
96645392 2020.10.15 23:24 

사용자가 평가에 대한 코멘트를 남기지 않았습니다

nimdeos
104
nimdeos 2020.10.15 21:27 

사용자가 평가에 대한 코멘트를 남기지 않았습니다

xpforex
2053
xpforex 2020.10.15 14:20 

Very Helpful Indicator!!! the best

P Hemantha Manoj
164
P Hemantha Manoj 2020.09.20 11:17 

사용자가 평가에 대한 코멘트를 남기지 않았습니다

Giu lio
88
Giu lio 2020.09.18 17:31 

사용자가 평가에 대한 코멘트를 남기지 않았습니다

tjw35714
24
tjw35714 2020.09.16 14:39 

I love using divergence. It helps refine my trading strategy. I can see the charts better. It's amazing. I have backtested this indicator and I was blown away about how reliable it is. thanks ziyggy/bluedigits. You are the best

Alvin Lim Loong Sun
148
Alvin Lim Loong Sun 2020.09.11 04:33 

If you trade divergence, dont too rely solely on rsi, stoch or macd , you must include volume, and im glad that i have spent my 50usd at the right place! very good support from Ziggy! You definitely cant missed out this indicator if you are trading divergence

Nicolas Millot
249
Nicolas Millot 2020.08.14 10:33 

Nice indicator, helps a lot in your decisions. The author is always here to help.

ZJYY9788
160
ZJYY9788 2020.08.06 16:45 

Very good indicator!

CasaDePapel1
19
CasaDePapel1 2020.07.31 16:21 

사용자가 평가에 대한 코멘트를 남기지 않았습니다

ddgonzales
129
ddgonzales 2020.07.22 07:30 

Awesome Indi! Great indi to add to your trading plan. Ziggy outdid it on this one! Thanks, Ziggy! :)

12
리뷰 답변